. 2020 Jul 29;40(31):6007-6017.
doi: 10.1523/JNEUROSCI.0396-20.2020. Epub 2020 Jun 17.

Tinnitus Does Not Interfere with Auditory and Speech Perception

Affiliations

Tinnitus Does Not Interfere with Auditory and Speech Perception

Fan-Gang Zeng et al. J Neurosci. .

Abstract

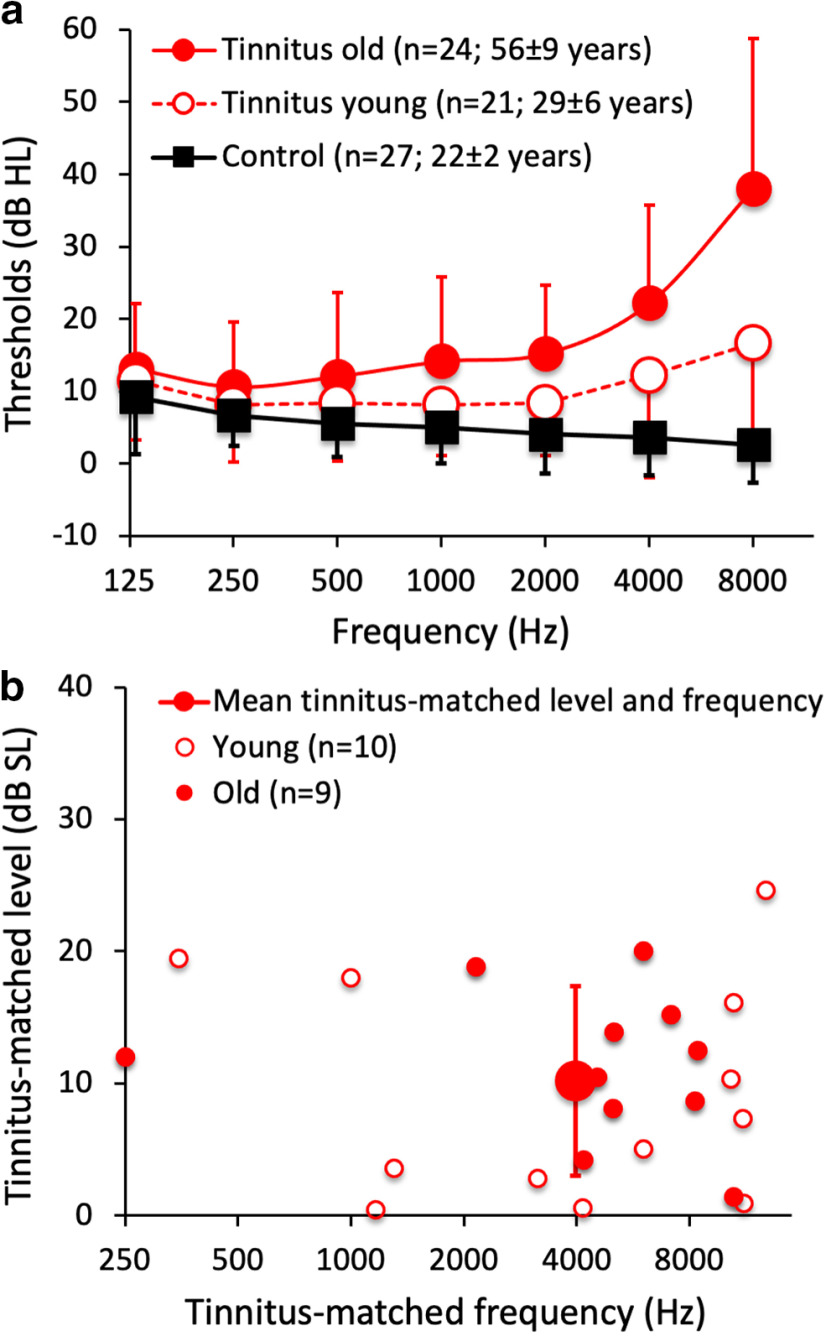
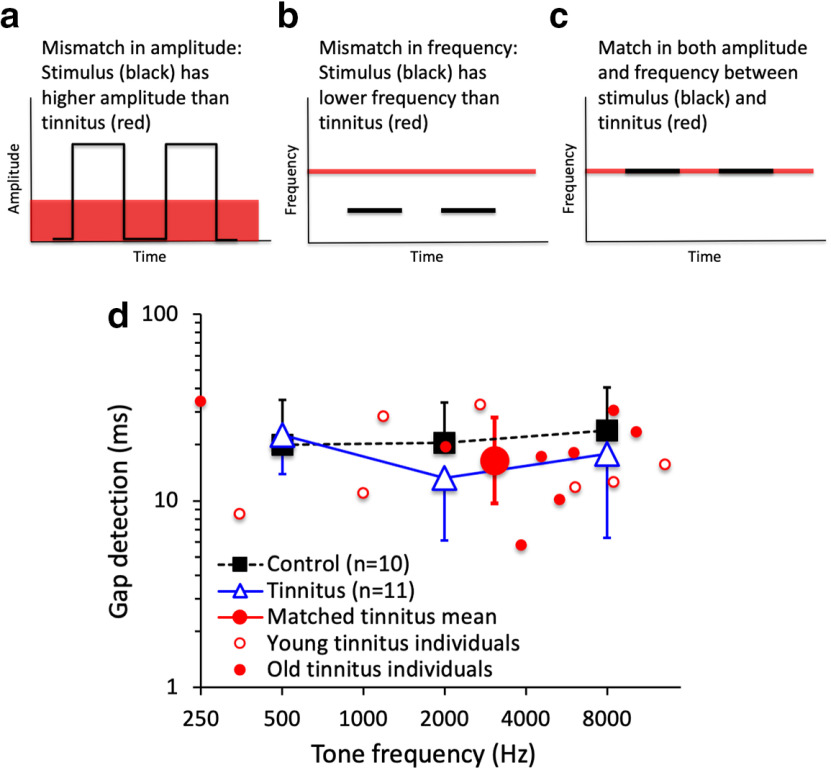
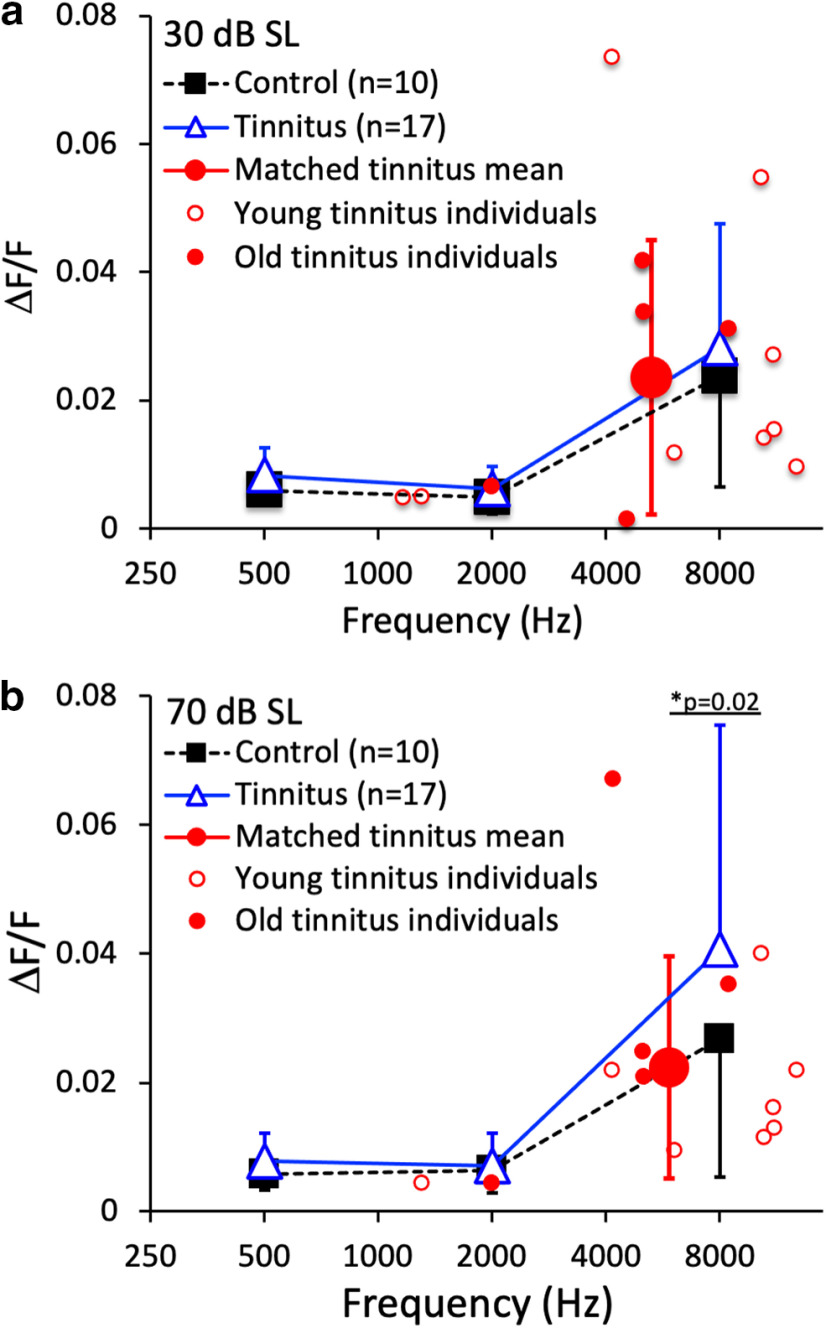
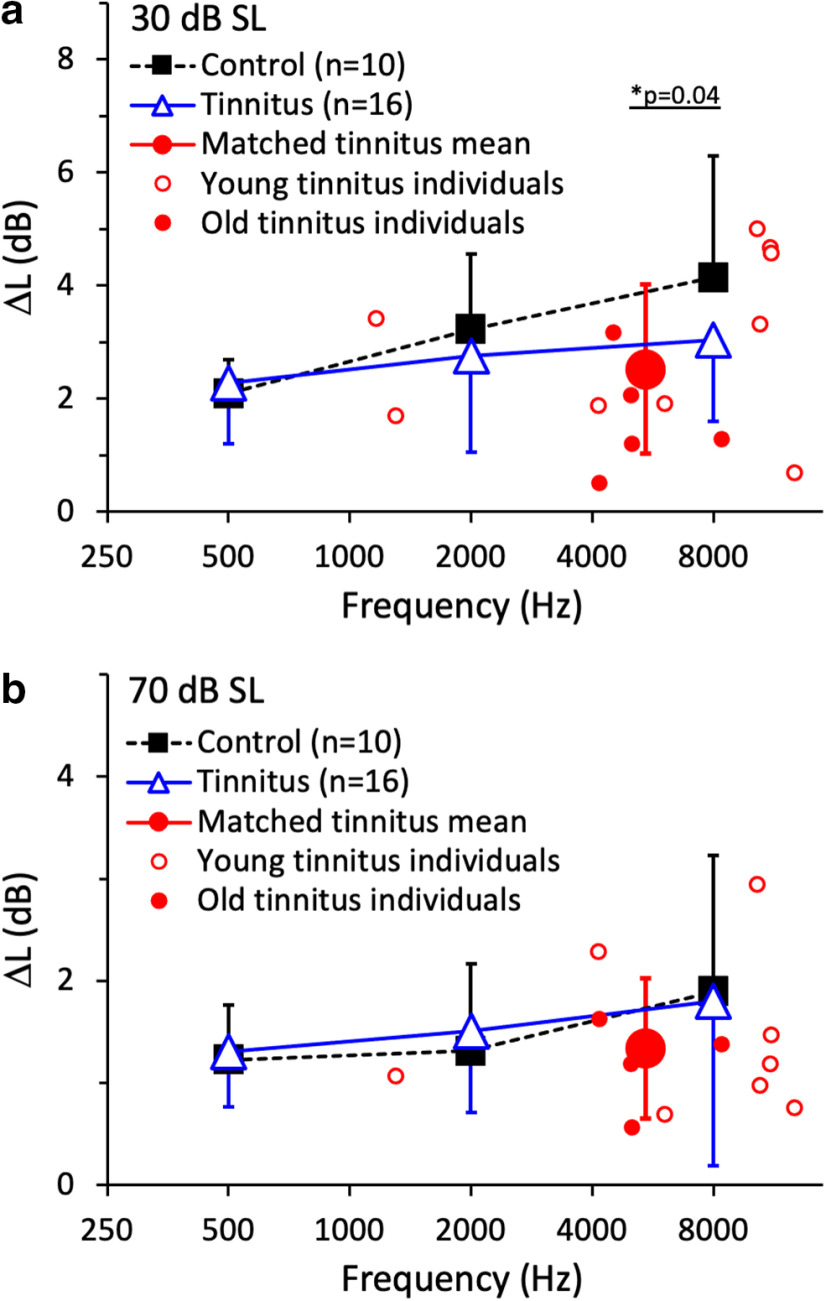
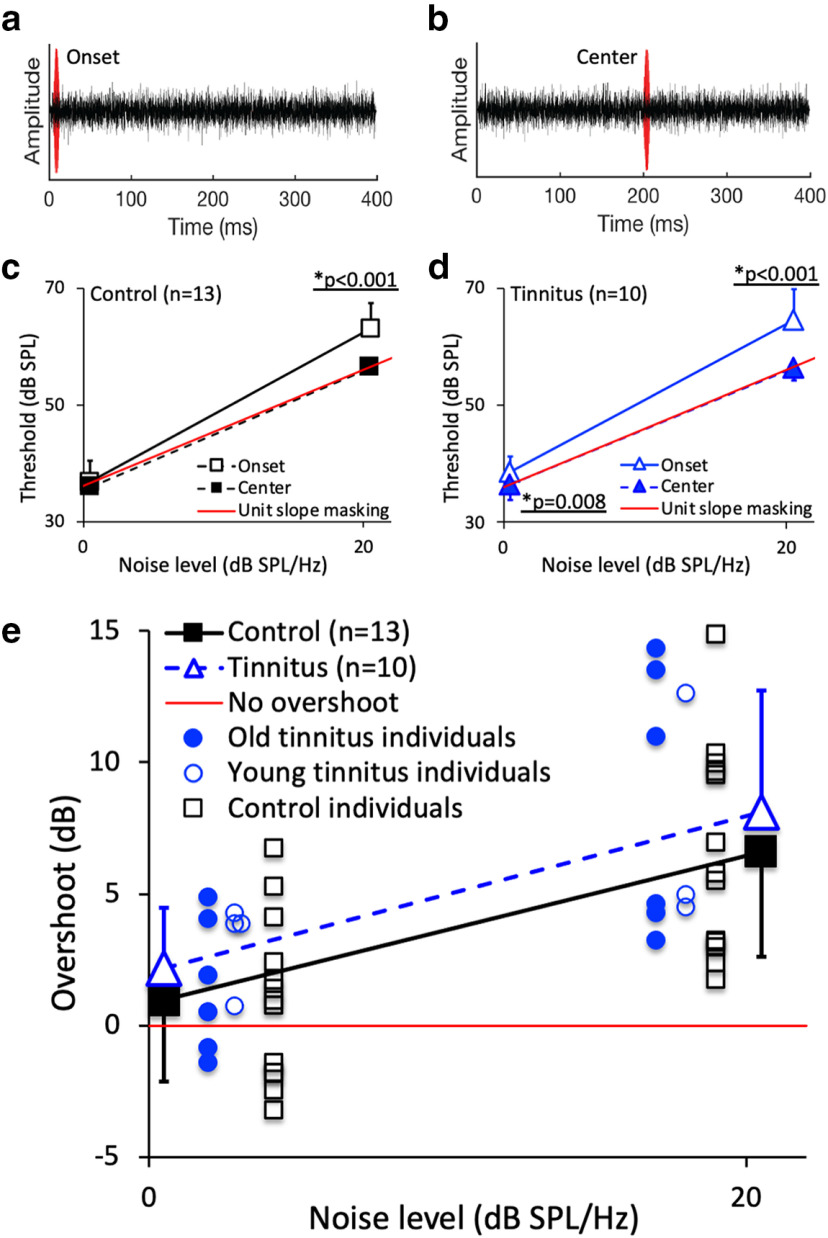
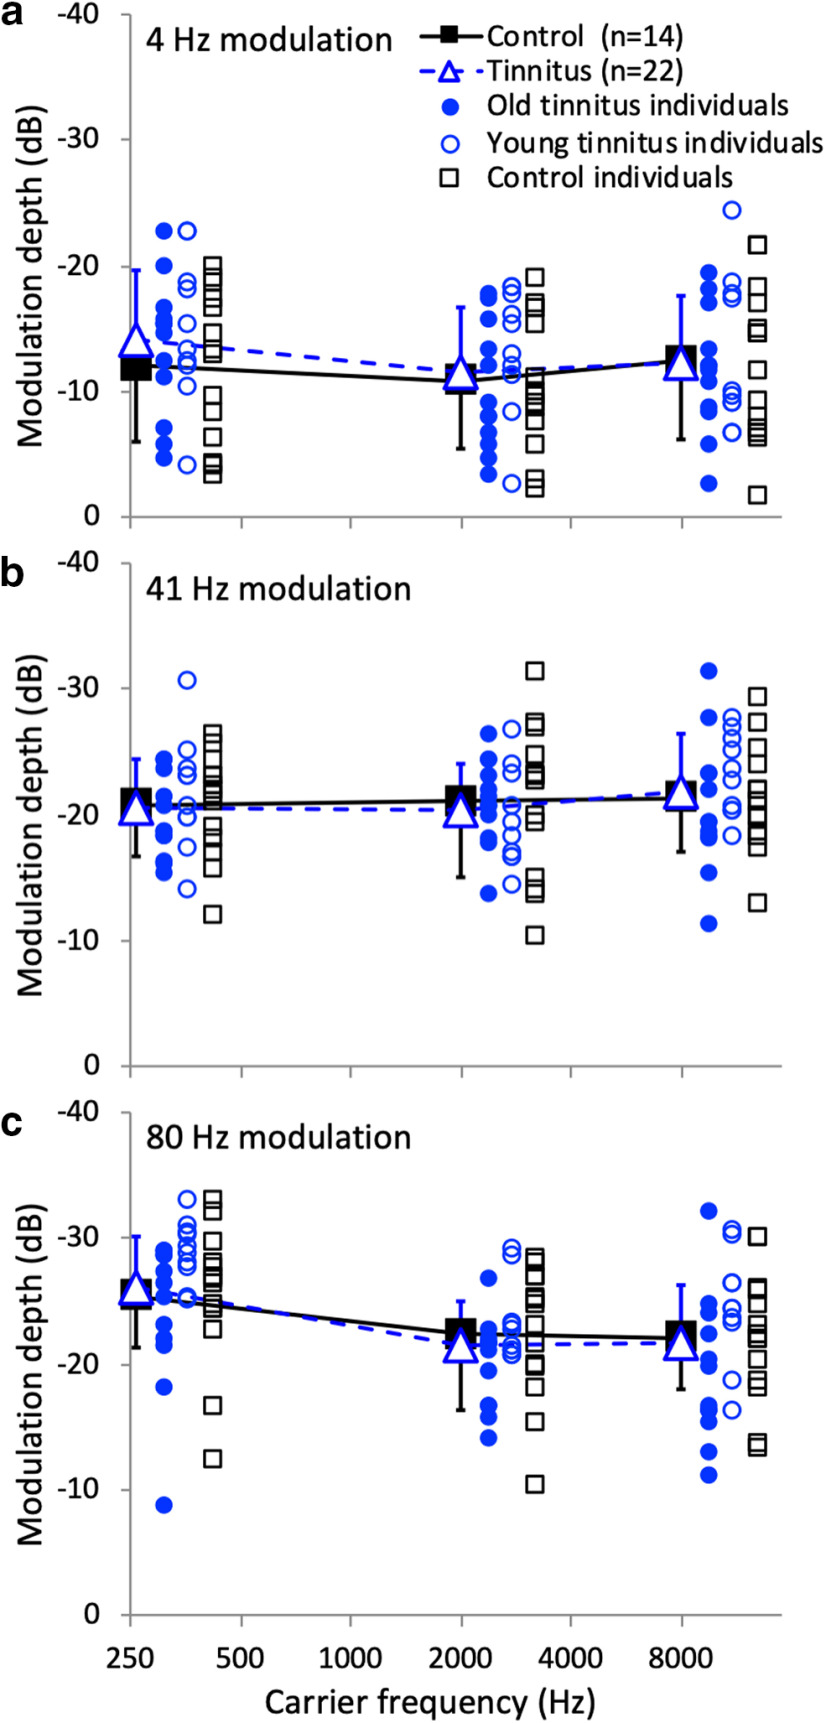
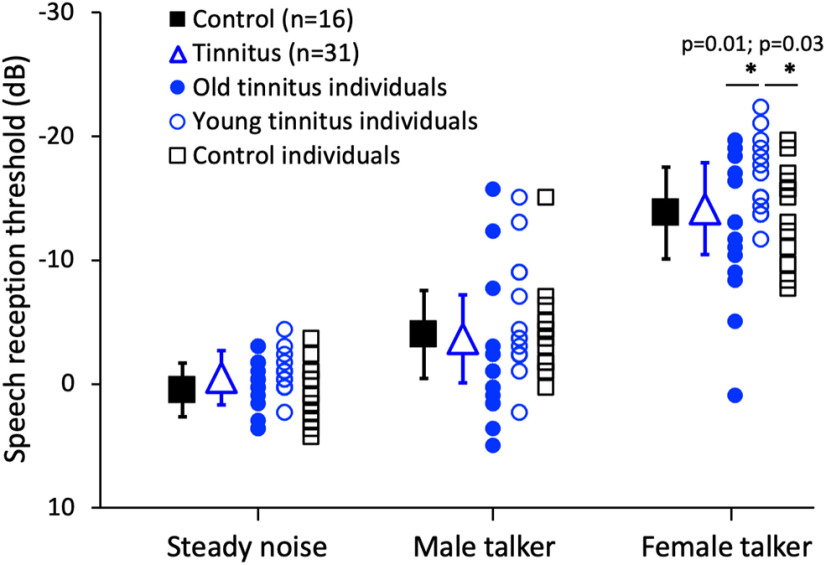
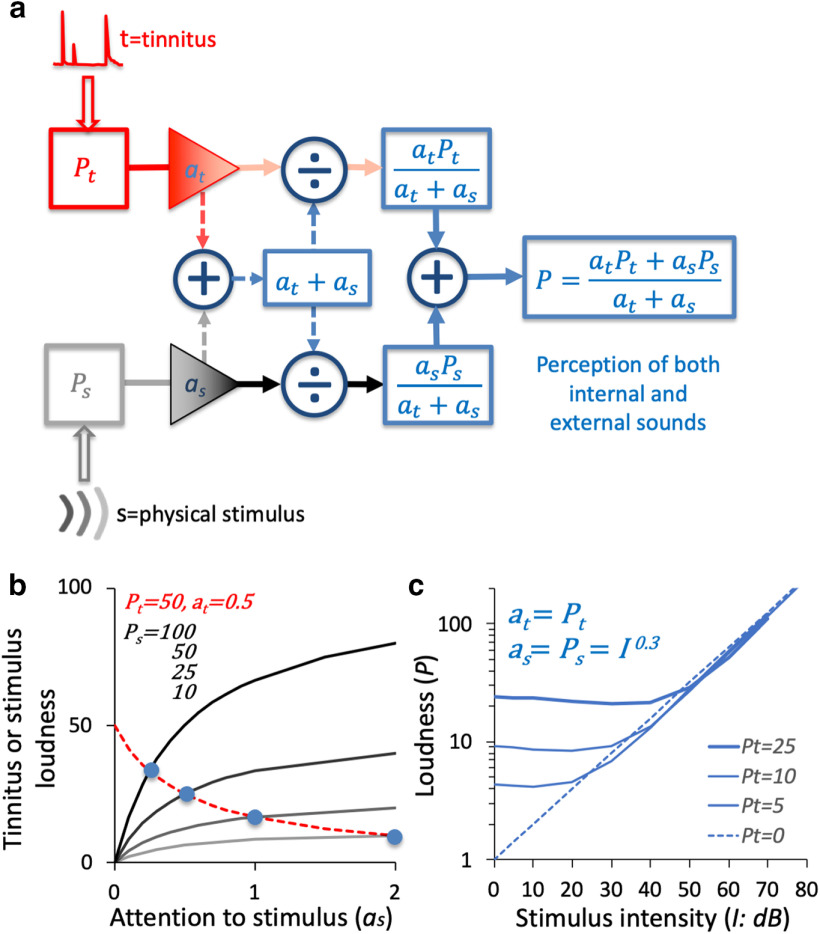
Tinnitus is a sound heard by 15% of the general population in the absence of any external sound. Because external sounds can sometimes mask tinnitus, tinnitus is assumed to affect the perception of external sounds, leading to hypotheses such as "tinnitus filling in the temporal gap" in animal models and "tinnitus inducing hearing difficulty" in human subjects. Here we compared performance in temporal, spectral, intensive, masking and speech-in-noise perception tasks between 45 human listeners with chronic tinnitus (18 females and 27 males with a range of ages and degrees of hearing loss) and 27 young, normal-hearing listeners without tinnitus (11 females and 16 males). After controlling for age, hearing loss, and stimulus variables, we discovered that, contradictory to the widely held assumption, tinnitus does not interfere with the perception of external sounds in 32 of the 36 measures. We interpret the present result to reflect a bottom-up pathway for the external sound and a separate top-down pathway for tinnitus. We propose that these two perceptual pathways can be independently modulated by attention, which leads to the asymmetrical interaction between external and internal sounds, and several other puzzling tinnitus phenomena such as discrepancy in loudness between tinnitus rating and matching. The present results suggest not only a need for new theories involving attention and central noise in animal tinnitus models but also a shift in focus from treating tinnitus to managing its comorbid conditions when addressing complaints about hearing difficulty in individuals with tinnitus.SIGNIFICANCE STATEMENT Tinnitus, or ringing in the ears, is a neurologic disorder that affects 15% of the general population. Here we discovered an asymmetrical relationship between tinnitus and external sounds: although external sounds have been widely used to cover up tinnitus, tinnitus does not impair, and sometimes even improves, the perception of external sounds. This counterintuitive discovery contradicts the general belief held by scientists, clinicians, and even individuals with tinnitus themselves, who often report hearing difficulty, especially in noise. We attribute the counterintuitive discovery to two independent pathways: the bottom-up perception of external sounds and the top-down perception of tinnitus. Clinically, the present work suggests a shift in focus from treating tinnitus itself to treating its comorbid conditions and secondary effects.

Keywords: animal model; attention; auditory perception; neural noise; speech recognition; tinnitus.


Figures

Figure 1.
Figure 1.
a, Pure-tone audiograms showing hearing thresholds as a function of test-tone frequency for 27 young, normal-hearing control subjects (solid black squares), 21 young tinnitus subjects (open red circles), and 24 old tinnitus subjects (solid red circles). Error bars show ±1 SD of the mean. b, Tinnitus matching levels (y-axis) and frequencies (x-axis) for 19 tinnitus subjects who participated in gap detection, frequency, and intensity discrimination experiments. The mean tinnitus matching level and frequency are represented by the large solid circle with error bars (±1 SD). The 19 subjects included 9 old subjects (small solid red circles) and 10 young subjects (small open red circles). There was no significant difference in tinnitus level between the old and young subjects (11.4 ± 5.4 vs 9.1 ± 8.4 dB SL; two-tailed, two-sample t test, p = 0.46).
Figure 2.
Figure 2.
Gap detection experimental design and data. a, Use of an amplitude cue for gap detection by presenting the gap stimuli at a comfortable loudness level (black), which is usually higher than the tinnitus loudness level (red). b, Use of a frequency cue for gap detection by using a pure tone, which has a lower frequency (black) than the tinnitus pitch (red). c, The present study minimized the amplitude and frequency cues by presenting the gap stimuli at the tinnitus-matched loudness level and pitch. d, Average gap detection threshold for pure-tone stimuli at 500, 2000, and 8000 Hz for 10 control subjects (solid black squares) and 11 tinnitus subjects (open blue triangles). Average gap detection threshold for tinnitus-matched stimuli (the large solid red circle with error bars) was the geometric mean for 11 tinnitus subjects, including 5 young subjects (small open red circles) and 6 old subjects (small solid red circles). There was no significant difference in gap detection at tinnitus-matched frequencies between the young and old tinnitus subjects (17 vs 15 ms; two-tailed, two-sample t test, p = 0.60). Four subjects matched their tinnitus pitches to two different frequencies, producing a total of 15 data points. Error bars show ±1 SD of the mean.
Figure 3.
Figure 3.
Frequency discrimination. a, The Weber's fraction as a function of frequency at 30 dB SL for 10 control subjects (solid black squares) and 17 tinnitus subjects (open blue triangles). Error bars show ±1 SD of the mean. The average threshold for tinnitus-matched stimuli (the large solid red circle with error bars) was the arithmetic mean for 14 tinnitus subjects, including 9 young (small open red circles) and 5 old (small solid red circles). b, The same as a, except at 70 dB SL. The asterisk and the line below represent a significant difference between the groups. There was no significant difference in frequency discrimination between the young and old tinnitus subjects at the matched frequencies (0.021 vs 0.027; two-tailed, two-sample t test, p = 0.45).
Figure 4.
Figure 4.
Intensity discrimination. a, Intensity discrimination threshold as a function of frequency at 30 dB SL for 10 control subjects (solid black squares) and 16 tinnitus subjects (open blue triangles). Error bars show ±1 SD of the mean. The average threshold for tinnitus-matched stimuli (the solid red circle with error bars) was the arithmetic mean from 14 tinnitus subjects, including 9 young (small open red circles) and 5 old (small solid red circles). The asterisk and the line below represent a significant difference between the groups. b, The same as a except at 70 dB SL. There was no significant difference in intensity discrimination at tinnitus-matched frequencies between the young and old tinnitus subjects at either 30 dB SL (p = 0.10) or 70 dB SL (two-tailed, two-sample t test, p = 0.61).
Figure 5.
Figure 5.
Temporal masking and overshoot. a, Onset masking condition: detection of a 10 ms, 2000 Hz tone (red waveform) positioned at the onset of 400 ms broadband (100–10 000 Hz) white noise (black waveform). b, Center-masking condition: detection of the same signal positioned at the temporal center of the 400 ms noise. c, Masking growth functions for 13 control subjects. Detection threshold as a function of the noise level for the onset (open squares) and center (solid squares). The solid red line represents a slope of 1. The asterisk and the line below represent a significant difference between the groups at the 20 dB noise level. d, Masking growth functions for 10 tinnitus subjects. The symbols have the same meanings as those in c, except for the blue colors and triangles. The asterisk and the line below represent a significant difference between the groups at the 0 and 20 dB noise levels. e, Overshoot functions for the average tinnitus subjects (open blue triangles) and control subjects (solid black squares). Individual overshoot data include six old tinnitus subjects (solid blue circles), five young tinnitus subjects (open blue circles), and 13 control subjects (open black squares). The solid red line represents no overshoot, namely no difference in tone detection threshold between the onset and center conditions. Error bars show ±1 SD of the mean. There was no significant difference in overshoot between the old and young tinnitus subjects (solid vs open circles in e; p = 0.29 for 0 dB noise and p = 0.75 for 20 dB noise).
Figure 6.
Figure 6.
Temporal modulation detection. a, Detection threshold of 4 Hz sinusoidal amplitude modulation as a function of carrier frequency (250, 2000, and 8000 Hz). The open blue triangles show the average threshold for 22 tinnitus subjects, and the solid black squares show the average threshold for 14 control subjects. The solid blue circles represent individual data for the 12 old tinnitus subjects, open blue circles for the 10 young tinnitus subjects, and black open squares for the 14 control subjects. Error bars show ±1 SD of the mean. b, The same as a, except for detecting 41 Hz modulation. c, The same as a except for detecting 80 Hz modulation.
Figure 7.
Figure 7.
SRTs for three backgrounds. The solid black squares represent the average SRTs for 16 control subjects, and the open blue triangles represent the average SRTs for 31 tinnitus subjects. Individual data are shown by blue solid circles for 18 old tinnitus subjects, blue open circles for 13 young tinnitus subjects, and black open squares for 16 control subjects. Error bars show ±1 SD of the mean. The asterisk and the line below represent significant differences between the groups for the female talk background.
Figure 8.
Figure 8.
Tinnitus attention-normalization model and predictions. a, Tinnitus (t) is of an internal origin and goes through a top-down pathway to produce a tinnitus percept Pt. A physical stimulus (s) is of an external origin and goes through an independent bottom-up pathway to produce a stimulus percept Ps. Both percepts are modulated by attention (at = attention to tinnitus; as = attention to stimulus) to produce a total percept P, which is the sum of the attention-weighted individual percepts (asPt + atPs) over the total attention level (as + at). b, Prediction of the role of attention in perception of tinnitus and stimulus. For a tinnitus baseline loudness at 50 and tinnitus attention level at 0.5, tinnitus loudness (Pt = red dashed line) decreases with increased attention to stimulus (x-axis). For four stimulus loudness baseline levels (100, 50, 25, and 10 represented by the four black lines from top to bottom, respectively), stimulus loudness (Ps) increases with attention to stimulus. The intersections between the tinnitus curve and the four stimulus curves (blue circles) indicate equal loudness between tinnitus and stimulus. c, Prediction of the effect of tinnitus on loudness growth for an external stimulus. The total loudness (P) grows as a function of stimulus intensity (represented as 10logI or dB here) for three tinnitus loudness baseline levels (Pt = 25, 10, and 5 as three solid blue lines, respectively). The loudness growth function without tinnitus (Pt = 0) is shown by the dotted blue diagonal line.

Comment in

Similar articles

Cited by

References

    1. An YH, Jin SY, Yoon SW, Shim HJ (2014) The effects of unilateral tinnitus on auditory temporal resolution: gaps-in-noise performance. Korean J Audiol 18:119–125. 10.7874/kja.2014.18.3.119 - DOI - PMC - PubMed
    1. Andersson G, Eriksson J, Lundh LG, Lyttkens L (2000) Tinnitus and cognitive interference: a stroop paradigm study. J Speech Lang Hear Res 43:1168–1173. 10.1044/jslhr.4305.1168 - DOI - PubMed
    1. Araneda R, De Volder AG, Deggouj N, Philippot P, Heeren A, Lacroix E, Decat M, Rombaux P, Renier L (2015) Altered top-down cognitive control and auditory processing in tinnitus: evidences from auditory and visual spatial stroop. Restor Neurol Neurosci 33:67–80. 10.3233/RNN-140433 - DOI - PubMed
    1. Axelsson A, Ringdahl A (1989) Tinnitus–a study of its prevalence and characteristics. Br J Audiol 23:53–62. 10.3109/03005368909077819 - DOI - PubMed
    1. Bacon SP, Takahashi GA (1992) Overshoot in normal-hearing and hearing-impaired subjects. J Acoust Soc Am 91:2865–2871. 10.1121/1.402967 - DOI - PubMed

Publication types