. 2020 Sep;19(9):1450-1467.
doi: 10.1074/mcp.RA120.002069. Epub 2020 Jun 18.

The Insulin Receptor Adaptor IRS2 is an APC/C Substrate That Promotes Cell Cycle Protein Expression and a Robust Spindle Assembly Checkpoint

Affiliations

The Insulin Receptor Adaptor IRS2 is an APC/C Substrate That Promotes Cell Cycle Protein Expression and a Robust Spindle Assembly Checkpoint

Sandhya Manohar et al. Mol Cell Proteomics. 2020 Sep.

Abstract

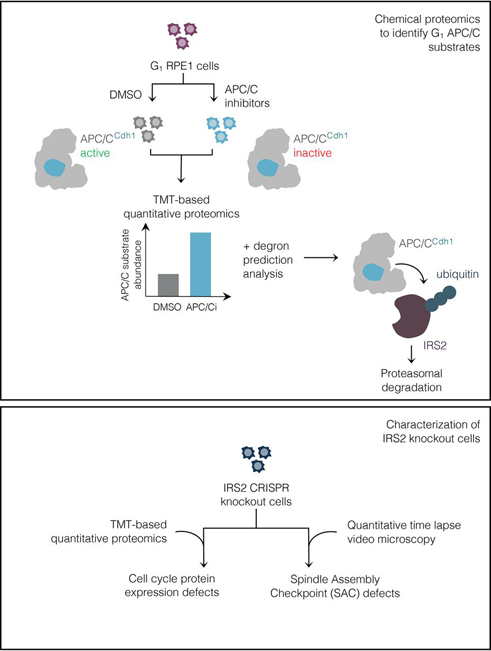
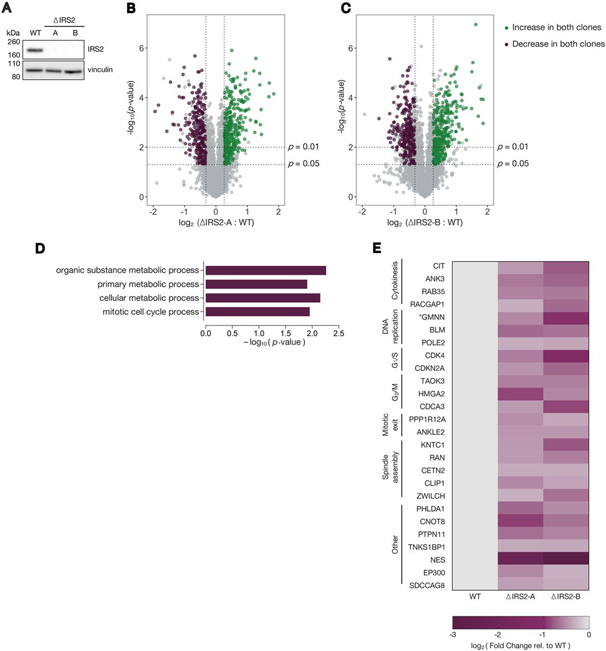
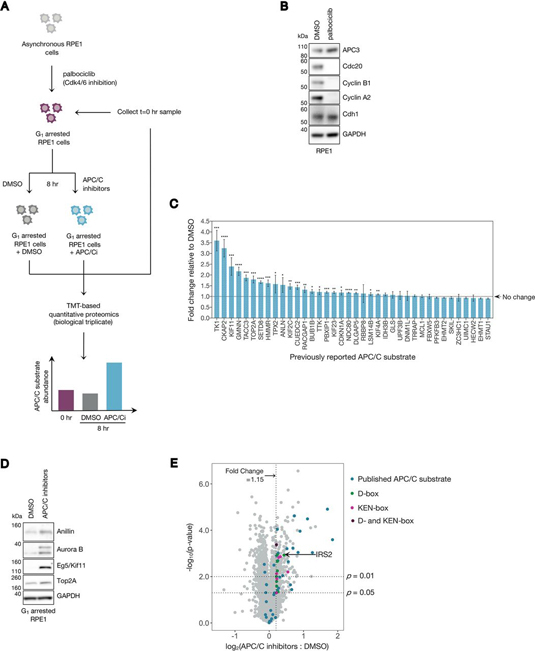
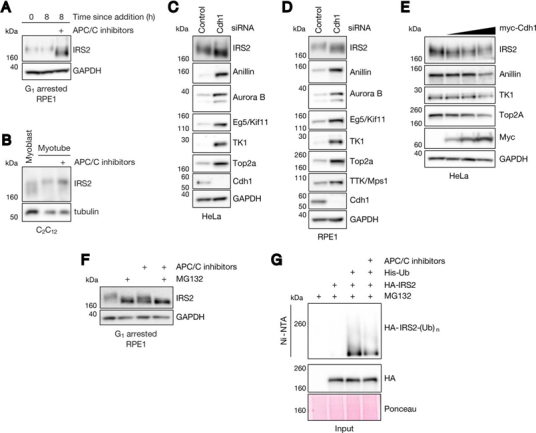
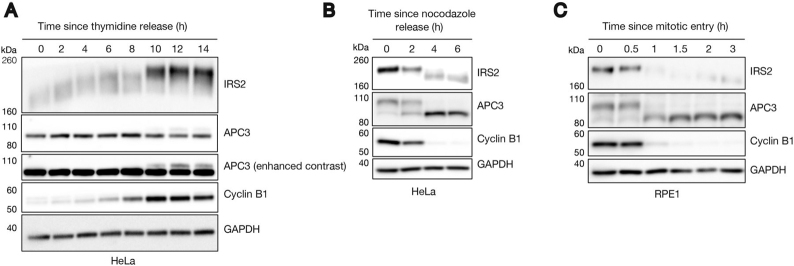
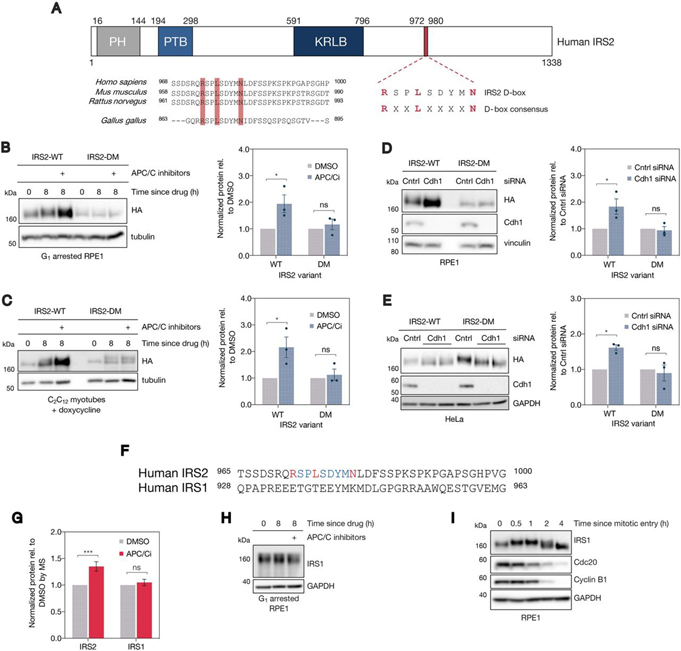
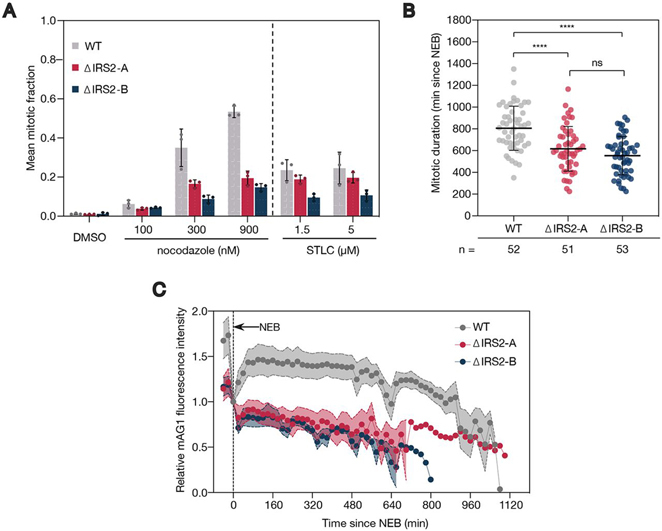
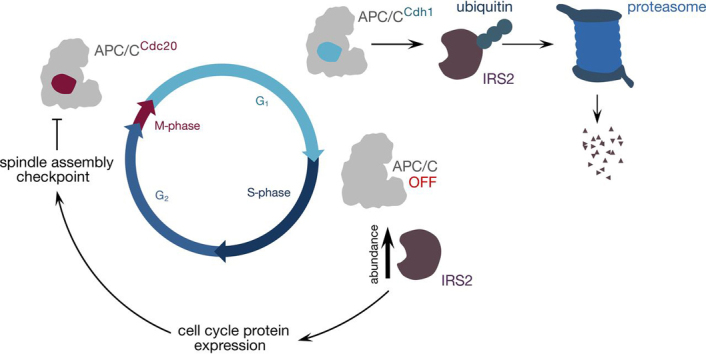
Insulin receptor substrate 2 (IRS2) is an essential adaptor that mediates signaling downstream of the insulin receptor and other receptor tyrosine kinases. Transduction through IRS2-dependent pathways is important for coordinating metabolic homeostasis, and dysregulation of IRS2 causes systemic insulin signaling defects. Despite the importance of maintaining proper IRS2 abundance, little is known about what factors mediate its protein stability. We conducted an unbiased proteomic screen to uncover novel substrates of the Anaphase Promoting Complex/Cyclosome (APC/C), a ubiquitin ligase that controls the abundance of key cell cycle regulators. We found that IRS2 levels are regulated by APC/C activity and that IRS2 is a direct APC/C target in G1 Consistent with the APC/C's role in degrading cell cycle regulators, quantitative proteomic analysis of IRS2-null cells revealed a deficiency in proteins involved in cell cycle progression. We further show that cells lacking IRS2 display a weakened spindle assembly checkpoint in cells treated with microtubule inhibitors. Together, these findings reveal a new pathway for IRS2 turnover and indicate that IRS2 is a component of the cell cycle control system in addition to acting as an essential metabolic regulator.

Keywords: Anaphase-promoting complex/cyclosome; G1; anaphase promoting complex (APC/C); cell cycle; cell division; enzyme inhibition; insulin signaling pathway; mitosis; ubiquitin.


Conflict of interest statement

Conflict of interest:—Authors declare no competing interests.

Figures

None
Graphical abstract
Fig. 5
Fig. 5
IRS2 knockout cell lines are defective in mitotic cell cycle-related protein expression.A, WT, ΔIRS2-A, and ΔIRS2-B cell line lysates were analyzed for IRS2 expression by immunoblotting. B–C, Volcano plots comparing proteomes of ΔIRS2 cell lines with WT cell line. Proteins that significantly decrease > 20% (p-value < 0.05) in both cell lines compared with WT are shown in purple; proteins that significantly increase > 20% (p-value < 0.05) in both cell lines compared with WT are shown in green. D, Gene ontology (GO) term enrichment of proteins that decrease in both ΔIRS2 cell lines relative to WT cells. E, Heat map depicting cell cycle-related protein abundance changes between ΔIRS2 cell lines and WT cells. * : we could not distinguish whether the peptides from GMNN were from the endogenous protein or the mAG1-geminin (1-110) reporter.
Fig. 1
Fig. 1
High resolution chemical proteomics reveals proteins whose abundances are APC/C regulated.A, Workflow for the chemical proteomics experiment described in this study. Asynchronous RPE1 cells were arrested in 1 μm palbociclib (a Cdk4/6 inhibitor) for 20 h, at which point they were acutely treated with either DMSO or a combination of 6 μm proTAME + 50 μm apcin (referred to as “APC/C inhibitors” or “APC/Ci”), in the ongoing presence of palbociclib. Cells were then collected at time 0 (the time of APC/C inhibitor addition) or 8 h after drug addition and were harvested for TMT-based proteomic identification and quantification. Samples were analyzed in biological triplicate within a 10-plex TMT label set, with the 10th channel used as a bridge. B, Asynchronous RPE1 cells were treated with either DMSO or 1 μm palbociclib for 20 h. Cells were harvested, and lysates were analyzed by immunoblot for the indicated proteins. C, Previously reported APC/C substrates that were identified in this study are plotted with their observed fold change in the APC/C inhibitor treated sample (APC/Ci) relative to the DMSO treated sample. Error bars represent the standard deviation (S.D.) between the three biological replicates measured by MS. Asterisks indicate an abundance increase over control that is statistically significant (*: p < 0.05; **: p < 0.01; ***: p < 0.001; ****: p < 0.0001) D, Previously reported APC/C substrates that were identified as increasing by MS in G1 RPE1 cells treated with APC/C inhibitors were validated by immunoblot for selected proteins. E, Volcano plot highlighting all published APC/C substrates identified in this study (blue) as well as proteins that (1) contain a high probability D- and/or KEN-box (d-box = green, KEN-box = pink, D- and KEN-boxes = purple), (2) increase ≥1.15-fold under APC inhibition, (3) were identified by >1 peptide, and (4) have a p-value < 0.05.
Fig. 2
Fig. 2
IRS2 levels are controlled by Cdh1 in a proteasome-dependent manner.A, Cells were treated identically to what is described in Fig. 1A, and IRS2 abundance was measured by immunoblot. B, C2C12 myoblasts were induced to differentiate through serum withdrawal and supplementation with insulin, transferrin, and selenium (ITS). After 3 days of differentiation, myotubes were acutely treated with either DMSO or APC/C inhibitors. After eight hours of drug treatment, myotubes were collected and IRS2 levels from all samples were analyzed by immunoblotting. CD, Asynchronous HeLa (C) and RPE1 (D) cells were transfected with either a control or Cdh1-directed siRNA for 24 h. Cells were allowed to grow for an additional 24 h before collection and analysis of the indicated protein levels in lysate by immunoblot. E, HeLa cells were mock transfected or transfected with increasing amounts of a plasmid encoding myc-tagged human Cdh1 for 24 h. Cells could grow for an additional 24 h before collection and analysis of the indicated protein levels by immunoblot. F, RPE1 cells were arrested in G1 with 1 μm palbociclib for 20 h. Following G1 arrest, cells were treated with DMSO, APC/C inhibitors, MG132, or a combination of APC/C inhibitors and MG132 for an additional 8 h. Cells were harvested, and lysates were analyzed by immunoblot for IRS2 abundance. G, 6xHis-tagged ubiquitin conjugates were isolated from HeLa cell lysates using Ni-NTA agarose resin. Lysates were derived from cells expressing 6xHis-ubiquitin and HA-tagged IRS2 that were treated with MG132 alone or in combination with APC/C inhibitors. Resin eluate and inputs were probed by immunoblot using an HA antibody, and Ponceau staining was used as a loading control.
Fig. 3
Fig. 3
IRS2 levels and phosphorylation fluctuate in a cell-cycle dependent manner.A, HeLa cells were synchronized by double thymidine block and released into S-phase in the presence of nocodazole. Lysates were harvested and analyzed by immunoblotting for IRS2 and cell cycle markers. B, HeLa cells were synchronized by single thymidine-nocodazole block and released into prometaphase. Mitotic cells were collected by mitotic shake-off and re-plated. Time points were taken every two hours as cells exited M-phase. Lysates were harvested and analyzed by immunoblotting for IRS2 and cell cycle markers. C, RPE1 cells were synchronized in G2 by treatment with the Cdk1 inhibitor RO3306. After 18 h, cells were switched to fresh media and were allowed to enter mitosis (∼35 min following drug removal). At mitotic entry, cells were collected by mitotic shake-off and were re-plated (0 h). Time points were taken as cells exited M-phase and entered G1. Lysates were harvested and analyzed by immunoblotting for IRS2 and cell cycle markers.
Fig. 4
Fig. 4
Cdh1's ability to control IRS2 levels depends on a C-terminal d-box motif.A, (top) Schematic depicting IRS2's protein domain structure. PH = pleckstrin homology domain, PTB = phosphotyrosine binding domain, KRLB = kinase regulatory-loop binding region. IRS2's C-terminal full d-box motif is highlighted in red. (bottom) Comparison of IRS2's D-box conservation among amniotes. B, RPE1 cells stably expressing lentivirus-derived, doxycycline-inducible, C-terminally HA-tagged IRS2 constructs were arrested in G1 with palbociclib for 20 h. Following arrest, samples were either collected or DMSO or APC/C inhibitors were added for an additional 8 h. Quantification of immunoblots shown at right: HA levels were normalized to a loading control and are plotted relative to DMSO levels. Error bars = mean ± S.E. *: p = 0.0187; ns: p = 0.816. C, C2C12 myoblasts stably expressing lentivirus-derived, doxycycline-inducible, C-terminally HA-tagged IRS2 constructs were grown to confluence and switched to low serum media supplemented with ITS (differentiation media) and doxycycline. Cells were allowed to differentiate into myotubes for 3 days (with media refreshment every 24 h), at which point (0 h) either DMSO or APC/C inhibitors for an additional 8 h in the presence of doxycycline. Quantification of immunoblots shown at right: HA levels were normalized to a loading control and are plotted relative to DMSO levels. Error bars = mean ± S.E. *: p = 0.0118; ns: p = 0.910. D, Asynchronous RPE1 cells stably expressing lentivirus-derived, doxycycline-inducible C-terminally HA-tagged IRS2 constructs were transfected with a nontargeting (control) siRNA or an siRNA directed against Cdh1 for 24 h in the absence of doxycycline. Quantification of immunoblots shown at right: HA levels were normalized to a loading control and are plotted relative to DMSO levels. Error bars = mean ± S.E. *: p = 0.0132; ns: p = 0.963. E, Asynchronous HeLa cells stably expressing lentivirus-derived, N-terminally FLAG-HA tagged IRS2 constructs were transfected with a nontargeting (control) siRNA or an siRNA directed against Cdh1 for 24 h. Quantification of immunoblots shown at right: HA levels were normalized to a loading control and are plotted relative to DMSO levels. Error bars = mean ± S.E. *: p = 0.0131; ns: p = 0.803. F, Comparison of the Hs IRS2 D-box sequence with the corresponding region from Hs IRS1. G, MS-quantified IRS1 and IRS2 abundance in G1 APC inhibitor proteomics (Fig. 1). IRS1 abundance was quantified based on 5 peptides (4 unique) in 3 biological replicates; IRS2 was quantified based on 3 peptides (all unique) in 3 biological replicates. H, RPE1 cells were subject to the same conditions described in Fig. 1A, and cell lysates were analyzed by immunoblotting for IRS1 abundance I, RPE1 cells were treated as in Fig. 3C. Cell lysates were analyzed by immunoblotting for IRS1 abundance.
Fig. 6
Fig. 6
IRS2 expression promotes a functional spindle assembly checkpoint.A, Analysis of fraction of cells in mitosis for RPE1 WT and IRS2 knockout cell lines treated with the indicated doses of nocodazole and S-trityl-l-cysteine (STLC) for 18 h. Mitotic fraction measurements were made using a high content fixed cell imaging assay based on DAPI intensity of stained nuclei. Error bars = mean ± S.D. B, Asynchronous RPE1 WT or IRS2 knockout cell lines were treated with 300 nm nocodazole and imaged every 5 mins by widefield time lapse microscopy for 36 h. Each point represents an individual cell's mitotic duration, measured as the time from nuclear envelope breakdown (NEB) to division, slippage, or cell death. Error bars = mean± S.D. p-values were calculated by one-way ANOVA. **** = p < 0.0001. ns = not statistically significant. C, Asynchronous RPE1 WT or IRS2 knockout cell lines expressing mAG1-geminin(1-110) were treated as in (C). mAG1 fluorescence intensity was measured from nuclear envelope breakdown (NEB) until division, slippage, or cell death (n = 10 for all three cell lines). Error bars = mean ± S.E. Fluorescence intensity was background subtracted and normalized to intensity at NEB.
Fig. 7
Fig. 7
Model for IRS2's role in cell cycle control. IRS2 is targeted for proteasomal degradation by APC/CCdh1 during G1. When APC/C is inactivated at the G1/S boundary, IRS2 protein accumulates, allowing it to stimulate the expression of cell cycle-related proteins either through IR-mediated action (71) or through another receptor tyrosine kinase. Some of the proteins that are regulated through this pathway may be required for a robust spindle assembly checkpoint, which directly inhibits APC/CCdc20 during M-phase.

References

    1. Haeusler R.A., McGraw T.E., Accili D. Biochemical and cellular properties of insulin receptor signalling. Nat. Rev. Mol. Cell Biol. 2018;19:31–44. - PMC - PubMed
    1. Copps K.D., White M.F. Regulation of insulin sensitivity by serine/threonine phosphorylation of insulin receptor substrate proteins IRS1 and IRS2. Diabetologia. 2012;55:2565–2582. - PMC - PubMed
    1. Lavin D.P., White M.F., Brazil D.P. IRS proteins and diabetic complications. Diabetologia. 2016;59:2280–2291. - PMC - PubMed
    1. Bouzakri K., Zachrisson A., Al-Khalili L., Zhang B.B., Koistinen H.A., Krook A., Zierath J.R. siRNA-based gene silencing reveals specialized roles of IRS-1/Akt2 and IRS-2/Akt1 in glucose and lipid metabolism in human skeletal muscle. Cell Metab. 2006;4:89–96. - PubMed
    1. Long Y.C., Cheng Z., Copps K.D., White M.F. Insulin receptor substrates Irs1 and Irs2 coordinate skeletal muscle growth and metabolism via the Akt and AMPK pathways. Mol. Cell Biol. 2011;31:430–441. - PMC - PubMed

Publication types

MeSH terms