. 2020 Jul 24;17(4):046017.
doi: 10.1088/1741-2552/ab9db8.

Sources of off-target effects of vagus nerve stimulation using the helical clinical lead in domestic pigs

Affiliations

Sources of off-target effects of vagus nerve stimulation using the helical clinical lead in domestic pigs

Evan N Nicolai et al. J Neural Eng. .

Abstract

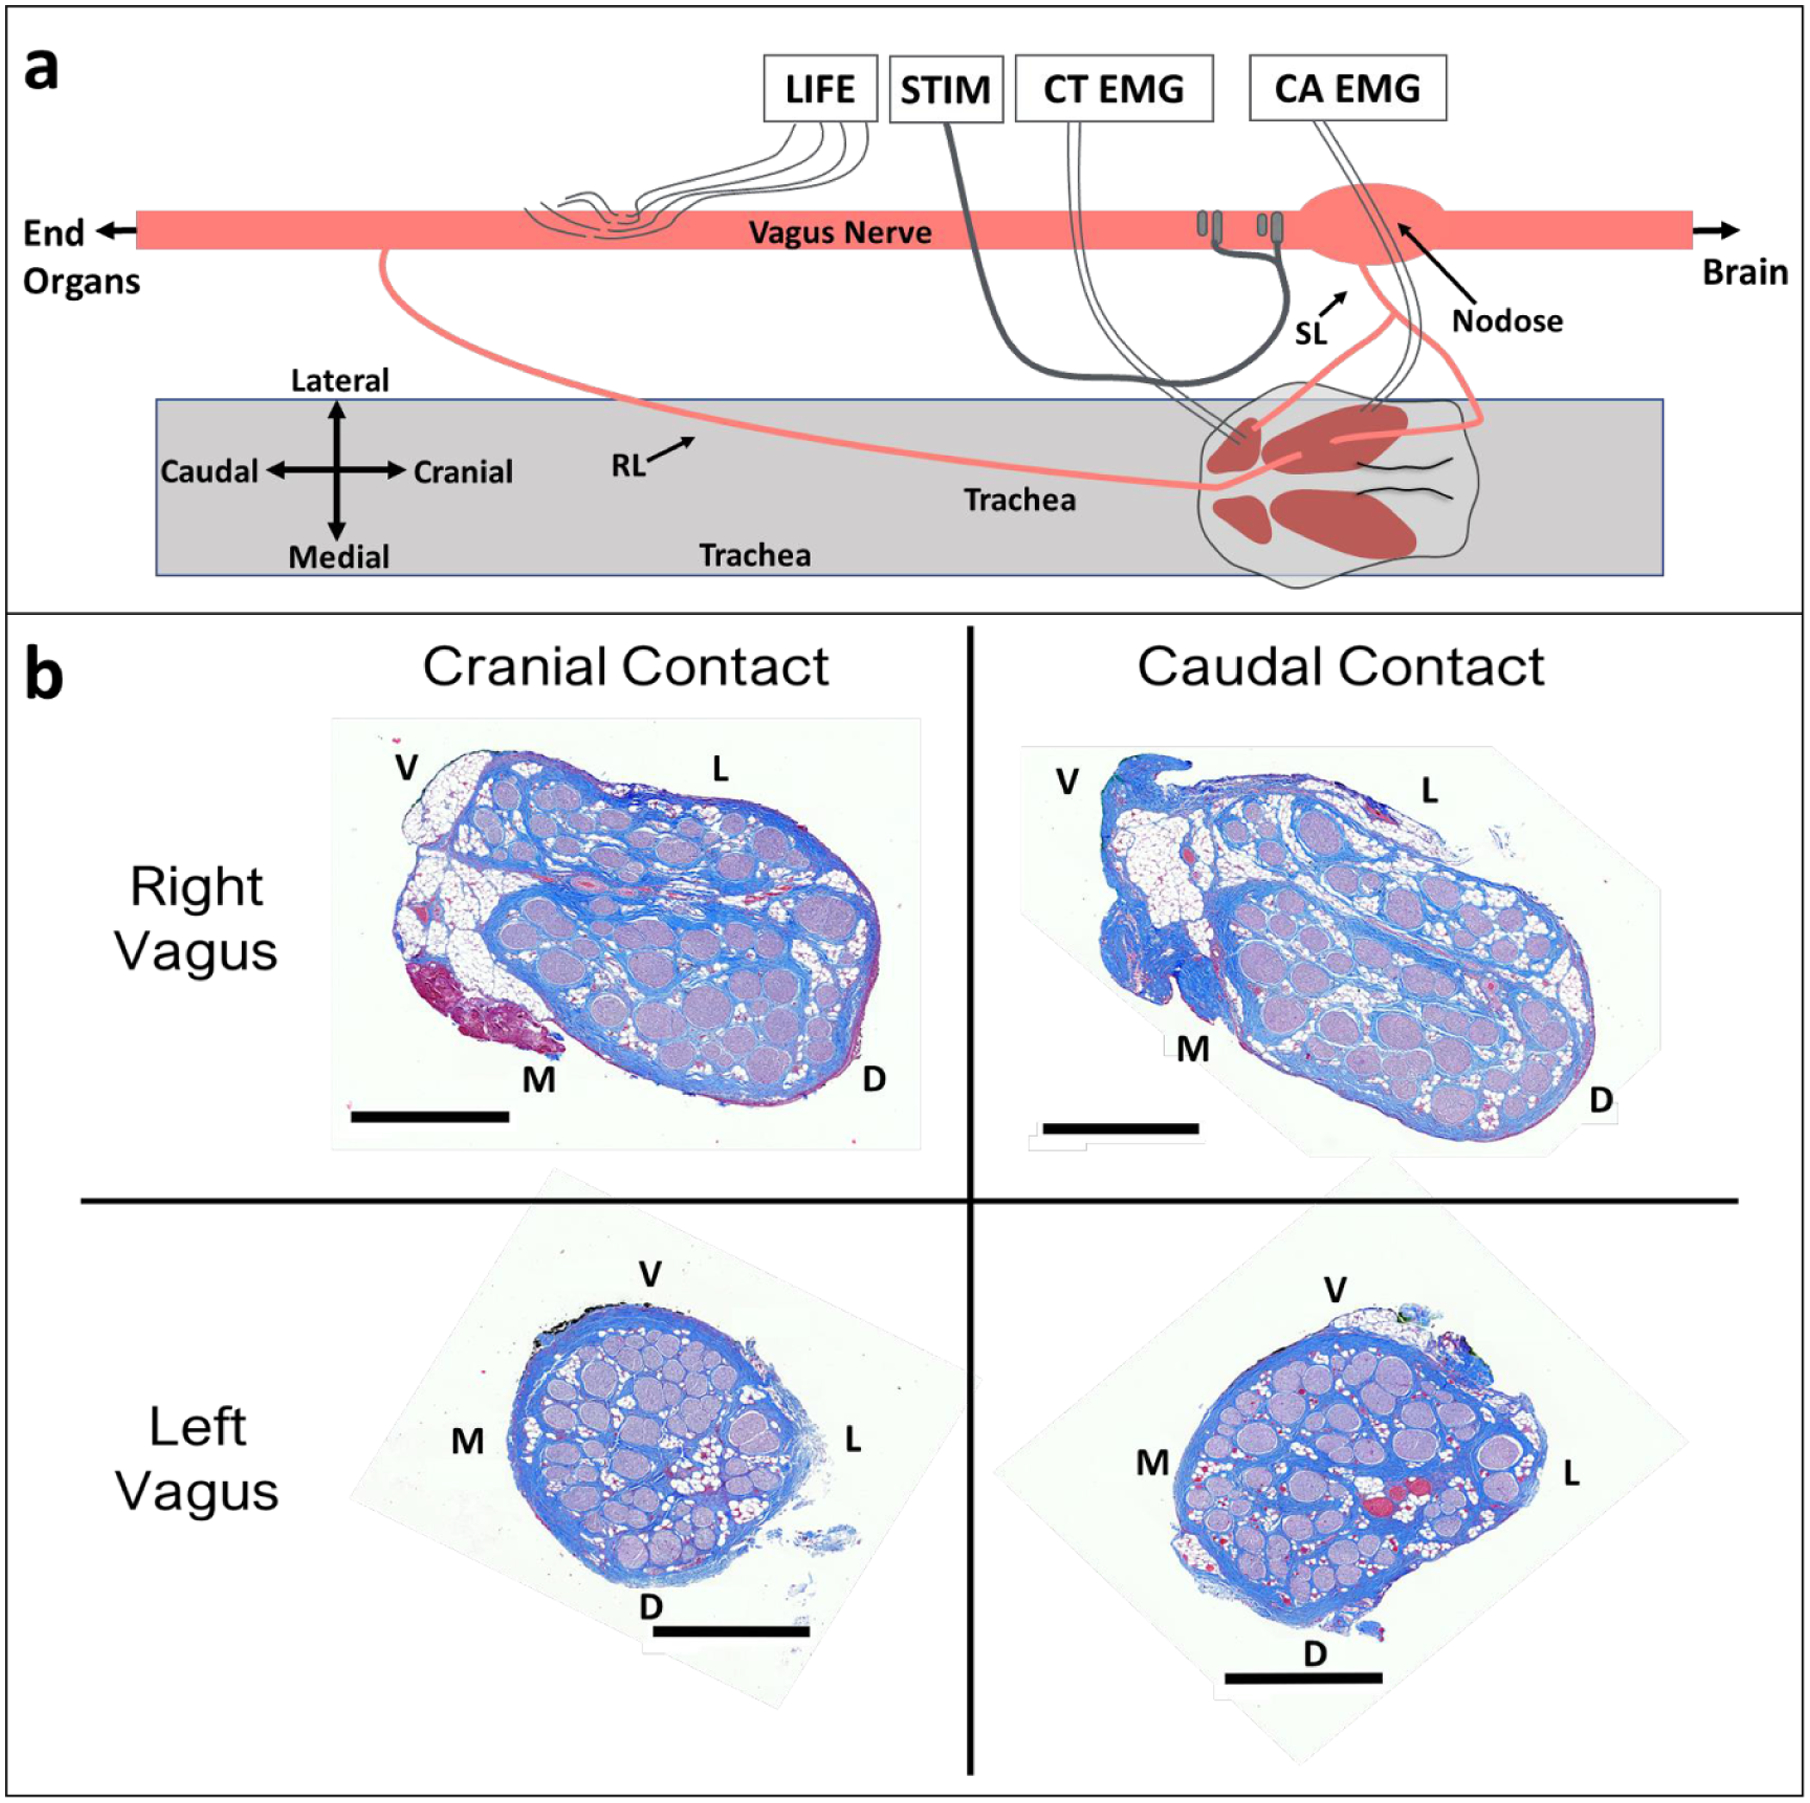
Objective: Clinical data suggest that efficacious vagus nerve stimulation (VNS) is limited by side effects such as cough and dyspnea that have stimulation thresholds lower than those for therapeutic outcomes. VNS side effects are putatively caused by activation of nearby muscles within the neck, via direct muscle activation or activation of nerve fibers innervating those muscles. Our goal was to determine the thresholds at which various VNS-evoked effects occur in the domestic pig—an animal model with vagus anatomy similar to human—using the bipolar helical lead deployed clinically.

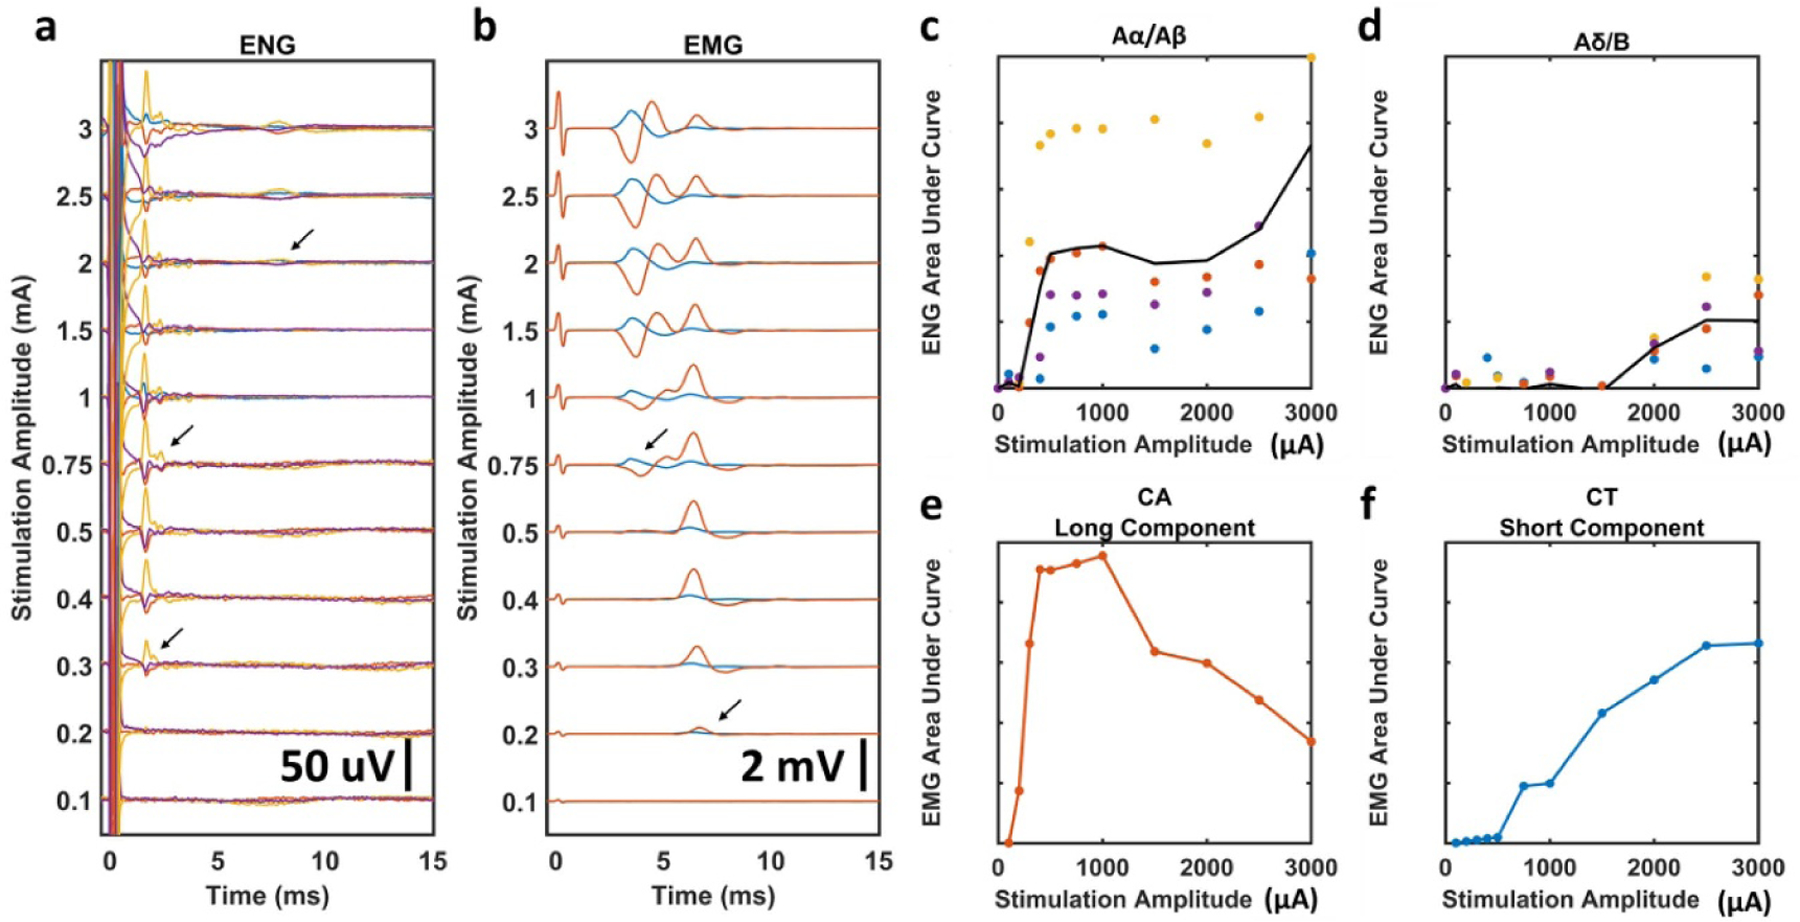
Approach: Intrafascicular electrodes were placed within the vagus nerve to record electroneurographic (ENG) responses, and needle electrodes were placed in the vagal-innervated neck muscles to record electromyographic (EMG) responses.

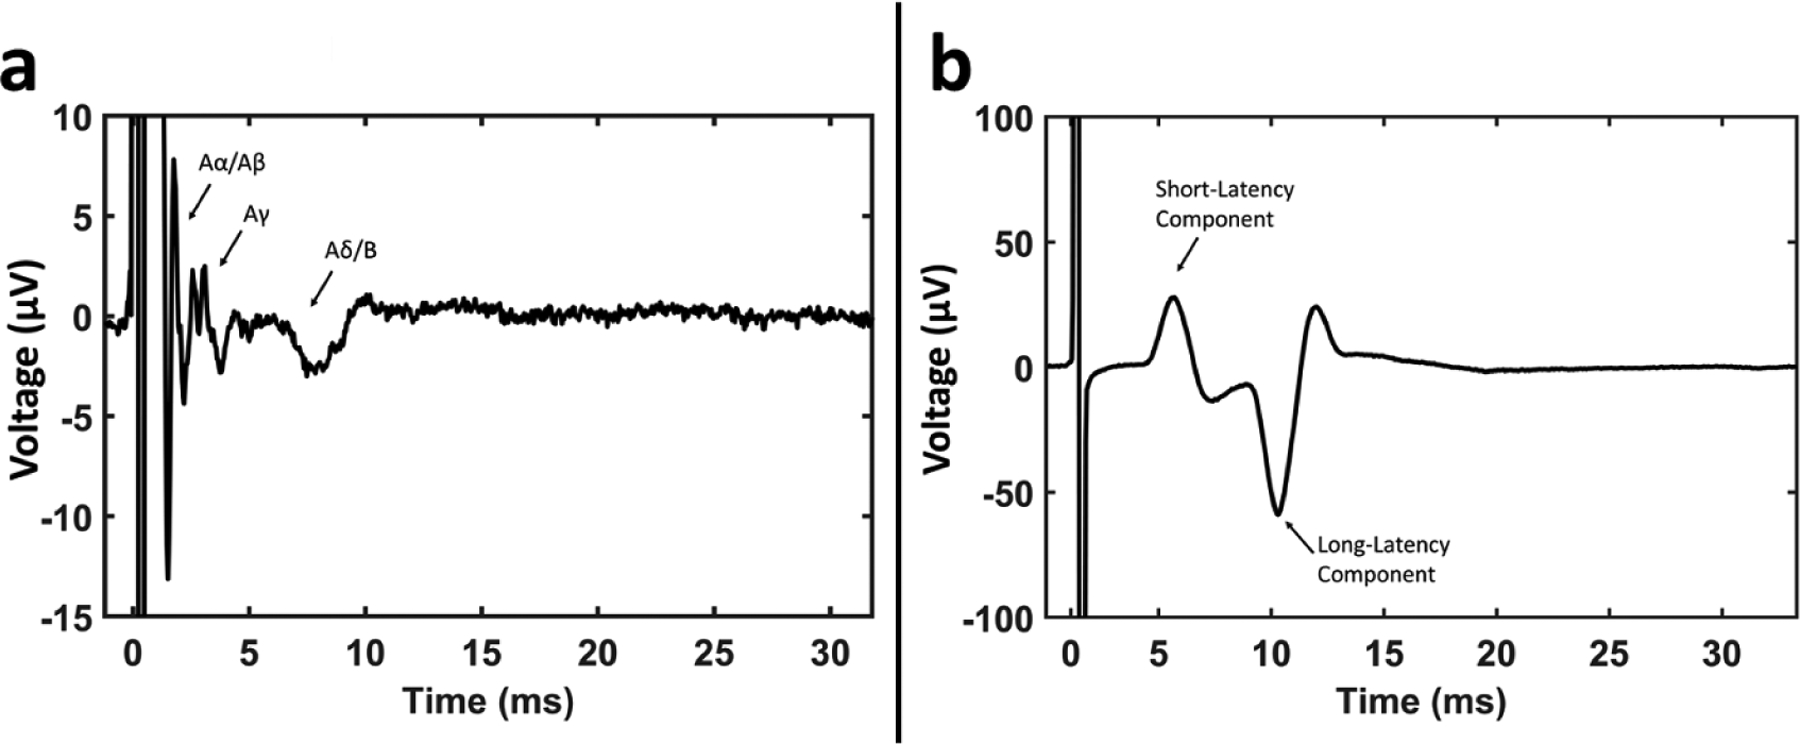
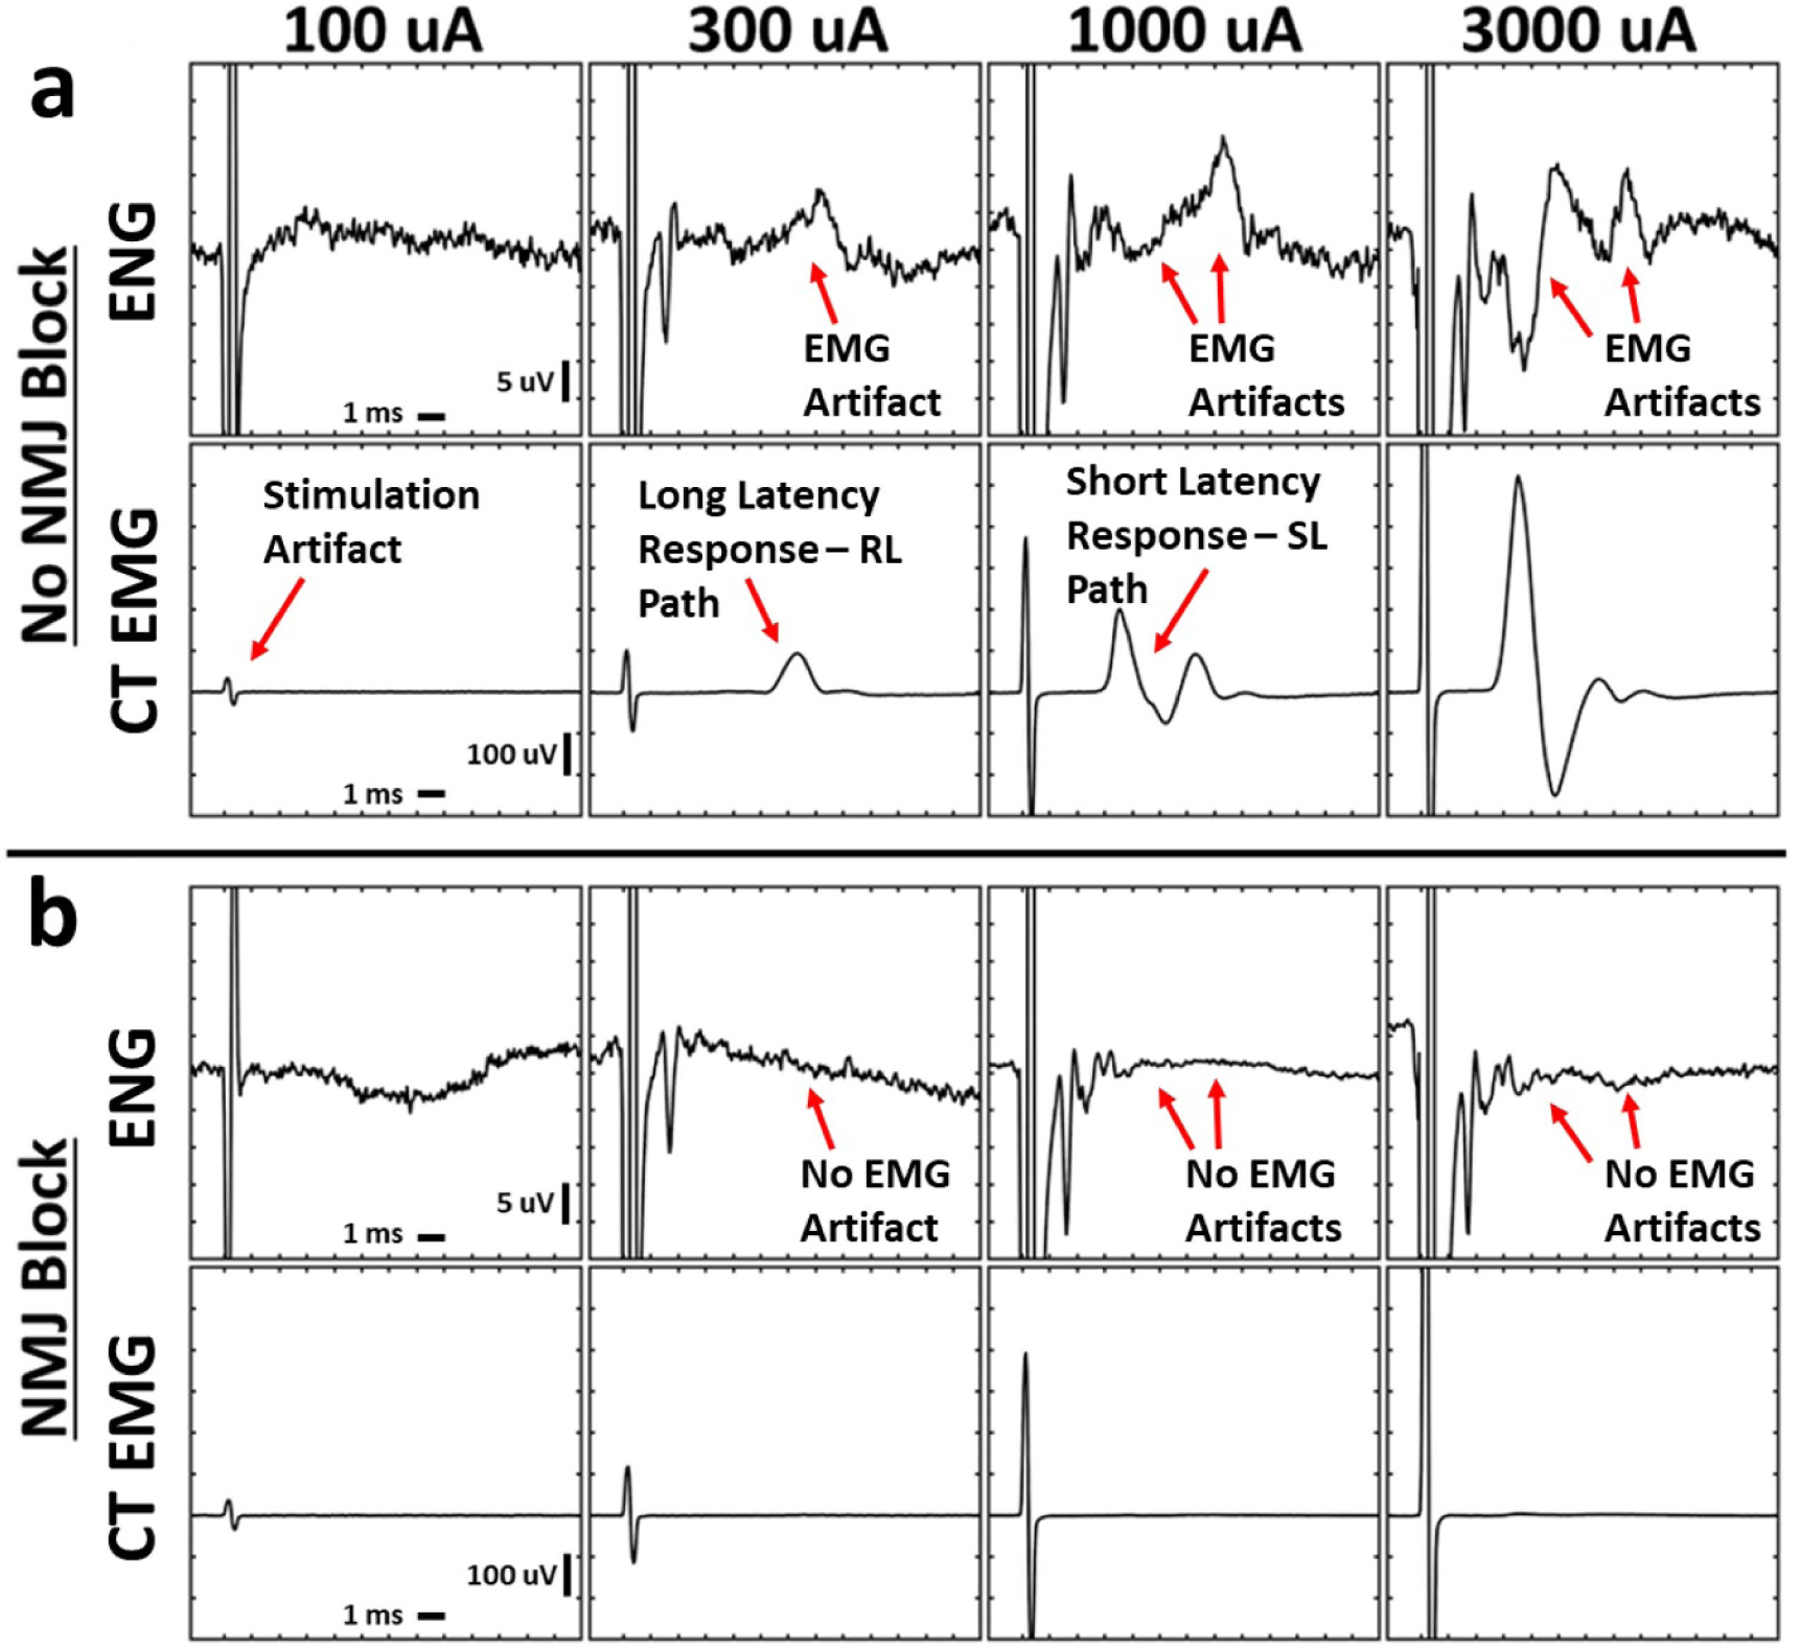
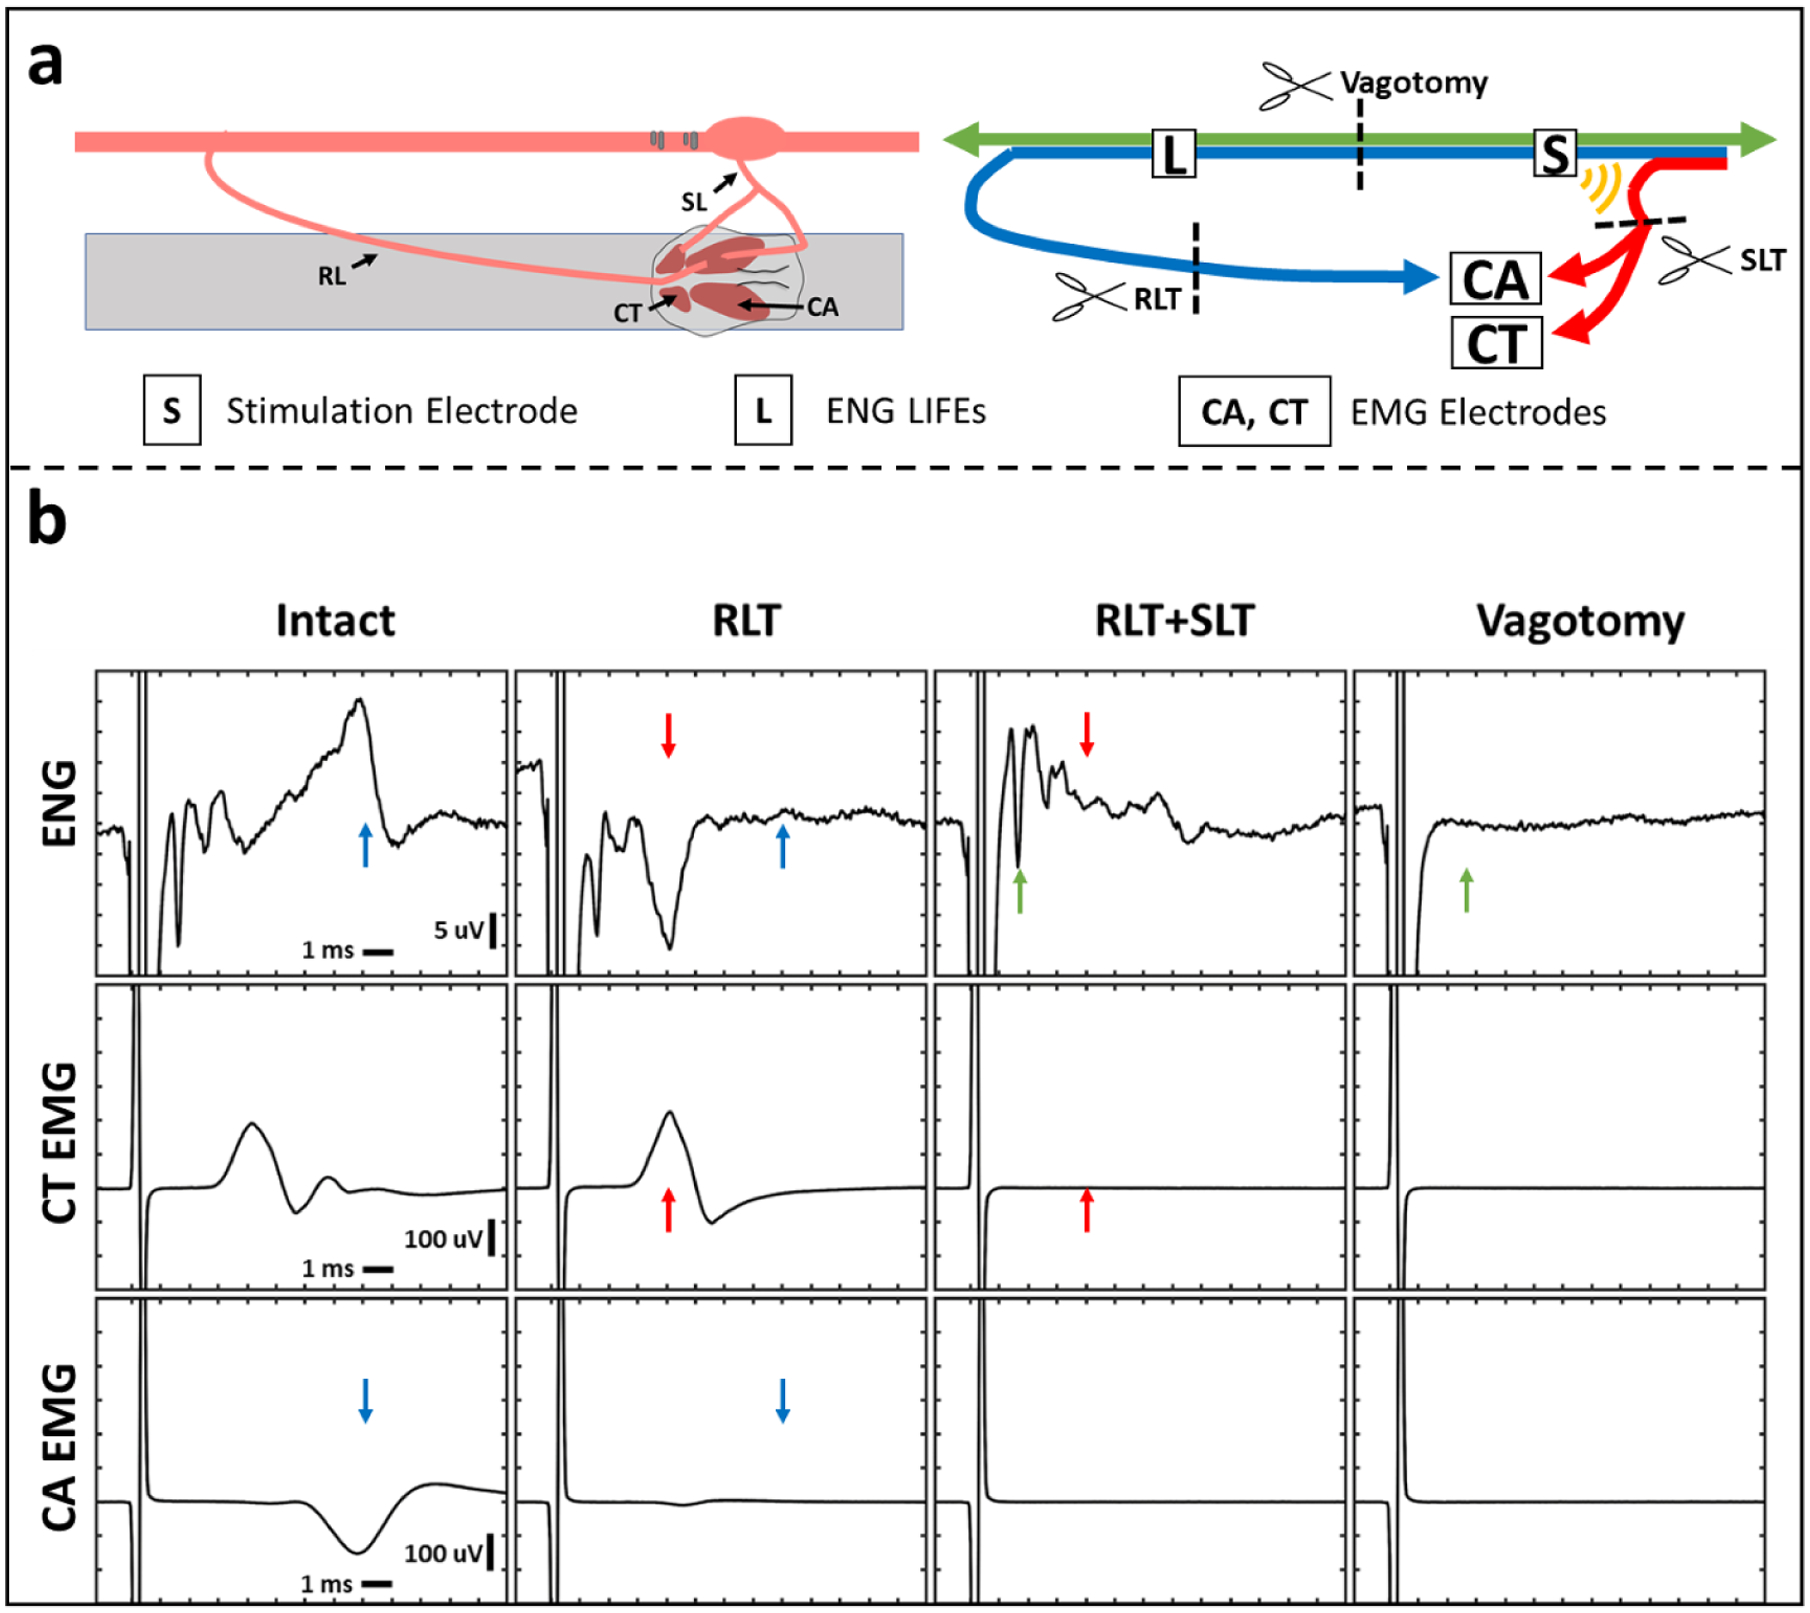
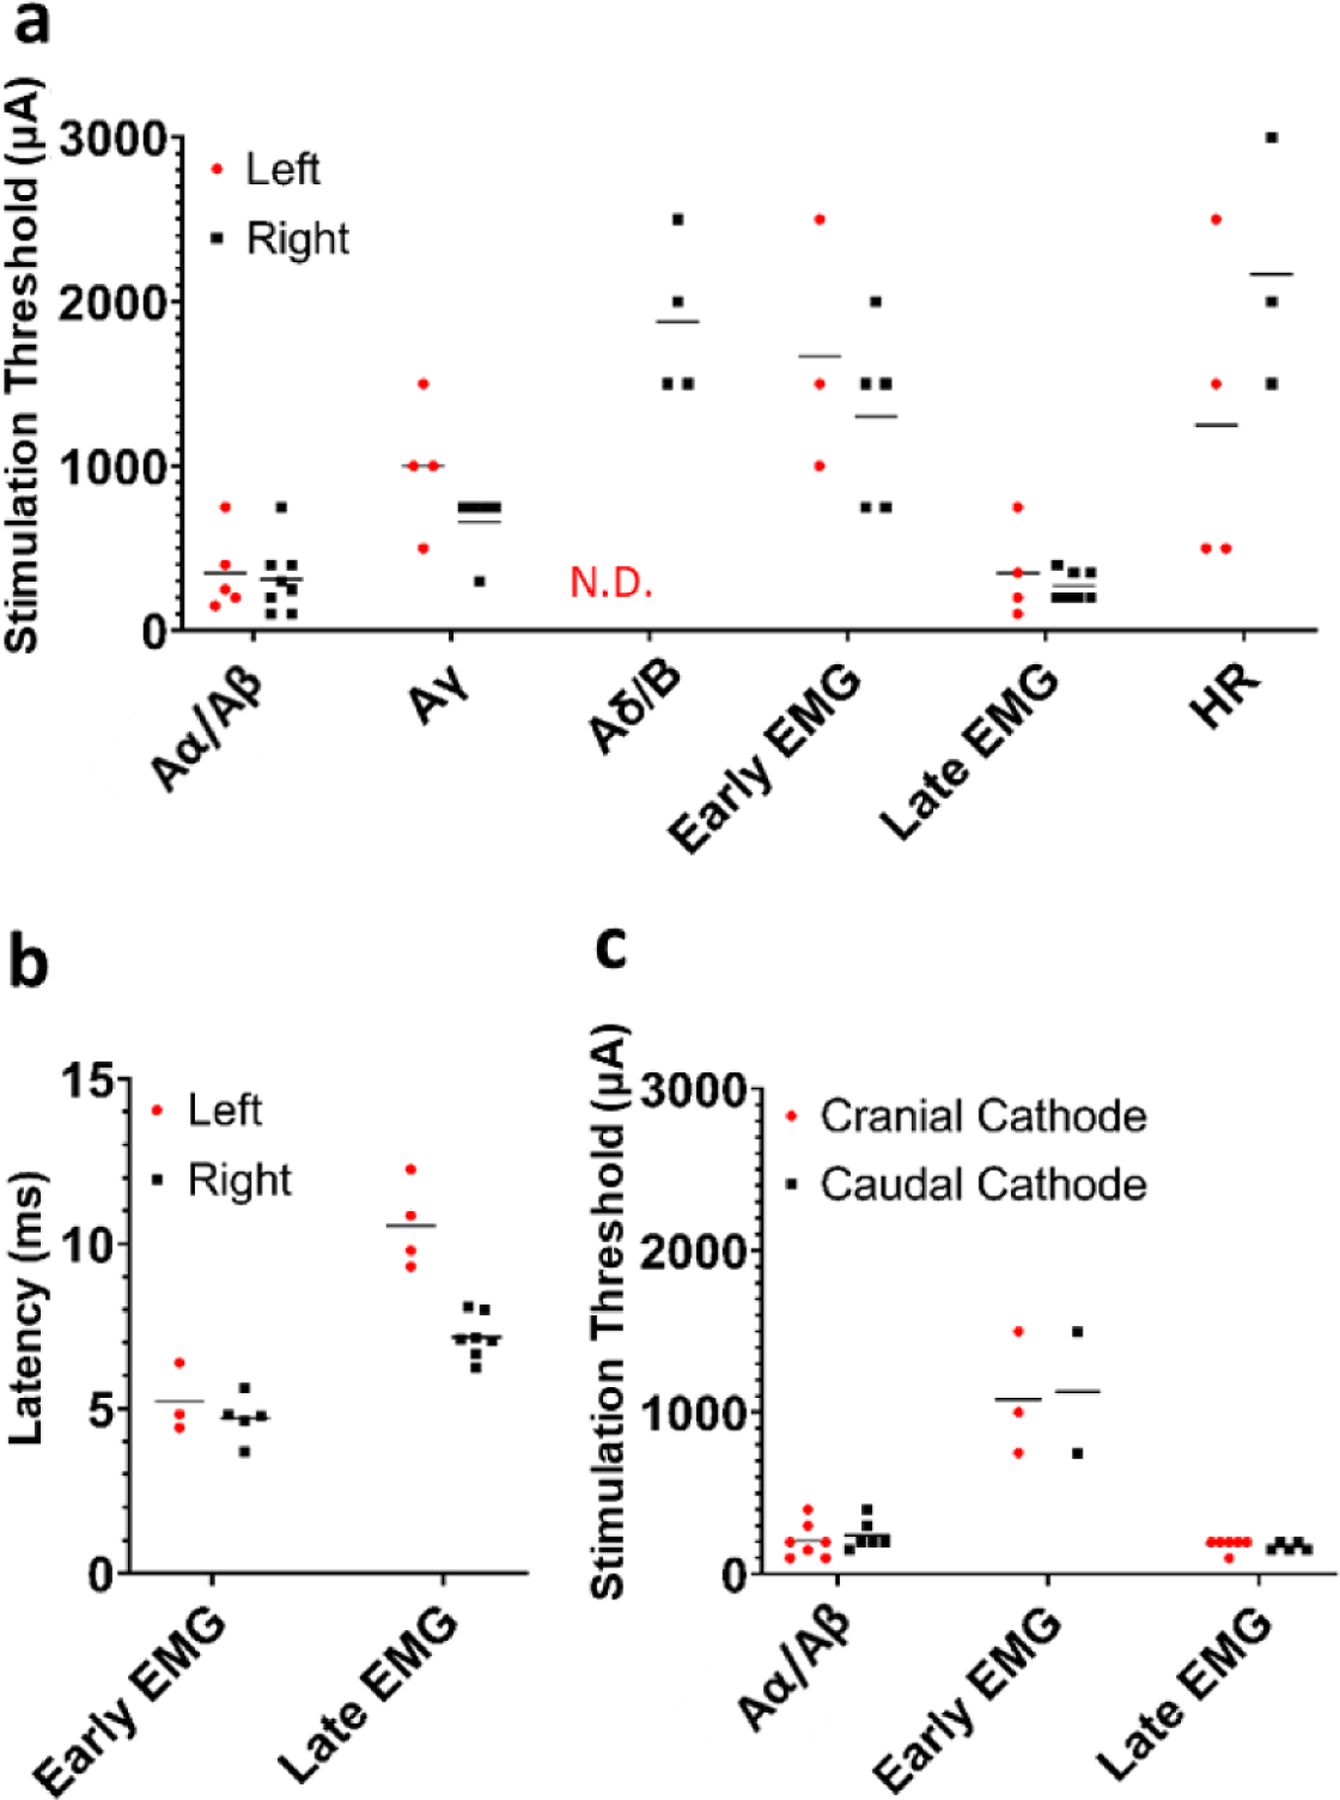
Main results: Contraction of the cricoarytenoid muscle occurred at low amplitudes (~0.3 mA) and resulted from activation of motor nerve fibers in the cervical vagus trunk within the electrode cuff which bifurcate into the recurrent laryngeal branch of the vagus. At higher amplitudes (~1.4 mA), contraction of the cricoarytenoid and cricothyroid muscles was generated by current leakage outside the cuff to activate motor nerve fibers running within the nearby superior laryngeal branch of the vagus. Activation of these muscles generated artifacts in the ENG recordings that may be mistaken for compound action potentials representing slowly conducting Aδ-, B-, and C-fibers.

Significance: Our data resolve conflicting reports of the stimulation amplitudes required for C-fiber activation in large animal studies (>10 mA) and human studies (<250 μA). After removing muscle-generated artifacts, ENG signals with post-stimulus latencies consistent with Aδ- and B-fibers occurred in only a small subset of animals, and these signals had similar thresholds to those that caused bradycardia. By identifying specific neuroanatomical pathways that cause off-target effects and characterizing the stimulation dose-response curves for on- and off-target effects, we hope to guide interpretation and optimization of clinical VNS.


Conflict of interest statement

Conflict of interest

JW and KAL are scientific board members and have stock interests in NeuroOne Medical Inc., a company developing next generation epilepsy monitoring devices. JW also has an equity interest in NeuroNexus technology Inc., a company that supplies electrophysiology equipment and multichannel probes to the neuroscience research community. KAL is also paid member of the scientific advisory board of Cala Health, Blackfynn, Abbott and Battelle. KAL also is a paid consultant for Galvani and Boston Scientific. KAL is a consultant to and co-founder of Neuronoff Inc. None of these associations are directly relevant to the work presented in this manuscript.

Figures

Figure 1.
Figure 1.
Vagus nerve anatomy and experimental setup. (a) Diagram (not to scale) of surgical window showing key anatomy and relative electrode locations. Longitudinal intrafascicular electrode (LIFE), bipolar helical clinical stimulation lead (STIM), cricothyroid muscle (CT), cricoarytenoid muscle (CA), electromyography (EMG), superior laryngeal (SL), recurrent laryngeal (RL). (b) Representative cross sections from left and right vagus nerves obtained from the location along the vagus nerve where stimulation electrode contacts were placed. Black scale bars are 1 mm. Letters indicate anatomical directions ventral (V), lateral (L), medial (M), and dorsal (D).
Figure 2.
Figure 2.
Example ENG and EMG recordings and classification. (a) Example recording from a LIFE showing compound action potential features. (b) Example EMG recording in the cricothyroid muscle showing short- and long-latency components, with the first major deflection of each component labeled, used to calculate the latencies.
Figure 3.
Figure 3.
Stimulation-triggered median ENG and EMG evoked by cervical VNS before and after neuromuscular junction blockade. Electromyograms (EMG) exhibited short- and long-latency components at distinct thresholds, and these signals contaminated the electroneurograms (ENG). Neuromuscular junction blockade with vecuronium eliminated all cricothyroid (CT) and cricoarytenoid (CA, not shown) EMGs and EMG-contamination of ENGs. (a) Simultaneously collected ENG and EMG at multiple stimulation amplitudes (columns) without neuromuscular blockade. (b) Analogous data in the same animal following neuromuscular blockade. X-axis ticks in all plots are 1 ms. Y-axis ticks are 5 μV in all ENG plots and 100 μV in all EMG plots.
Figure 4.
Figure 4.
ENG and EMG recordings before and after transections. Transection of recurrent laryngeal branch (RLT) and superior laryngeal branch (SLT) eliminated long- and short-latency EMGs, respectively. Transection of the vagus trunk eliminated all ENGs. (a) Diagram of the transection methods. Left panel shows a diagram of the surgical window. Right panel shows a wiring diagram of nerve fibers with transection locations (scissors). Blue line depicts recurrent laryngeal branch fibers, red line depicts superior laryngeal branch fibers, and green line depicts other vagus nerve fibers. Yellow semi-circles indicate expected current leakage out of the nerve cuff insulation acting on the superior laryngeal branch fibers that lie outside the cuff. (b) One channel of ENG (top row) and two channels of EMG (cricothyroid (CT; middle row) and cricoarytenoid (CA; bottom row)) collected simultaneously. Columns represent different time points in order from left to right with an additional transection at each step starting from no transections (intact, first column). Stimulation parameters for every column are charge-balanced symmetrical biphasic pulses at 3 mA with 200 μs per phase, delivered at 30 Hz for 30 s. Paired colored arrows highlight components of the signal that changed before and after each transection.
Figure 5.
Figure 5.
Stimulation dose-response curves and determination of stimulation amplitude threshold for each fiber type in a representative animal. EMG recordings were taken before neuromuscular blockade, ENG recordings were taken in the same animal during neuromuscular blockade. All panels are analyses performed in a single animal, data for all animals can be found in the supplementary section. (a) All stimulation-triggered median ENGs for a representative animal. Arrows indicate visually identified thresholds for each ENG signal; Aα/Aβ, Aγ, and Aδ/B from bottom to top. Colored traces represent four different LIFEs. (b) All stimulation-triggered median EMGs for the same representative animal. Arrows indicate visually identified thresholds for each EMG signal; long-component and short-component from bottom to top. Colored traces represent the CA response (red) and CT response (blue). (c), (d) Dose-response curves for Aα/Aβ and Aδ/B ENGs calculated using historically available conduction velocities to determine latency ranges. Black line is average of all LIFEs. (e), (f) Dose-response curves for long-component CA and short-component CT EMGs calculated using visually identified latency ranges.
Figure 6.
Figure 6.
Summary of comparisons between left and right side VNS, as well as cathode and anode configurations. (a) Thresholds for ENG, EMG, and HR responses comparing left and right vagus nerve experiments. (b) Post-stimulus latencies for EMG components comparing left and right vagus nerve experiments. (c) Thresholds for ENG and EMG responses comparing anode and cathode configurations. Note that only animals where responses to both cathode cranial and cathode caudal configurations were recorded are plotted for panel c.

References

    1. Accornero N, Bini G, Lenzi GL and Manfredi M 1977. Selective activation of peripheral nerve fibre groups of different diameter by triangular shaped stimulus pulses J. Physiol 273 539–60 - PMC - PubMed
    1. Agostoni E, Chinnock JE, Daly MDB and Murray JG 1957. Functional and histological studies of the vagus nerve and its branches to the heart, lungs and abdominal viscera in the cat J. Physiol 135 182–205 - PMC - PubMed
    1. Altschuler SM, Bao X, Bieger D, Hopkins DA and Miselis RR 1989. Viscerotopic representation of the upper alimentary tract in the rat: sensory ganglia and nuclei of the solitary and spinal trigeminal tracts J. Comp. Neurol 283 248–68 - PubMed
    1. Anholt TA, Ayal S and Goldberg JA 2011. Recruitment and blocking properties of the CardioFit stimulation lead J. Neural. Eng 8 034004. - PubMed
    1. Aristovich K, Model-based geometrical optimisation and in vivo validation of a spatially selective multielectrode cuff array for vagus nerve neuromodulation (arXiv:1903.12459) 2019. - PubMed

Publication types