. 2020 Jun 18;5(12):e136279.
doi: 10.1172/jci.insight.136279.

Plasma cell-free DNA predicts pediatric cerebral malaria severity

Affiliations

Plasma cell-free DNA predicts pediatric cerebral malaria severity

Iset Medina Vera et al. JCI Insight. .

Abstract

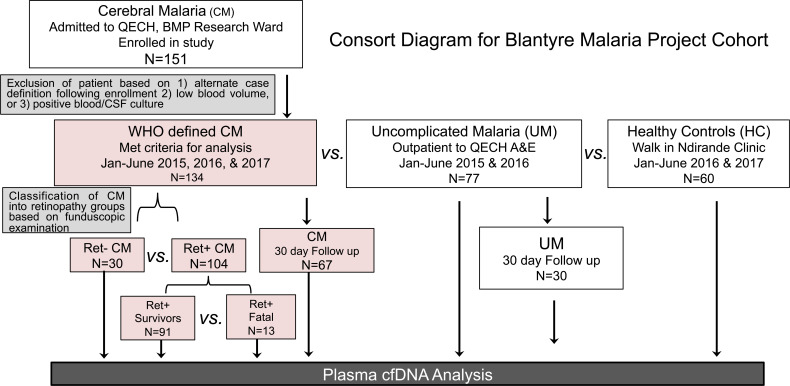
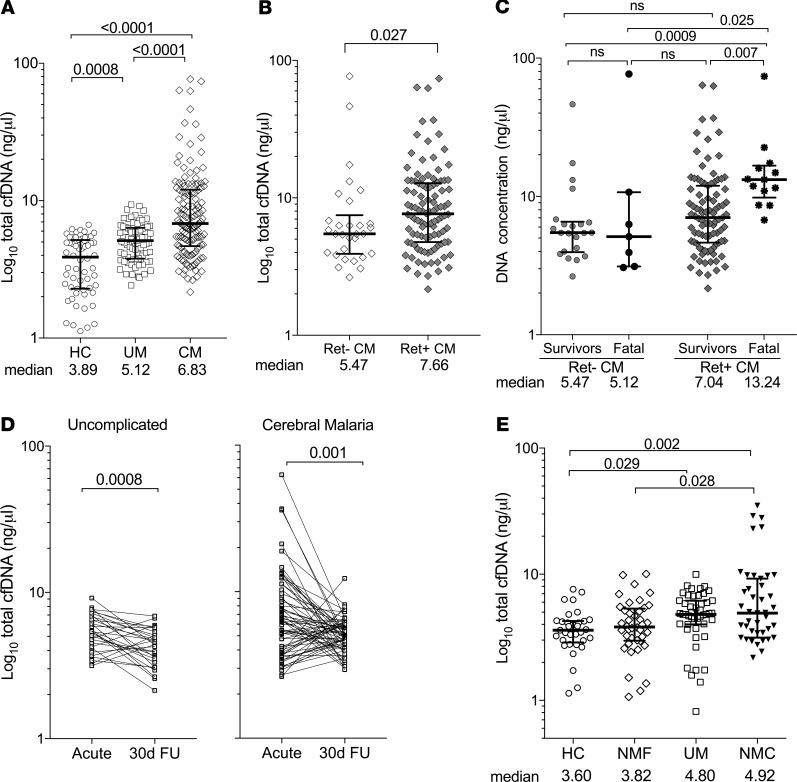
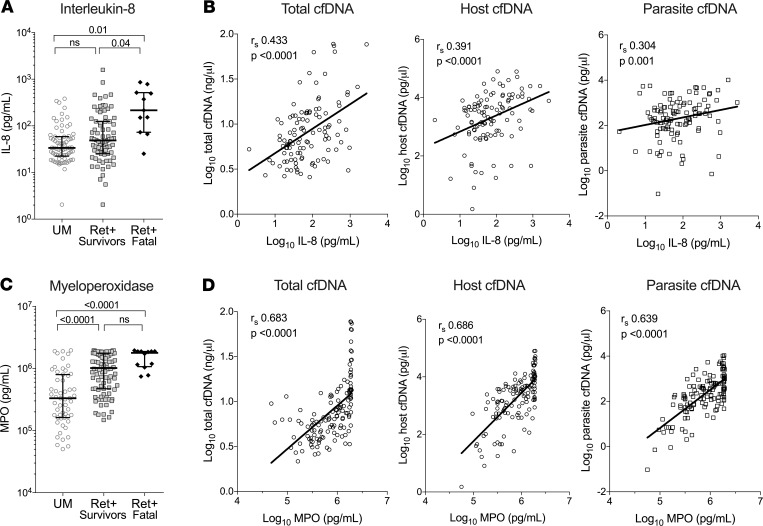
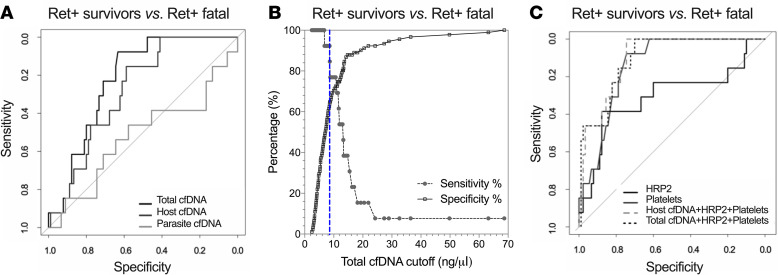
BACKGROUNDPrediction of adverse outcomes in cerebral malaria (CM) is difficult. We hypothesized that cell-free DNA (cfDNA) levels would facilitate identification of severe and potentially fatal CM cases.METHODSIn this retrospective study, plasma from Malawian children with CM (n = 134), uncomplicated malaria (UM, n = 77), and healthy controls (HC, n = 60) was assayed for cfDNA using a fluorescence assay. Host and parasite cfDNA was measured by quantitative PCR. Immune markers were determined by ELISA, Luminex, or cytometric bead array.RESULTSTotal cfDNA increased with malaria severity (HC versus UM, P < 0.001; HC versus CM, P < 0.0001; UM versus CM, P < 0.0001), was elevated in retinopathy-positive (Ret+) CM relative to Ret- CM (7.66 versus 5.47 ng/μL, P = 0.027), and differentiated Ret+ fatal cases from survivors (AUC 0.779; P < 0.001). cfDNA levels in patients with non-malarial febrile illness (NMF, P = 0.25) and non-malarial coma (NMC, P = 0.99) were comparable with UM. Host DNA, rather than parasite DNA, was the major cfDNA contributor (UM, 268 versus 67 pg/μL; CM, 2824 versus 463 pg/μL). Host and parasite cfDNA distinguished CM by retinopathy (host, AUC 0.715, P = 0.0001; parasite, AUC 0.745, P = 0.0001), but only host cfDNA distinguished fatal cases (AUC 0.715, P = 0.0001). Total cfDNA correlated with neutrophil markers IL-8 (rs = 0.433, P < 0.0001) and myeloperoxidase (rs = 0.683, P < 0.0001).CONCLUSIONQuantifying plasma cfDNA is a simple assay useful in identifying children at risk for fatal outcome and has promise as a point-of-care assay. Elevated cfDNA suggests a link with host inflammatory pathways in fatal CM.FUNDINGNIH NCATS (AK), Burroughs-Wellcome (AK), and National Health and Medical Research Council of Australia (SJR).

Keywords: Infectious disease; Inflammation; Malaria.


Conflict of interest statement

Conflict of interest: The authors have declared that no conflict of interest exists.

Figures

Figure 1
Figure 1. Consort diagram of cohort recruitment for BMP study.
Flow chart of Blantyre Malaria Project (BMP) study patient recruitment between 2015 and 2017. CM and UM patients were recruited from Queen Elizabeth Central Hospital (QECH) in Blantyre, Malawi. HC subjects were recruited from Ndirande Health Centre, attending for routine vaccine and health check-up. CM patients were excluded due to failure to meet inclusion criteria (including quick resolution of coma following enrollment), positive blood or CSF cultures, or an alternative diagnosis after enrollment. Plasma samples were collected and analyzed for cfDNA analysis.
Figure 2
Figure 2. Total plasma cfDNA levels are elevated with malaria severity.
(AC) Total plasma cfDNA levels (ng/μL) for clinical and control groups as measured by fluorometry. (A) Healthy controls (HC, n = 60) versus uncomplicated malaria (UM, n = 77) versus cerebral malaria (CM, n = 134). (B) CM classified as Ret CM (n = 30) versus Ret+ CM (n = 104). (C) Survivors (Ret CM, n = 22; Ret+ CM, n = 91) versus fatal cases (Ret CM, n = 7; Ret+ CM, n = 13). (D) Total cfDNA levels in UM (n = 30) or CM (n = 67) convalescence from acute infection to 30-day follow-up (30d FU). (E) Total serum cfDNA levels of healthy controls (HC, n = 33), non–malaria febrile (NMF, n = 40), uncomplicated malaria (UM, n = 47), and non–malaria coma (NMC, n = 49) clinical groups. Shown are median levels ± IQR; statistical significance was determined by Mann-Whitney U test (B), Kruskal-Wallis test for multiple comparisons (A, C, and E), or Wilcoxon signed rank test for paired comparisons (D). P < 0.05 was considered significant.
Figure 3
Figure 3. Host is a major contributor to cfDNA levels in malaria.
(AC) cfDNA levels (pg/μL) as measured by qPCR to detect parasite (Pf18s gene target, black data points) or host (HsRPP30 gene target, blue data points) from various clinical and control groups. (A) Pf18s, UM (n = 65) versus CM (n = 132); HsRPP30, UM (n = 65) versus CM (n = 103). (B) Ret CM (n = 29) versus Ret+ CM (n = 103) for Pf18s and HsRPP30. (C) Ret+ survivors versus Ret+ fatal CM for Pf18s and HsRPP30 (survivors, n = 90; fatal, n = 13). Horizontal bar represents median ± IQR. (D) Host/parasite ratio of cfDNA levels presented in a box-and-whisker plot with min-to-max range. Horizontal dotted line across plot demarcates a ratio value equal to 1. Shown are median levels ± IQR. Statistical significance determined by Mann-Whitney U test (AC) or Kruskal-Wallis test for multiple comparisons (D). P < 0.05 was considered significant.
Figure 4
Figure 4. Plasma cfDNA is associated with markers of neutrophil function.
(A and C) Plasma levels of IL-8 (A) and MPO (C) in UM (n = 73), Ret+ CM survivors (n = 90), and Ret+ CM fatal cases (n = 12). Shown are median levels ± IQR. Statistical significance determined by Kruskal-Wallis test for multiple comparisons. (B and D) IL-8 (B) or MPO (D) were plotted against total, host, or parasite cfDNA and show a positive and significant correlation. Values were log transformed before plotting. Spearman coefficient (rs) and P value of correlation are denoted within graph. P < 0.05 was considered significant. Solid line is a linear regression fit model of data. In B and D, values were log transformed before plotting.
Figure 5
Figure 5. Predictive value of cfDNA as a biomarker of CM fatal outcome.
(A) ROC curves for total cfDNA alone (dark gray curve; AUC, 0.779; P = 0.0006), host cfDNA alone (medium gray curve; AUC, 0.720; P = 0.001), parasite cfDNA (light gray curve; AUC, 0.480; P = ns). (B) Decision plot of sensitivity and specificity plotted against total cfDNA cutoff concentrations for Ret+ CM survivors versus Ret+ CM fatal cases generated from ROC analysis. Vertical blue dashed line demarcates the cutoff point (>8.55 ng/μL) that gives the best combination of sensitivity (92%) to specificity (64%) as determined by Youden Index analysis. (C) ROC curves for HRP2 alone (black solid curve; AUC, 0.691; P = 0.013), platelets alone (gray solid curve; AUC, 0.860; P ≤ 0.0001), and combined variables of total cfDNA + HRP + platelets (dark gray dashed curve; AUC, 0.899; P ≤ 0.0001) and host cfDNA + HRP + platelets (light gray dashed curve; AUC, 0.892; P ≤ 0.0001). ROC, receiver operator curve. P < 0.05 was considered significant.

References

    1. Ashley EA, Pyae Phyo A, Woodrow CJ. Malaria. Lancet. 2018;391(10130):1608–1621. doi: 10.1016/S0140-6736(18)30324-6. - DOI - PubMed
    1. Taylor TE, et al. Differentiating the pathologies of cerebral malaria by postmortem parasite counts. Nat Med. 2004;10(2):143–145. doi: 10.1038/nm986. - DOI - PubMed
    1. Riggle BA, Miller LH, Pierce SK. Do we know enough to find an adjunctive therapy for cerebral malaria in African children? F1000Res. 2017;6:2039. - PMC - PubMed
    1. Fox LL, et al. Histidine-rich protein 2 plasma levels predict progression to cerebral malaria in Malawian children with Plasmodium falciparum infection. J Infect Dis. 2013;208(3):500–503. doi: 10.1093/infdis/jit176. - DOI - PMC - PubMed
    1. Dondorp AM, et al. Estimation of the total parasite biomass in acute falciparum malaria from plasma PfHRP2. PLoS Med. 2005;2(8):e204. doi: 10.1371/journal.pmed.0020204. - DOI - PMC - PubMed

Publication types