. 2020 Jun 18;5(12):e134973.
doi: 10.1172/jci.insight.134973.

LC-FACSeq is a method for detecting rare clones in leukemia

Affiliations

LC-FACSeq is a method for detecting rare clones in leukemia

Eileen Y Hu et al. JCI Insight. .

Abstract

Detecting, characterizing, and monitoring rare populations of cells can increase testing sensitivity, give insight into disease mechanism, and inform clinical decision making. One area that can benefit from increased resolution is management of cancers in clinical remission but with measurable residual disease (MRD) by multicolor FACS. Detecting and monitoring genomic clonal resistance to treatment in the setting of MRD is technically difficult and resource intensive due to the limited amounts of disease cells. Here, we describe limited-cell FACS sequencing (LC-FACSeq), a reproducible, highly sensitive method of characterizing clonal evolution in rare cells relevant to different types of acute and chronic leukemias. We demonstrate the utility of LC-FACSeq for broad multigene gene panels and its application for monitoring sequential acquisition of mutations conferring therapy resistance and clonal evolution in long-term ibrutinib treatment of patients with chronic lymphocytic leukemia. This technique is generalizable for monitoring of other blood and marrow infiltrating cancers.

Keywords: Clonal selection; Diagnostics; Genetics; Leukemias.


Conflict of interest statement

Conflict of interest: The authors have declared that no conflict of interest exists.

Figures

Figure 1
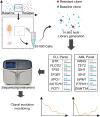
Figure 1. Graphic representation of LC-FACSeq workflow.
Tumor cells are sorted from blood into lysis buffer, where targeted amplicon primer panels are added for subsequent sequencing. LC-FACSeq, limited-cell FACS sequencing.
Figure 2
Figure 2. LC-FACSeq is reproducible down to 300 cells and can detect subclones at 2% frequency.
(A) Poisson/β-binomial modeling of theoretical variability in VAF estimates for 50 to 500 cells for a homozygous variant sequenced with a read depth of 1000 with true VAF less than 10%. (B) Violin plots show deviations between allele frequencies of matched genetic variants called from cell dilutions and their corresponding value in bulk samples for CLL (n = 5) and AML (n = 8). Median percentage deviation from bulk and interquartile range (25th percentile, 75th percentile) for each cell titration is as follows: CLL, 500 (–0.6%, [–3.9, 0.08]); CLL, 300 (0%, [–0.8, 0.1]); CLL, 100 cells (0%, [–1.5, 0.1]); CLL, 50 (0%, [–0.8, 0.1]); AML, 500 (0%, [–2.6, 0.1]); AML, 300 (–0.2%, [–3.5, 0.1]); AML, 200 (0%, [–2.0, 0]). (C) LC-FACSeq detection of different percentages of BTK p.C481S primary B cells (0%, 2%, 5%, 8%, 10%, 25%, 50%, 75%, and 100% of 300 cells total) sorted into BTK WT primary B cells in 3 independent experiments. Mean VAF and standard deviation are as follows: (BTK p.C481S true VAF: observed VAF mean ± SD) 0%: 0.43% ± 0.8%; 2%: 2.5% ± 0.9%; 5%: 6.4% ± 4.7%; 8%: 9.0% ± 3.3%; 10%: 8.7% ± 3.4%; 25%: 24.6% ± 7.3%; 50%: 47.4% ± 4.2%; 75%: 71.7% ± 2.1%; 100%: 99.5% ± 0.8%. LC-FACSeq, limited-cell FACS sequencing; CLL, chronic lymphocytic leukemia; AML. acute myeloid leukemia; VAF, variant allele frequency.
Figure 3
Figure 3. Clonal shifts detected by LC-FACSeq of variants before and after ibrutinib treatment of (n = 7) patients with CLL.
Visualization of variants found in paired baseline and on treatment (ibrutinib) samples. Genes that were changed by greater than 5% had PolyPhen-2 scores greater than 0.5 and were predicted to be pathogenic in the ClinVar database. Red lines and symbols indicate increased variant allele frequency from baseline and blue lines and symbols indicate decreased variant allele frequency from baseline. Each patient sample and time point was sorted and sequenced separately in single LC-FACSeq experiments. LC-FACSeq, limited-cell FACS sequencing; CLL, chronic lymphocytic leukemia.
Figure 4
Figure 4. LC-FACSeq can detect early presence of ibrutinib-resistant subclones despite clinically stable disease.
Visualization of BTK p.C481S variants found in serial samples of (n = 4) patients previously clinically determined to have developed ibrutinib resistance. Time points are depicted on the x axis as year/month/date. Left y axis and red line/points denote the average measures for BTK p.C481S VAF percentage at each time point from 2 independent experiments. Different single nucleotide polymorphisms resulting in BTK p.C481S mutations are denoted with a red square or red asterisk. The black right y axis and black line/points denote the absolute values of clinically determined WBCs (1 × 10³ cells/mm3 blood) for each time point. Right y axis and blue dashed line/points denote the absolute count of leukemic CD19+CD5+ B cells as determined by clinical multiparameter flow cytometry. Blue arrows show time of ibrutinib therapy initiation and red arrows show time of clinical relapse. Each sequenced time point is the average of the variant allele frequency detected in 2 independent experiments. LC-FACSeq, limited-cell FACS sequencing; VAF, variant allele frequency.

References

    1. Hallek M, et al. Guidelines for the diagnosis and treatment of chronic lymphocytic leukemia: a report from the International Workshop on Chronic Lymphocytic Leukemia updating the National Cancer Institute-Working Group 1996 guidelines. Blood. 2008;111(12):5446–5456. doi: 10.1182/blood-2007-06-093906. - DOI - PMC - PubMed
    1. van der Velden VH, Hochhaus A, Cazzaniga G, Szczepanski T, Gabert J, van Dongen JJ. Detection of minimal residual disease in hematologic malignancies by real-time quantitative PCR: principles, approaches, and laboratory aspects. Leukemia. 2003;17(6):1013–1034. doi: 10.1038/sj.leu.2402922. - DOI - PubMed
    1. Drandi D, et al. Minimal residual disease detection by Droplet Digital PCR in multiple myeloma, mantle cell lymphoma, and follicular lymphoma: a comparison with real-time PCR. J Mol Diagn. 2015;17(6):652–660. doi: 10.1016/j.jmoldx.2015.05.007. - DOI - PubMed
    1. Duncavage EJ, et al. Mutation clearance after transplantation for myelodysplastic syndrome. N Engl J Med. 2018;379(11):1028–1041. doi: 10.1056/NEJMoa1804714. - DOI - PMC - PubMed
    1. Puente XS, et al. Whole-genome sequencing identifies recurrent mutations in chronic lymphocytic leukaemia. Nature. 2011;475(7354):101–105. doi: 10.1038/nature10113. - DOI - PMC - PubMed

Publication types

MeSH terms