. 2020 Jul 9;5(13):e135678.
doi: 10.1172/jci.insight.135678.

Single cell RNA sequencing identifies an early monocyte gene signature in acute respiratory distress syndrome

Affiliations

Single cell RNA sequencing identifies an early monocyte gene signature in acute respiratory distress syndrome

Yale Jiang et al. JCI Insight. .

Abstract

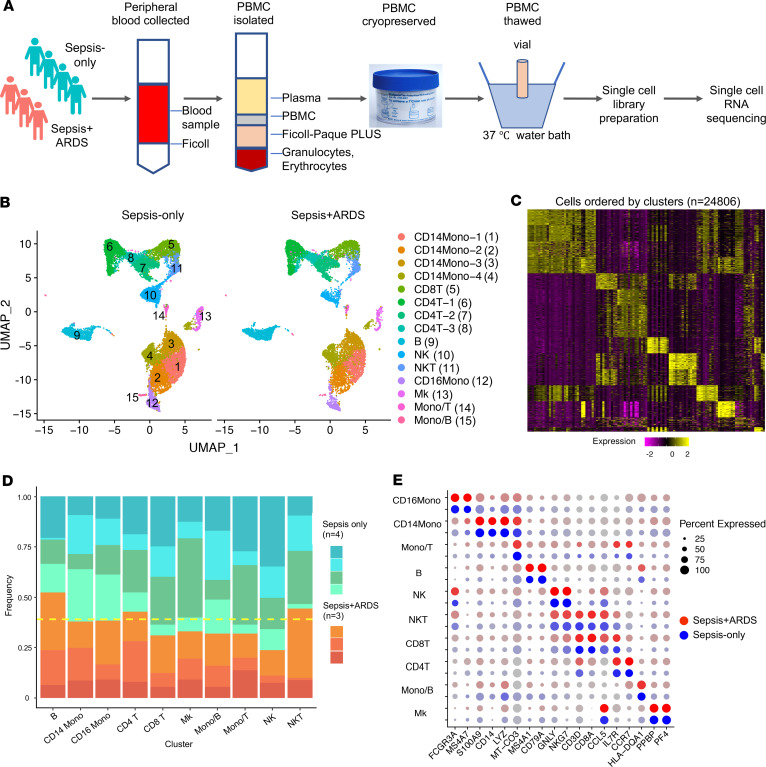
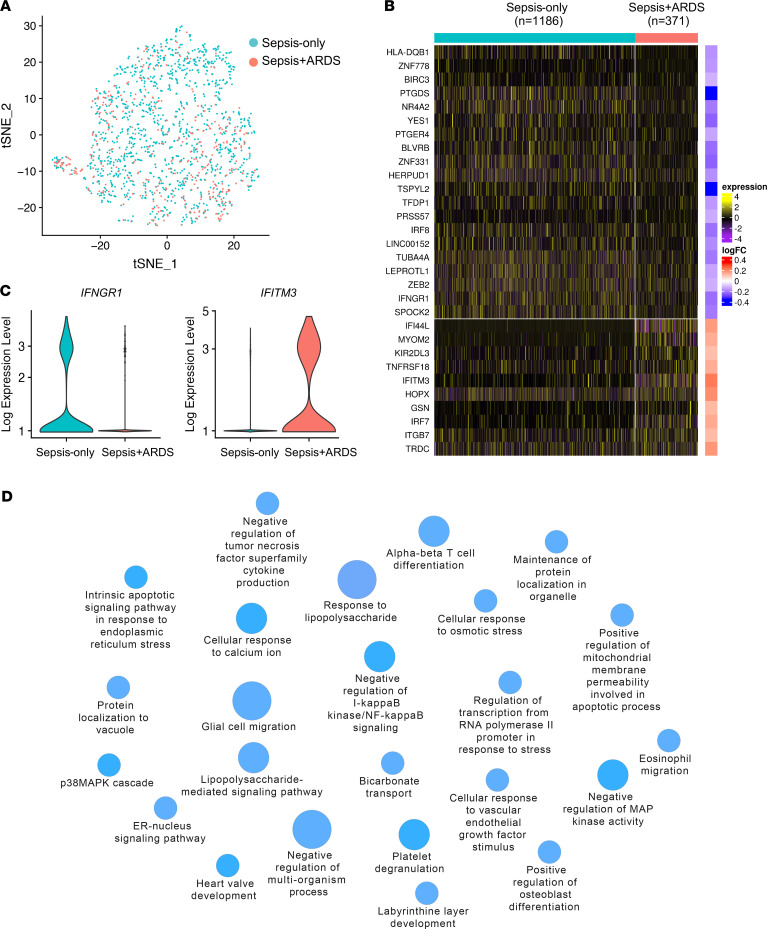
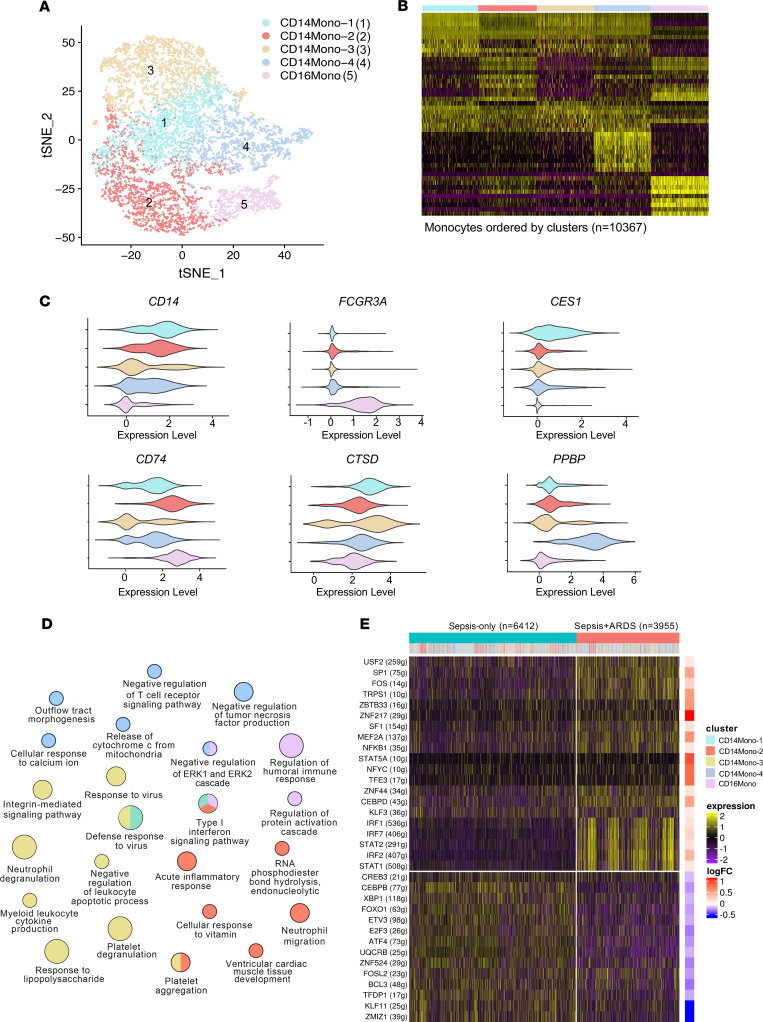
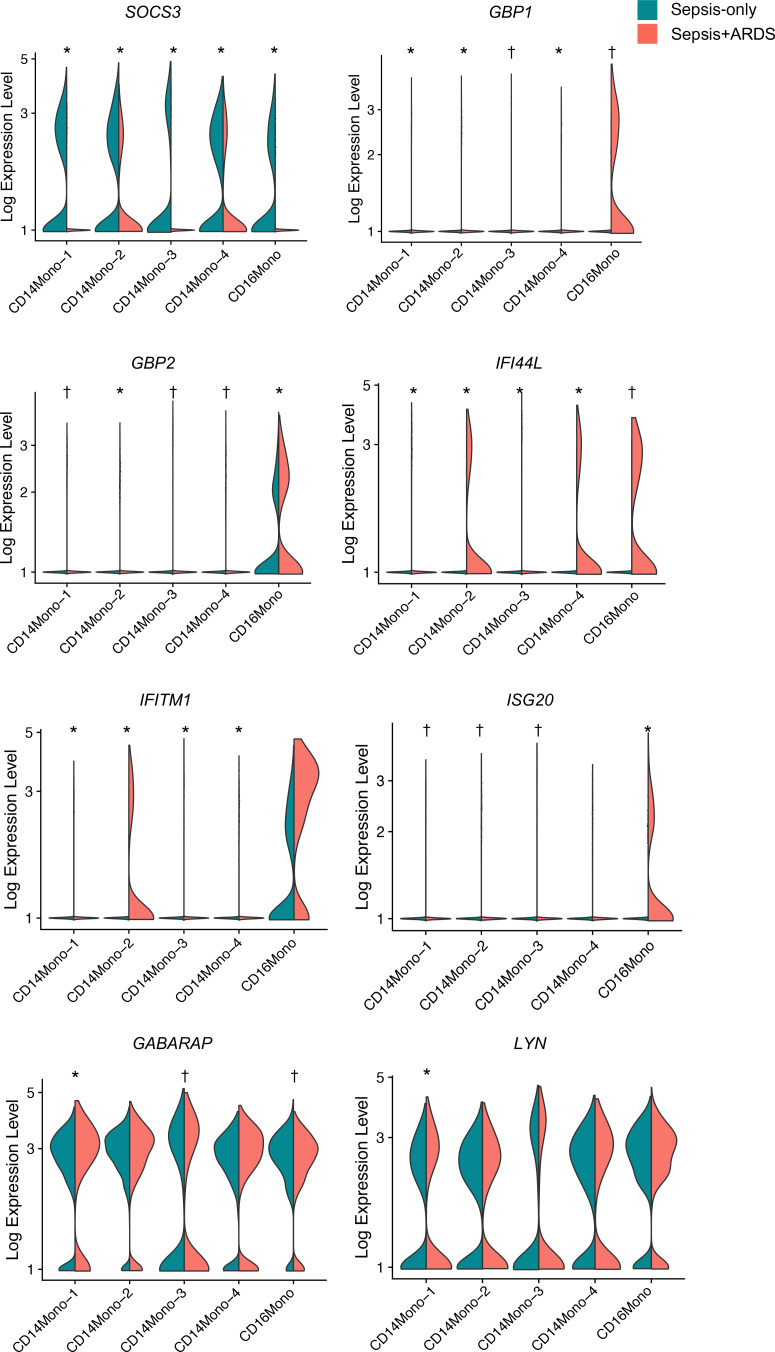
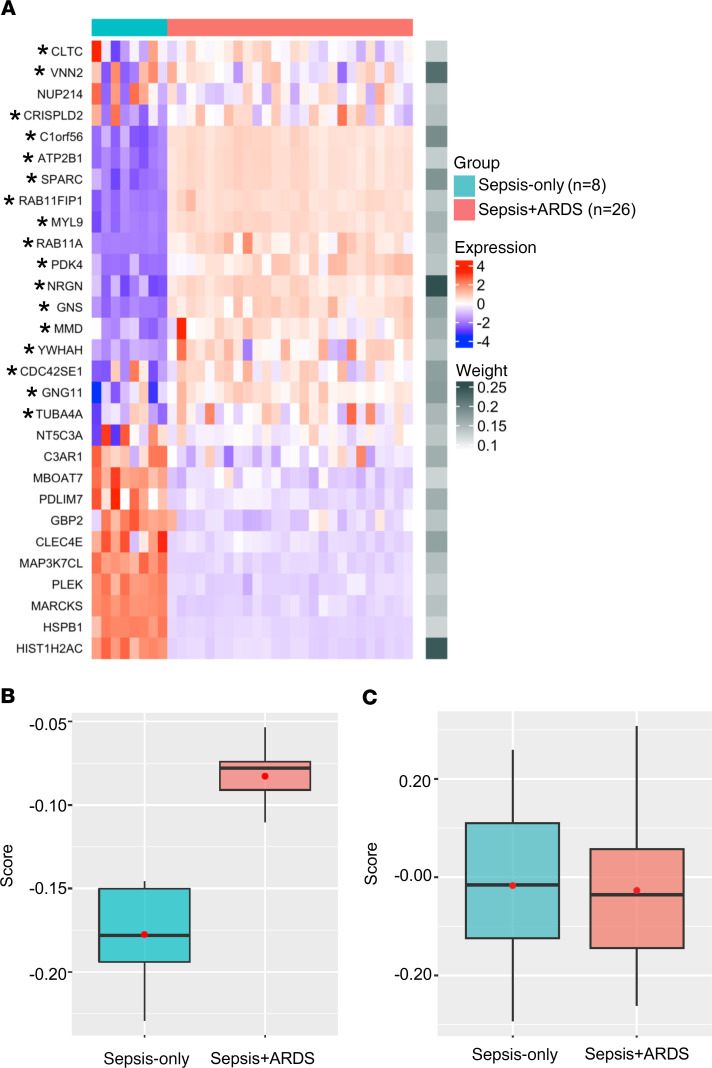
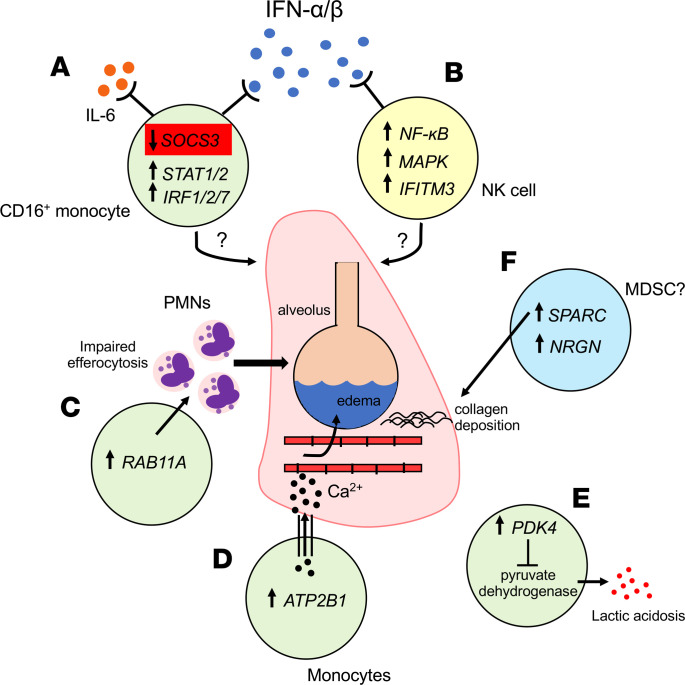
Acute respiratory distress syndrome (ARDS) results from overwhelming pulmonary inflammation. Prior bulk RNA sequencing provided limited insights into ARDS pathogenesis. We used single cell RNA sequencing to probe ARDS at a higher resolution. PBMCs of patients with pneumonia and sepsis with early ARDS were compared with those of sepsis patients who did not develop ARDS. Monocyte clusters from ARDS patients revealed multiple distinguishing characteristics in comparison with monocytes from patients without ARDS, including downregulation of SOCS3 expression, accompanied by a proinflammatory signature with upregulation of multiple type I IFN-induced genes, especially in CD16+ cells. To generate an ARDS risk score, we identified upregulation of 29 genes in the monocytes of these patients, and 17 showed a similar profile in cells of patients in independent cohorts. Monocytes had increased expression of RAB11A, known to inhibit neutrophil efferocytosis; ATP2B1, a calcium pump that exports Ca2+ implicated in endothelial barrier disruption; and SPARC, associated with processing of procollagen to collagen. These data show that monocytes of ARDS patients upregulate expression of genes not just restricted to those associated with inflammation. Together, our findings identify molecules that are likely involved in ARDS pathogenesis that may inform biomarker and therapeutic development.

Keywords: Immunology; Innate immunity; Pulmonology.


Conflict of interest statement

Conflict of interest: The authors have declared that no conflict of interest exists.

Figures

Figure 1
Figure 1. scRNA-seq analysis reveals the cellular composition of PBMCs in sepsis-only and sepsis+ARDS patients.
(A) The schematic illustrates the experimental design and work flow. (B) PBMCs were analyzed from sepsis only (n = 4) and sepsis+ARDS (n = 3) patients and projected with uniform manifold approximation and projection (UMAP) plots with colors and the number in parenthesis indicating the identified cell cluster. (C) The heatmap depicts the marker genes corresponding to each cluster identified in B. (D) The frequency of each cell type is depicted in the columns. Each patient is represented by an individual color in a shade of blue/green (sepsis-only) or orange/red (sepsis+ARDS). The yellow dashed line represents an equal frequency between the 2 groups, since there are 4 sepsis-only patients and 3 sepsis+ARDS patients. (E) The plot shows identification of marker genes for each cell cluster, with the size of the dot corresponding to the percentage of cells within the cell population expressing the gene. The brightness of the color represents the average expression level across all cells within the cluster. Blue and red dots indicate sepsis-only and sepsis+ARDS patients, respectively. CD14Mono, CD14+ monocyte; CD8T, CD8+ T cell; CD4T, CD4+ T cell; B, B cell; NK, NK cell; NKT, NK T cell; CD16Mono, CD16+ monocytes; Mk, megakaryocyte.
Figure 2
Figure 2. NK cells show a distinct gene expression profile in ARDS patients.
(A) NK cells from sepsis-only (n = 4) and sepsis+ARDS (n = 3) patients are plotted in a t-SNE distribution. (B) The heatmap shows differential gene expression in NK cells in the 2 patient groups. The overall log2FC of combined patient samples is indicated on the right side of the plot. (C) Violin plots of IFNGR1 and IFITM3 in sepsis-only and sepsis+ARDS patients. (D) Significantly downregulated genes in NK cells in ARDS patients were analyzed by ClueGO, with each node representing the identified pathway. The size of the node corresponds to the enrichment significance.
Figure 3
Figure 3. Monocyte clusters are identified in sepsis-only and sepsis+ARDS patients.
(A) Monocyte clusters in combined patient samples (n = 4, sepsis-only; n = 3, sepsis+ARDS) are identified by t-SNE distribution. The number in the parenthesis corresponds to the color-coded cell cluster. (B) A heatmap of gene expression in the pooled monocyte clusters is associated with the corresponding cluster in A using the color-coded bar at the top. (C) Violin plots demonstrate expression of the genes that identify each monocyte cluster. (D) Enriched biologic pathways for upregulated genes in sepsis+ARDS patients are demonstrated using ClueGO biological processes. Each node represents a biological process, and the size of the nodes correspond to the enrichment significance. Colors in the nodes correspond to the monocyte clusters in A. (E) The heatmap demonstrates monocyte transcription factor module expression by patient group and monocyte cluster, with log2FC illustrated on the right side. Data shown represent results obtained from pooled samples in each group.
Figure 4
Figure 4. Downregulation of SOCS3 expression in monocyte clusters and increase in expression of IFN-stimulated genes.
Violin plots of expression of selected genes in the monocyte clusters are shown for sepsis-only (n = 4) and sepsis+ARDS (n = 3) patients. *P< 0.01, representing genes significantly differentially expressed between sepsis-only and sepsis+ARDS patients within each monocyte population, at Bonferroni-corrected P value in MAST but not in Wilcoxon rank sum test; †P < 0.01, representing significance at Bonferroni-corrected P value in both MAST and Wilcoxon rank sum test.
Figure 5
Figure 5. Differential gene expression in monocytes can distinguish between sepsis-only and sepsis+ARDS patients.
(A) Heatmap showing expression levels and weights assigned to each of the 29 genes that distinguish between patients with sepsis only (n = 8) and those with sepsis+ARDS (n = 26) in our scRNA-seq data as compared with microarray gene expression data of peripheral blood monocytes that were publicly available in 2 data sets. Asterisks indicate genes upregulated in both the scRNA-seq data set and publicly available data sets. (B and C) Comparison between groups using the ARDS risk score comprising 29 genes (B) versus a random selection of genes (C). Box-and-whisker plots show the median (bar) with IQR (box) and upper/lower limit within 1.5 IQRs from the box range (whiskers). The red dot indicates the mean of the score values. In B, values of the box plot for scores of sepsis-only patients are: minimum = –0.23, lower = –0.19, middle = –0.18, upper = –0.15, maximum = –0.15. For sepsis+ARDS patients: minimum = –0.11, lower = –0.09, middle = –0.08, upper = –0.07, maximum = –0.05. In C, values of the box plot for scores of sepsis-only patients are: minimum = –0.29, lower = –0.12, middle = –0.01, upper = 0.11, maximum = 0.26. For sepsis+ARDS patients: minimum = –0.26, lower = –0.14, middle = –0.04, upper = 0.06, maximum = 0.31. Two-tailed Student’s t test was applied.
Figure 6
Figure 6. Potential immune mechanisms contributing to the development of ARDS.
(A) Monocyte subsets (particularly CD16+ monocytes) downregulate SOCS3 expression, which promotes type I IFN signaling through STAT and IRF pathways. Reduced SOCS3 levels may also modulate IL-6 signaling. (B) NK cells have increased expression of canonical activation signaling cascades including NF-κB, MAPK, and IFN-stimulated genes (IFITM3). (C) Monocytes with increased expression of RAB11A may impair neutrophil efferocytosis, leading to persistent alveolar inflammation. (D) Increased ATP2B1 is involved in calcium efflux, which could contribute to alveolar capillary leak and the development of noncardiogenic pulmonary edema. (E) Increased PDK4 could contribute to lactic acidosis through inhibition of pyruvate dehydrogenase. (F) Monocytes with increased SPARC and NRGN expression could be markers of myeloid-derived suppressor cells (MDSCs). SPARC is involved in collagen deposition, which is observed in the fibroproliferative stage of ARDS.

References

    1. Bellani G, et al. Epidemiology, Patterns of Care, and Mortality for Patients With Acute Respiratory Distress Syndrome in Intensive Care Units in 50 Countries. JAMA. 2016;315(8):788–800. doi: 10.1001/jama.2016.0291. - DOI - PubMed
    1. Fan E, Brodie D, Slutsky AS. Acute Respiratory Distress Syndrome: Advances in Diagnosis and Treatment. JAMA. 2018;319(7):698–710. doi: 10.1001/jama.2017.21907. - DOI - PubMed
    1. Acute Respiratory Distress Syndrome Network, et al. Ventilation with lower tidal volumes as compared with traditional tidal volumes for acute lung injury and the acute respiratory distress syndrome. N Engl J Med. 2000;342(18):1301–1308. doi: 10.1056/NEJM200005043421801. - DOI - PubMed
    1. National Heart, Lung, Blood Institute Acute Respiratory Distress Syndrome (ARDS) Clinical Trials Network, et al. Comparison of two fluid-management strategies in acute lung injury. N Engl J Med. 2006;354(24):2564–2575. doi: 10.1056/NEJMoa062200. - DOI - PubMed
    1. Guérin C, et al. Prone positioning in severe acute respiratory distress syndrome. N Engl J Med. 2013;368(23):2159–2168. doi: 10.1056/NEJMoa1214103. - DOI - PubMed

Publication types