

Using polygenic scores for identifying individuals at increased risk of substance use disorders in clinical and population samples
- PMID: 32555147
- PMCID: PMC7303212
- DOI: 10.1038/s41398-020-00865-8
Using polygenic scores for identifying individuals at increased risk of substance use disorders in clinical and population samples
Abstract
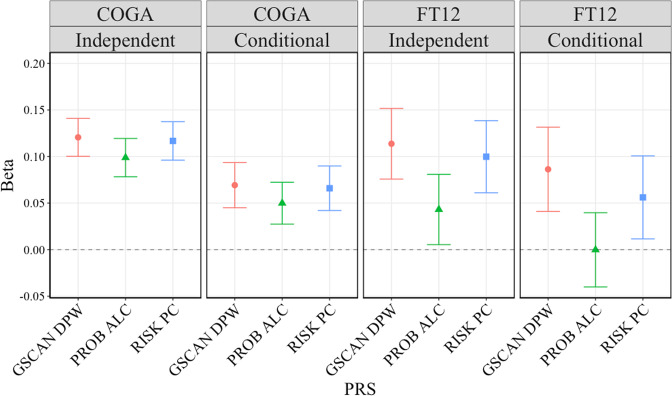
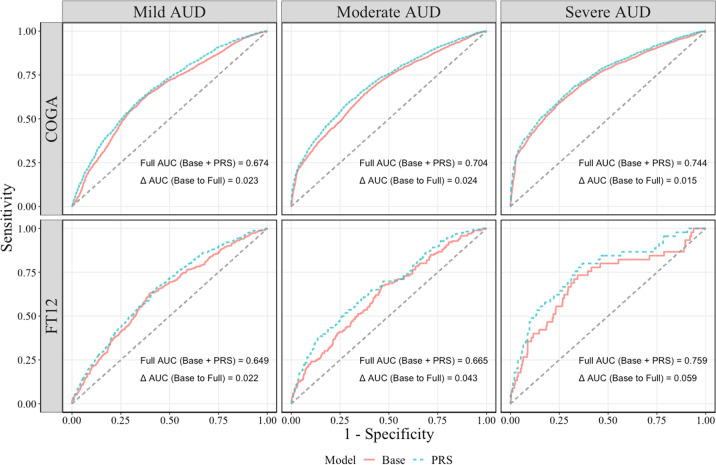
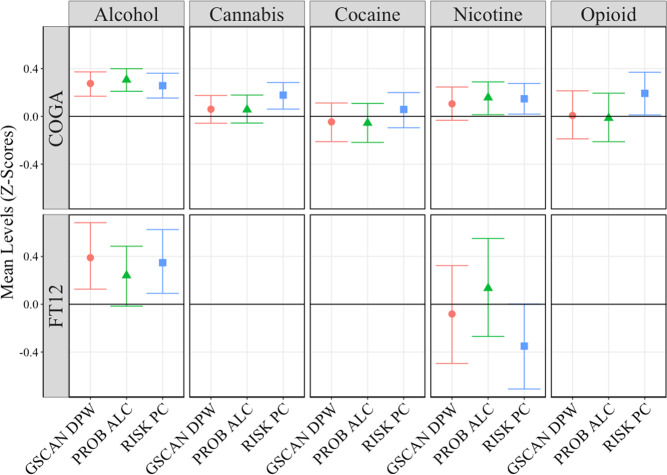
Genome-wide, polygenic risk scores (PRS) have emerged as a useful way to characterize genetic liability. There is growing evidence that PRS may prove useful for early identification of those at increased risk for certain diseases. The current potential of PRS for alcohol use disorders (AUD) remains an open question. Using data from both a population-based sample [the FinnTwin12 (FT12) study] and a high-risk sample [the Collaborative Study on the Genetics of Alcoholism (COGA)], we examined the association between PRSs derived from genome-wide association studies (GWASs) of (1) alcohol dependence/alcohol problems, (2) alcohol consumption, and (3) risky behaviors with AUD and other substance use disorder (SUD) criteria. These PRSs explain ~2.5-3.5% of the variance in AUD (across FT12 and COGA) when all PRSs are included in the same model. Calculations of area under the curve (AUC) show PRS provide only a slight improvement over a model with age, sex, and ancestral principal components as covariates. While individuals in the top 20, 10, and 5% of the PRS distribution had greater odds of having an AUD compared to the lower end of the continuum in both COGA and FT12, the point estimates at each threshold were statistically indistinguishable. Those in the top 5% reported greater levels of licit (alcohol and nicotine) and illicit (cannabis and opioid) SUD criteria. PRSs are associated with risk for SUD in independent samples. However, usefulness for identifying those at increased risk in their current form is modest, at best. Improvement in predictive ability will likely be dependent on increasing the size of well-phenotyped discovery samples.
Conflict of interest statement
Dr. John Nurnberger is an investigator for Janssen.
Figures
References
-
- World Health Organization. Global Status Report on Alcohol and Health (Switzerland, Geneva, 2018).
Publication types
MeSH terms
Grants and funding
- F32AA027435/U.S. Department of Health & Human Services | NIH | National Institute on Alcohol Abuse and Alcoholism (NIAAA)/International
- 114C117/Türkiye Bilimsel ve Teknolojik Araştirma Kurumu (Scientific and Technological Research Council of Turkey)/International
- 118555/Academy of Finland (Suomen Akatemia)/International
- K01DA037914/U.S. Department of Health & Human Services | NIH | National Institute on Drug Abuse (NIDA)/International
- 308698/Academy of Finland (Suomen Akatemia)/International
- K02DA32573/U.S. Department of Health & Human Services | NIH | National Institute on Drug Abuse (NIDA)/International
- 265240/Academy of Finland (Suomen Akatemia)/International
- 100499/Academy of Finland (Suomen Akatemia)/International
- 308248/Academy of Finland (Suomen Akatemia)/International
- 205585/Academy of Finland (Suomen Akatemia)/International
- 312073/Academy of Finland (Suomen Akatemia)/International
- 141054/Academy of Finland (Suomen Akatemia)/International
