. 2020 Jun 18;11(1):3102.
doi: 10.1038/s41467-020-16924-z.

Organic NIR-II molecule with long blood half-life for in vivo dynamic vascular imaging

Affiliations

Organic NIR-II molecule with long blood half-life for in vivo dynamic vascular imaging

Benhao Li et al. Nat Commun. .

Abstract

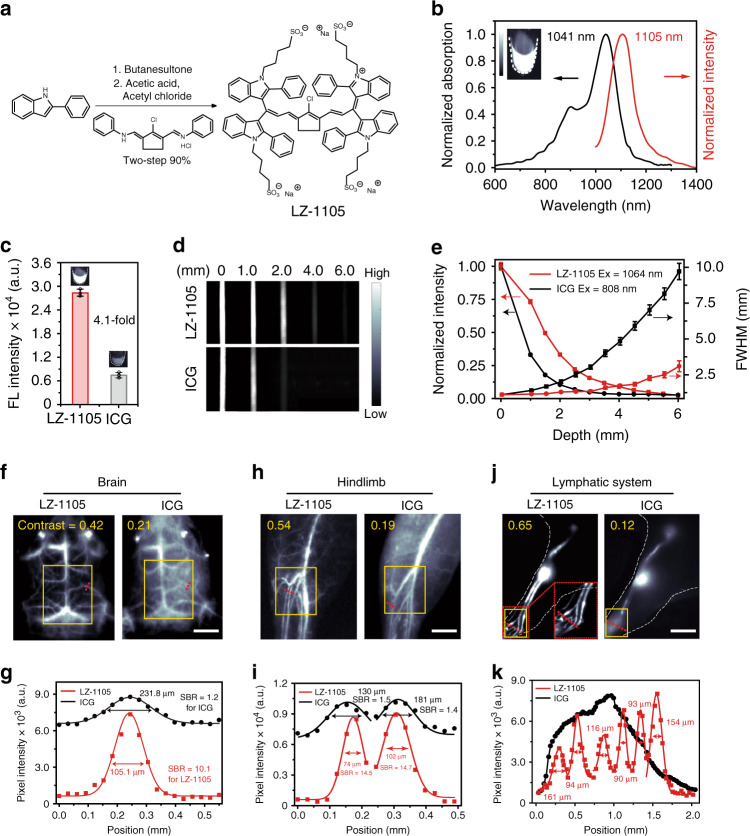
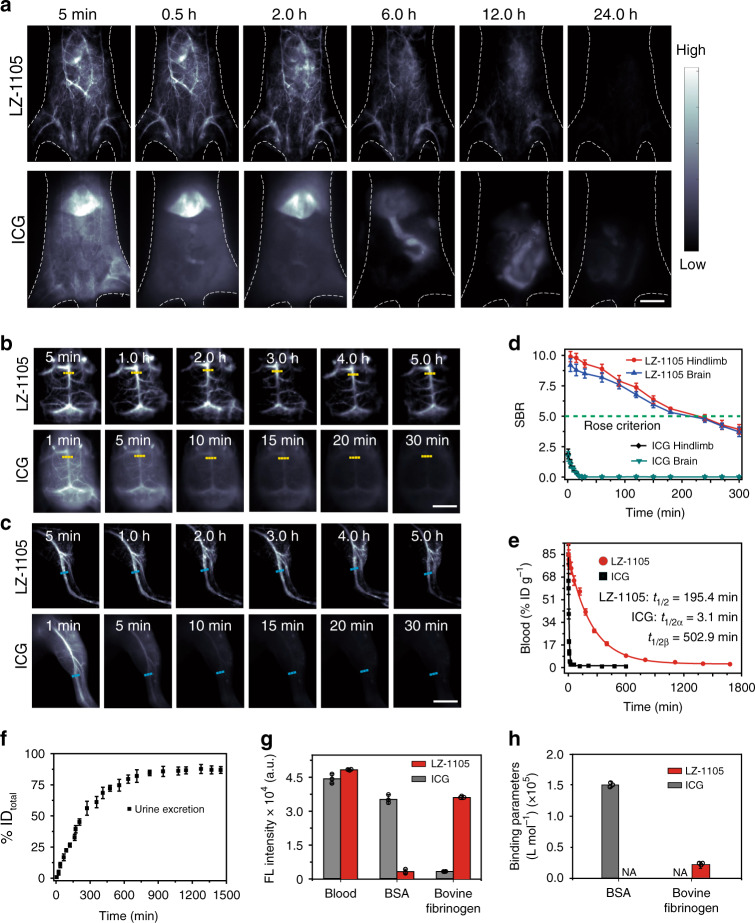
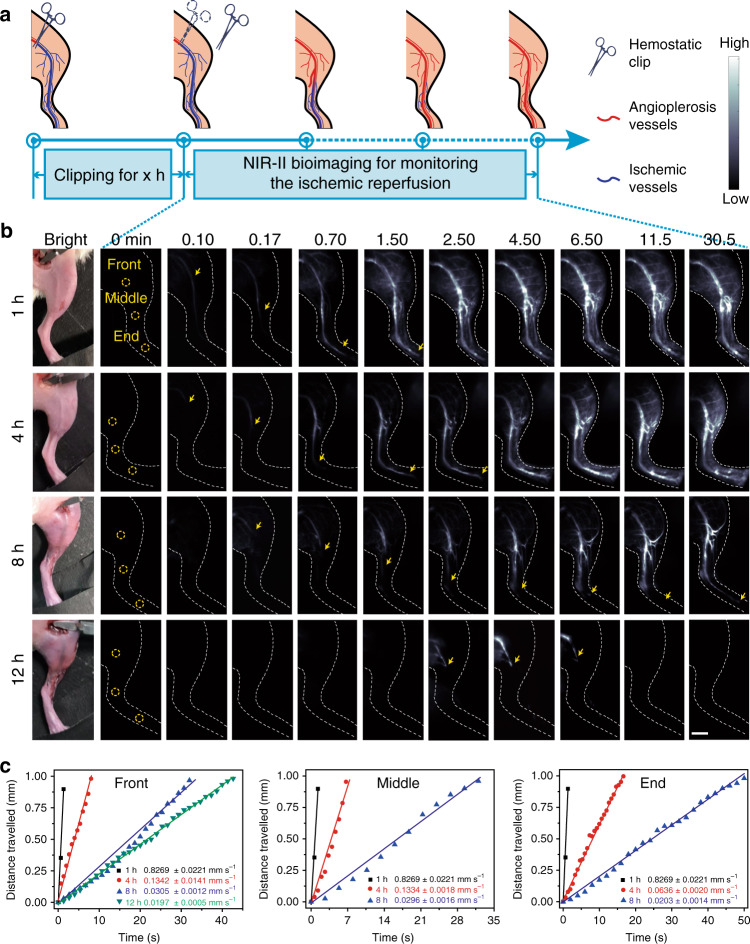
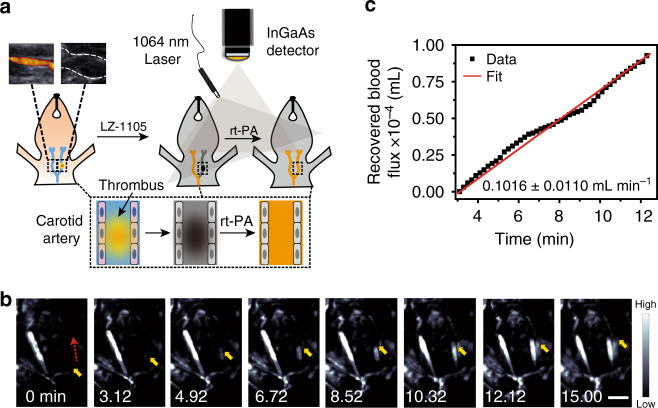
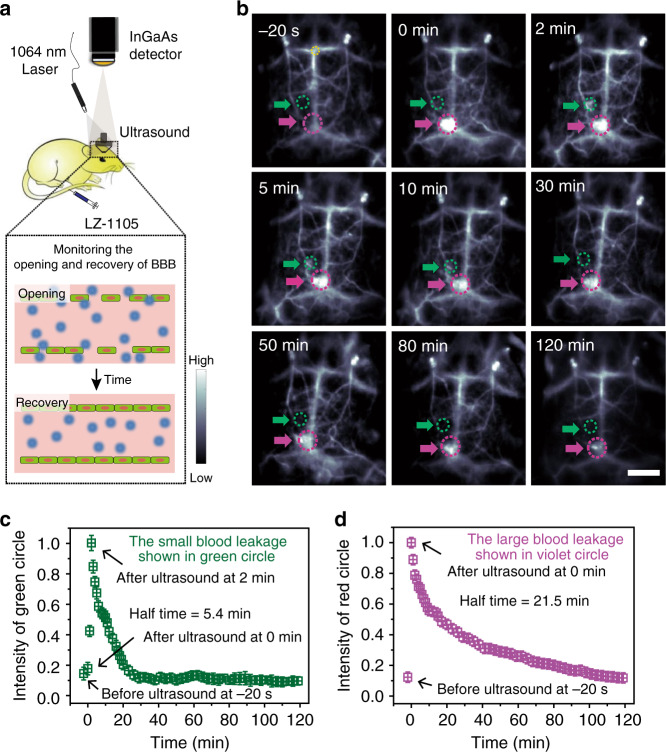
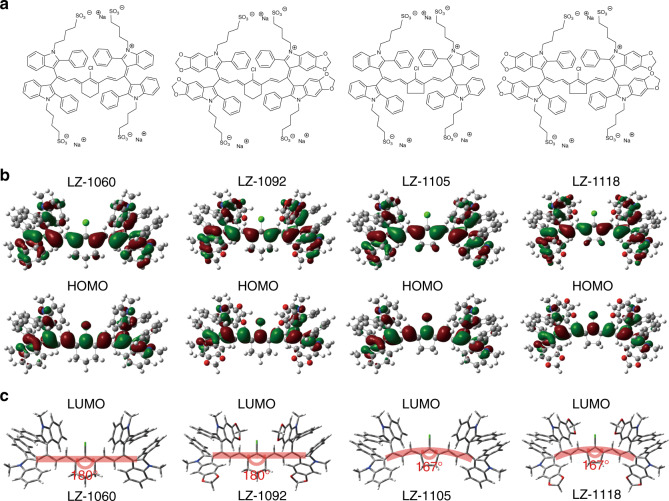
Real-time monitoring of vessel dysfunction is of great significance in preclinical research. Optical bioimaging in the second near-infrared (NIR-II) window provides advantages including high resolution and fast feedback. However, the reported molecular dyes are hampered by limited blood circulation time (~ 5-60 min) and short absorption and emission wavelength, which impede the accurate long-term monitoring. Here, we report a NIR-II molecule (LZ-1105) with absorption and emission beyond 1000 nm. Thanks to the long blood circulation time (half-life of 3.2 h), the fluorophore is used for continuous real-time monitoring of dynamic vascular processes, including ischemic reperfusion in hindlimbs, thrombolysis in carotid artery and opening and recovery of the blood brain barrier (BBB). LZ-1105 provides an approach for researchers to assess vessel dysfunction due to the long excitation and emission wavelength and long-term blood circulation properties.


Conflict of interest statement

The authors declare no competing interests.

Figures

Fig. 1
Fig. 1. Optical characterization of LZ-1105 and in vivo NIR-II imaging comparision by LZ-1105 and ICG.
a Synthetic route of LZ-1105. b Normalized absorption and fluorescence intensity of LZ-1105 in PBS, demonstrating an absorbance peak at 1041 nm and an emission peak at 1105 nm. The fluorescent emission spectrum was obtained under 1064 nm laser excitation. Inset: An NIR-II fluorescence image of LZ-1105 (10 μM) in PBS. c The fluorescence intensity of LZ-1105 and ICG in mice blood under 1064 nm (30 mW cm−2, 1400 nm long-pass filter) and 808 nm (30 mW cm−2, 1300 nm long-pass filter) laser excitation, respectively. Inset: NIR-II fluorescence image of LZ-1105 and ICG in mice blood ([LZ dyes] = [ICG] = 10 μM). NIR-II images (d), normalized signal intensity, and full width at half maximum (FWHM) (e) of LZ-1105 (top, λex = 1064, 1400 nm long-pass filter) and ICG (bottom, λex = 808, 1300 nm long-pass filter) through various thicknesses of 1% Intralipid solution. Equal fluorescent intensities of LZ-1105 and ICG at 0 mm were obtained by adjusting the laser’s working power density. Noninvasive NIR-II fluorescence images of brain (f), hindlimb (h), and lymphatic system (j) in nude mice (brain) and shaved ICR mice (n = 3) (lymphatic system and hindlimb) i.v. injected with LZ-1105 (1400 long-pass filter, λex = 1064 nm, 300 ms) or ICG (1300 long-pass filter, λex = 808 nm, 300 ms) (inset in j shows a magnified view of the red grid, contrast was calculated in the yellow box). g, i, k The fluorescence intensity profiles (dots) and Gaussian fit (lines) along the red dashed line in brain (f), hindlimb (h), and lymphatic system (j). Data point with its error bar stands for mean ± s.d. derived from n = 3 independent experiments. Scale bars in f, h, and j represent 3 mm. Source data underlying c, e, g, i, and k are provided as a Source Data file.
Fig. 2
Fig. 2. Pharmacokinetics and blood retention of LZ-1105 and ICG.
NIR-II bioimaging of mice body (a), brain (b), and hindlimb (c) after i.v. injected with LZ-1105 (1400 nm long-pass, λex = 1064 nm, 300 ms) and ICG (1300 nm long-pass, λex = 808 nm, 300 ms). d The corresponding signal-to-background ratio (SBR) of LZ-1105 and ICG administrated mice along the yellow and cyan dashed line in b and c as a function of time. The green dotted line indicates the Rose criterion. e Blood circulation (%ID g−1) of LZ-1105 and ICG administrated mice as a function of time. f Cumulative urine excretion curve for LZ-1105 injected mice within 24 h p.i. g NIR-II signal intensity of LZ-1105 and ICG with different excitations and long-pass filters. (1064 nm excitation and 1400 nm long-pass filters for LZ-1105, 808 nm excitation and 1300 nm long-pass filters for ICG. Excitation power was adjusted to obtain comparable NIR-II signal in mice blood. [LZ-1105] = [ICG] = 10 μM) h The binding parameters of LZ-1105 and ICG with bovine serum albumin (BSA) and bovine fibrinogen by isothermal titration calorimetry (ITC) at 20 °C. N/A means not measureable by ITC. n = 3 independent mice experiments for ac. Data point with its error bar stands for mean ± s.d. derived from n = 3 independent experiments for dh. Scale bars in a, b, and c represent 4 mm. Source data underlying d, e, f, g, and h are provided as a Source Data file.
Fig. 3
Fig. 3. Real-time NIR-II imaging of the ischemic reperfusion in hindlimbs.
a Schematic illustration of the ischemic reperfusion process. b NIR-II bioimaging with LZ-1105 administration of ischemic reperfusion at different time points after various period clipping treatment (1400 nm long-pass, λex = 1064 nm, 300 ms) as indicated. Three regions of interest (ROI) named as the front, middle, and end sites as shown with yellow circles were chosen to evaluate the ischemic reperfusion process. Yellow arrows indicate the flow front. c The corresponding distance traveled by the flow front at the front, middle, and end site as a function of time after 1, 4, 8, and 12 h clipping, respectively. The slope of the function was calculated as blood flow velocity (BFV) and indicats mean ± s.d. derived from n = 3 replicated measurements. Scale bar represents 4 mm. Source data underlying c is provided as a Source Data file.
Fig. 4
Fig. 4. Real-time NIR-II imaging of the thrombolysis process in carotid artery.
a Schematic illustration of the thrombolysis process. Inset: Ultrasonic imaging of carotid artery without (left) and with (right) thrombus, demonstrating successful formation of a thrombus in the right carotid artery (n = 3 mice). b NIR-II bioimaging of the carotid artery performed by LZ-1105 at various time points p.i. of recombinant tissue plasminogen activator (rt-PA) administration (1400 nm long-pass, λex = 1064 nm, 300 ms). The red dashed and yellow solid arrows indicate the blood flow direction and signal front, respectively. c Recovered blood flux during thrombolysis process as a function of time. The slope of the function was calculated as the recovered blood flux rate in thrombolysis and indicats mean ± s.d. derived from n = 3 replicated measurements. Scale bar represents 3 mm. Source data underlying c is provided as a Source Data file.
Fig. 5
Fig. 5. Real-time noninvasive NIR-II imaging to monitor the opening and recovery of the blood–brain barrier (BBB).
a Schematic illustration of the NIR-II imaging setup to monitor the opening and recovery of the BBB. b The NIR-II images of the mice brain before and after treated with focused ultrasound (FUS) and microbubbles at different time points (n = 3 mice). The green and violet circles and arrows indicate the opening and recovering points of cerebral vessels. Corresponding normalized mean signal intensity of green (c) and violet a (d) circles as a function of time. The fluorescence intensity region (noted as the yellow circle) of each images was normalized to measure the signal intensity decreasing process of the leakage on the brain vessels. Data point with its error bar stands for mean ± s.d. derived from n = 3 replicated measurements. Scale bar represents 4 mm. Source data underlying c and d are provided as a Source Data file.
Fig. 6
Fig. 6. Density functional theory calculations for LZ dyes.
a The chemical structures of LZ dyes. b The HOMOs and LUMOs were plotted based on the optimized S1 geometries of the LZ dyes. c Optimized geometries of the LZ dyes in ground states.

References

    1. Ridker PM, Cook NR. Statins: new American guidelines for prevention of cardiovascular disease. Lancet. 2013;382:1762–1765. - PubMed
    1. Pasterkamp G, den Ruijter HM, Libby P. Temporal shifts in clinical presentation and underlying mechanisms of atherosclerotic disease. Nat. Rev. Cardiol. 2017;14:21–29. - PubMed
    1. Hong G, et al. Multifunctional in vivo vascular imaging using near-infrared II fluorescence. Nat. Med. 2012;18:1841–1846. - PMC - PubMed
    1. Tsukasaki Y, et al. A short-wavelength infrared emitting multimodal probe for non-invasive visualization of phagocyte cell migration in living mice. Chem. Commun. 2014;50:14356–14359. - PubMed
    1. Hong G, Antaris AL, Dai H. Near-infrared fluorophores for biomedical imaging. Nat. Biomed. Eng. 2017;1:0010.

Publication types

Substances