

Genomic analysis of primary plasma cell leukemia reveals complex structural alterations and high-risk mutational patterns
- PMID: 32555163
- PMCID: PMC7303180
- DOI: 10.1038/s41408-020-0336-z
Genomic analysis of primary plasma cell leukemia reveals complex structural alterations and high-risk mutational patterns
Abstract
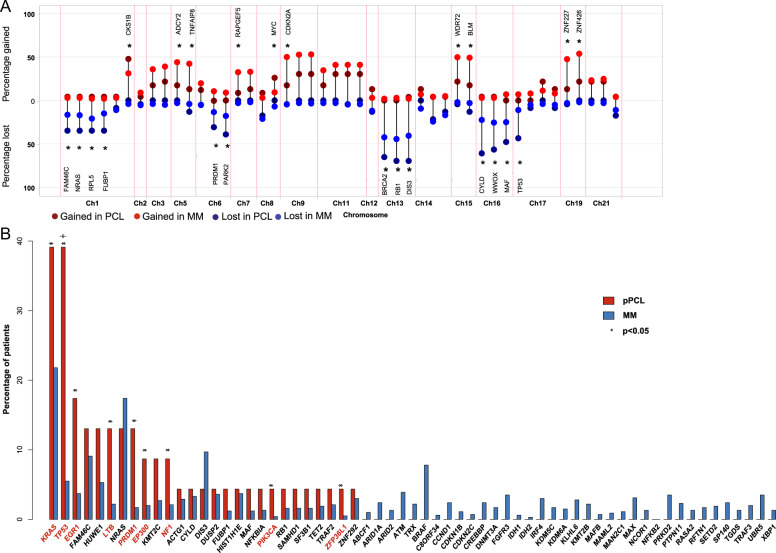
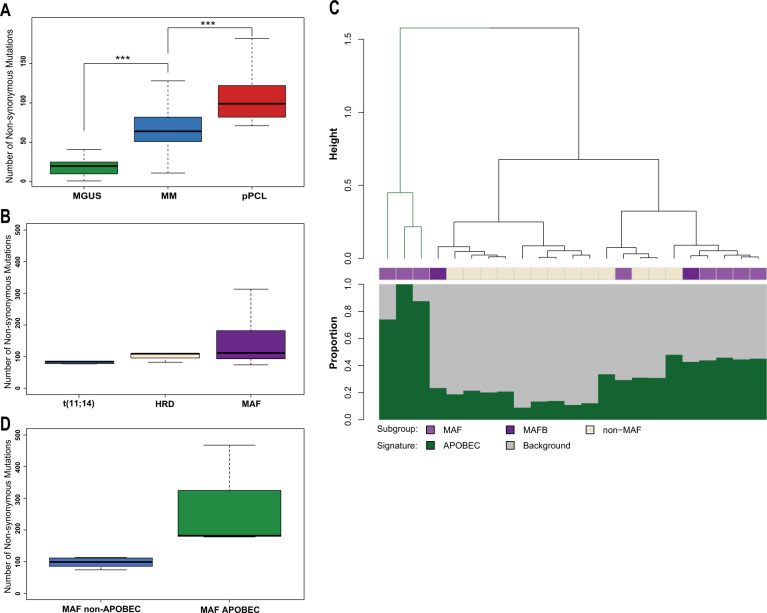
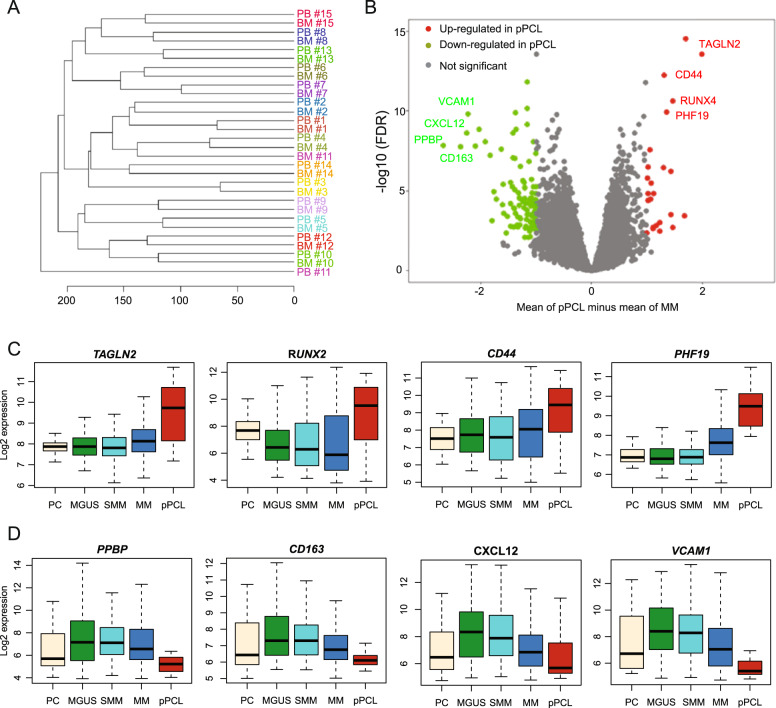
Primary plasma cell leukemia (pPCL) is a rare and aggressive form of multiple myeloma (MM) that is characterized by the presence of ≥20% circulating plasma cells. Overall survival remains poor despite advances of anti-MM therapy. The disease biology as well as molecular mechanisms that distinguish pPCL from non-pPCL MM remain poorly understood and, given the rarity of the disease, are challenging to study. In an attempt to identify key biological mechanisms that result in the aggressive pPCL phenotype, we performed whole-exome sequencing and gene expression analysis in 23 and 41 patients with newly diagnosed pPCL, respectively. The results reveal an enrichment of complex structural changes and high-risk mutational patterns in pPCL that explain, at least in part, the aggressive nature of the disease. In particular, pPCL patients with traditional low-risk features such as translocation t(11;14) or hyperdiploidy accumulated adverse risk genetic events that could account for the poor outcome in this group. Furthermore, gene expression profiling showed upregulation of adverse risk modifiers in pPCL compared to non-pPCL MM, while adhesion molecules and extracellular matrix proteins became increasingly downregulated. In conclusion, this is one of the largest studies to dissect pPCL on a genomic and molecular level.
Conflict of interest statement
The authors declare that they have no conflict of interest.
Figures
References
-
- Kyle RA, Maldonado JE, Bayrd ED. Plasma cell leukemia. Report on 17 cases. Arch. Intern. Med. 1974;133:813–818. - PubMed
-
- Royer B, et al. Bortezomib, doxorubicin, cyclophosphamide, dexamethasone induction followed by stem cell transplantation for primary plasma cell leukemia: a prospective phase II study of the Intergroupe Francophone du Myelome. J. Clin. Oncol. 2016;34:2125–2132. - PubMed
-
- Ganzel C, et al. Primary plasma cell leukemia in the era of novel agents for myeloma—a multicenter retrospective analysis of outcome. Leuk. Res. 2018;68:9–14. - PubMed
Publication types
MeSH terms
Grants and funding
LinkOut - more resources
Full Text Sources
