. 2020 Jun 18;11(1):3097.
doi: 10.1038/s41467-020-16878-2.

Bone marrow adipose tissue is a unique adipose subtype with distinct roles in glucose homeostasis

Affiliations

Bone marrow adipose tissue is a unique adipose subtype with distinct roles in glucose homeostasis

Karla J Suchacki et al. Nat Commun. .

Abstract

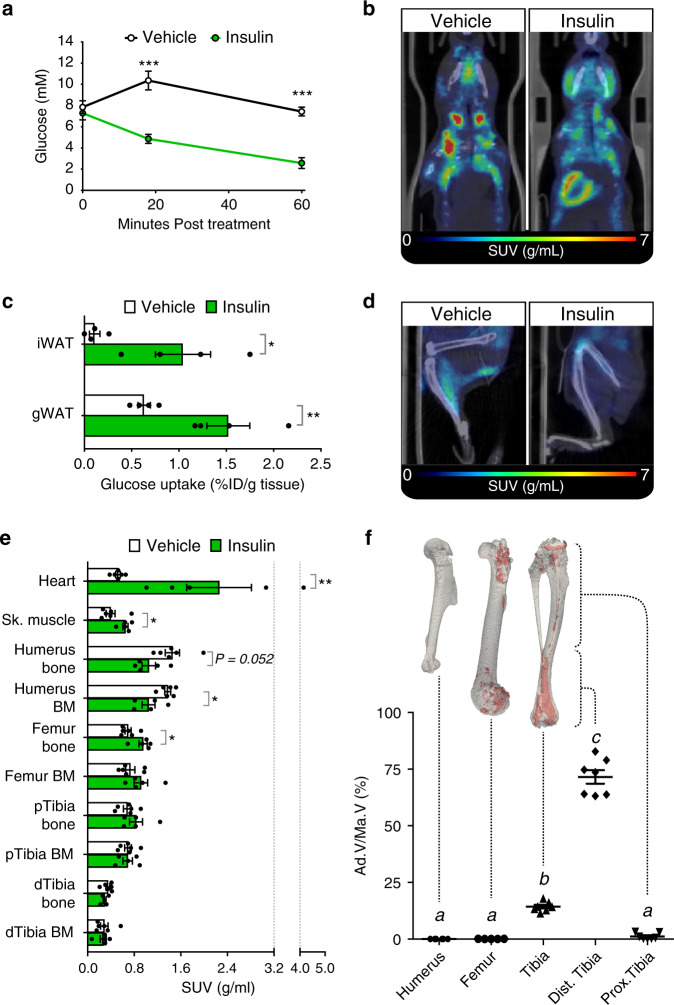
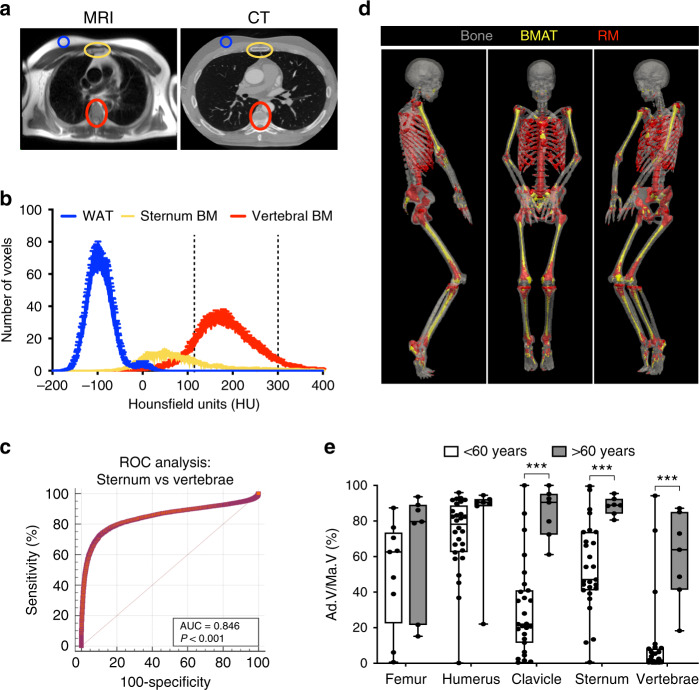
Bone marrow adipose tissue (BMAT) comprises >10% of total adipose mass, yet unlike white or brown adipose tissues (WAT or BAT) its metabolic functions remain unclear. Herein, we address this critical gap in knowledge. Our transcriptomic analyses revealed that BMAT is distinct from WAT and BAT, with altered glucose metabolism and decreased insulin responsiveness. We therefore tested these functions in mice and humans using positron emission tomography-computed tomography (PET/CT) with 18F-fluorodeoxyglucose. This revealed that BMAT resists insulin- and cold-stimulated glucose uptake, while further in vivo studies showed that, compared to WAT, BMAT resists insulin-stimulated Akt phosphorylation. Thus, BMAT is functionally distinct from WAT and BAT. However, in humans basal glucose uptake in BMAT is greater than in axial bones or subcutaneous WAT and can be greater than that in skeletal muscle, underscoring the potential of BMAT to influence systemic glucose homeostasis. These PET/CT studies characterise BMAT function in vivo, establish new methods for BMAT analysis, and identify BMAT as a distinct, major adipose tissue subtype.


Conflict of interest statement

E.J.R.v.B. has received the research support from the Siemens Healthineers and is the owner of QCTIS Ltd. Remaining authors declare no competing interests.

Figures

Fig. 1
Fig. 1. BMAT is transcriptionally distinct from white, brown and beige adipose tissues.
ad Transcriptional profiling of gonadal WAT, inguinal WAT and whole BMAT isolated from the proximal tibia (pBMAT), distal tibia (dBMAT) or radius and ulna (ruBMAT) of two cohorts of rabbits. a Principal component analysis of both cohorts. bd Volcano plots (b), GSEA (c) and heatmaps (d) of transcripts differentially expressed between BMAT (dBMAT + ruBMAT) and WAT (iWAT + gWAT) in rabbit cohort 1. In be, red text indicates differentially expressed transcripts (b) or transcripts/pathways relating to glucose metabolism and/or insulin responsiveness (ce); ns not significant. e Transcriptional profiling of adipocytes isolated from femoral BM or subcutaneous WAT of humans. f Representative micrographs of H&E-stained sections of human femoral BM, subcutaneous WAT and trabecular bone, representative of 24 subjects; scale bar = 150 µm. qPCR (g) of adipocytes isolated from tissues in (f). Data are mean ± SEM of the following numbers of human subjects per cell type: BM Ads, n = 10; WAT Ads, n = 10; Bone Ads, n = 7 (except IRS1, where n = 2 only). For each transcript, significant differences between each cell type are indicated by *P < 0.05, **P < 0.01 or ***P < 0.001. Significance for normally distributed transcripts (INSR, IRS1, IRS2, SLC2A3 and UCP1) was assessed by one-way ANOVA using Dunnett’s test for multiple comparisons; for IRS1, Sidak’s multiple comparisons test was used because, with n = 2 for Bone Ads, only BMAds and WAT Ads were compared. For non-normally distributed transcripts (SLC2A4 and SLC2A1) significance was assessed by the Kruskal–Wallis test, using Dunn’s test for multiple comparisons. Source data are provided as a Source Data file. See also Supplementary Figs. 1 and 2.
Fig. 2
Fig. 2. Expression of proteins essential for insulin signalling is lower in BMAT than in WAT.
Total protein was isolated from gWAT, proximal tibial RM (pTib RM) and tibial dBMAT of four rats, as described in the ‘Methods’. a Expression of the indicated proteins was then determined by immunoblotting, with ERK1/2 used as a loading control. b Quantification of protein expression from (a). For each sample, expression of the indicated protein was normalised to ERK1/2 as a loading control. Data are presented relative to expression levels in gWAT as mean ± SEM of four rats. Significant differences between gWAT and pTib RM or dBMAT were determined by two-way ANOVA and are indicated by *P < 0.05, **P < 0.01 or ***P < 0.001. Source data and full scans of immunoblots are provided as a Source Data file.
Fig. 3
Fig. 3. Insulin treatment in mice does not induce glucose uptake in BMAT.
Insulin-stimulated glucose uptake was assessed by PET/CT. a Blood glucose post-insulin (n = 7 mice) or vehicle (n = 8 mice). b, d Representative PET/CT images of the head and torso (b) or legs (d) of six vehicle- and five insulin-treated mice; some 18F-FDG uptake into skeletal muscle is evident in the image of the vehicle-treated mouse (d), possibly resulting from physical activity. c Gamma counts of 18F-FDG uptake in iWAT and gWAT of insulin- or vehicle-treated mice (n = 4 per group), shown as % injected dose per g tissue (% ID/g). e 18F-FDG uptake in the indicated tissues of mice treated with vehicle (n = 6) or insulin (n = 5) was determined from PET/CT scans. f BMAT in humeri (n = 6), femurs (n = 5) or tibiae (n = 7) was analysed by osmium tetroxide staining. BMAT is shown in red in representative µCT reconstructions and quantified as adipose volume relative to total BM volume (Ad.V/Ma.V). Data in a, c, e, f are presented as mean ± SEM. Significant differences between control and insulin-treated samples are indicated by *P < 0.05, **P < 0.01 or ***P < 0.001 and were assessed as follows: a repeated measures two-way ANOVA with Sidak’s multiple comparisons test; c two-tailed unpaired t test with Holm–Sidak adjustment for multiple comparisons; e two-tailed Mann–Whitney test for tissues with non-normally distributed SUVs (heart, humerus bone, femur bone, femur BM and dTibia BM) and two-tailed unpaired t test for tissues with normally distributed SUVs (all other tissues). In f, significant differences were assessed by one-way ANOVA with Tukey’s test for multiple comparisons. Groups in f do not significantly differ (P > 0.05) if they share the same letter. Source data are provided as a Source Data file.
Fig. 4
Fig. 4. BMAT resists insulin-stimulated Akt T308 phosphorylation.
Male Sprague–Dawley rats at 13- to 15-weeks of age were fasted overnight prior to intra-peritoneal injection of saline (n = 4) or 0.75 U/kg insulin (n = 4). Tissues were isolated 15 min post-injection and total protein isolated as described in the “Methods”. a Expression of the indicated proteins was determined by immunoblotting, with ERK1/2 and α-Tubulin used as loading controls. b Quantification of protein expression from (a). Expression of Akt P-S473 and Akt P-T308 was normalised to total Akt. Expression of total Akt was normalised to the average of ERK1/2 and α-Tubulin. Data are presented relative to gWAT of vehicle-treated rats as mean ± SEM. For each protein readout the influence of treatment or tissue, and interactions between these, was determined by two-way ANOVA, with p values shown beneath the graph. Significant effects of treatment (within each tissue) or tissue (within each treatment) were further assessed by multiple comparisons and are indicated as follows: insulin vs vehicle, *P < 0.05), **P < 0.01; gWAT vs. dBMAT, #P < 0.05) or ##P < 0.01. Source data and full scans of immunoblots are provided as a Source Data file.
Fig. 5
Fig. 5. Cold exposure does not induce glucose uptake or beiging in BMAT.
Cold-induced glucose uptake was assessed by PET/CT, as described in Supplementary Fig. 3A. a PET/CT images representative of 7 control, 7 acute and 8 chronic cold mice show increased 18F-FDG uptake in interscapular and paraspinal BAT but not in tibiae; some 18F-FDG signal is evident in skeletal muscle of each group. b, c 18F-FDG uptake in the indicated tissues was determined by PMOD analysis of PET/CT scans (b) or gamma counting (c). d Representative micrographs of H&E-stained tissues, showing that cold exposure decreases lipid content in BAT and promotes beiging of iWAT, but these effects do not occur in BMAT; scale bar = 150 µm. eg Effects of cold exposure on expression of transcripts relating to brown and beige adipocyte function (Ucp1 and Dio2) and fatty acid oxidation (Cpt1b and Ppara) in BAT, iWAT and whole bones. ND not detectable. Data in b, c, eg are shown as mean ± SEM of the following numbers of mice per group: Control, n = 7 (b, c, e, g) or 6 (f); acute cold, n = 7 (b, e), 8 (c, g) or 6 (f); chronic cold, n = 8 (b, c, g) or 7 (e, f). Within each tissue, significant differences between groups are indicated by #P < 0.01, *P < 0.05, **P < 0.01 or ***P < 0.001. The following groups of data are non-normally distributed and were assessed using the Kruskal–Wallis test with Dunn’s test for multiple comparisons: b Heart, Sk. Muscle and Femur bone; c iWAT and gWAT; e Dio2; f Dio2 and Cpt1b; g Dio2 and Ppara. Data for all other tissues (b, c) or transcripts (eg) are normally distributed and were assessed using one-way ANOVA with Dunnet’s or Tukey’s tests for multiple comparisons. Source data are provided as a Source Data file. See also Supplementary Figs. 3–5.
Fig. 6
Fig. 6. CT-based identification of BMAT in humans.
a Representative MRI (HASTE) and CT images from one subject. b HU distribution of scWAT, BMAT-rich BM (sternum) and BMAT-deficient BM (vertebrae). Data are mean ± SEM (n = 33). Thresholds diagnostic for BMAT (<115) and RM (115–300) are indicated by dashed lines. c ROC analysis to identify HU thresholds to distinguish BMAT-rich (sternum) from BMAT-deficient (vertebrae) regions of BM. d CT images of a 32-year-old subject, highlighting BMAT or RM identified using the diagnostic thresholds in (b); tibiae are shown for completeness but were not present in any other available CT scans. e Quantification of BMAT in CT scans of male and female subjects aged <60 or >60 years. A HU threshold of <115 was used to identify BMAT voxels in BM of the indicated bones, and total BM volume was also determined. The proportion of the BM cavity corresponding to BMAT (Ad.V/Ma.V) was then calculated. Data are shown as box-and-whisker plots of the following numbers of subjects for each group: <60 years, n = 28 (humerus), 9 (femur) or 27 (clavicle, sternum and vertebrae); >60 years, n = 7 for each bone; boxes indicate the 25th and 75th percentiles; whiskers display the range; and horizontal lines in each box represent the median. Significant differences between <60 and >60 groups are indicated by ***P < 0.001 and were assessed using a two-tailed Welch’s t test for normally distributed data (Sternum) and a two-tailed Mann–Whitney test for non-normally distributed data (Femur, Humerus, Clavicle and Vertebrae). Source data are provided as a Source Data file.
Fig. 7
Fig. 7. Human BMAT is functionally distinct from BAT and is a major site of basal glucose uptake.
a Coronal PET/CT images (left side) and BMAT-thresholded CT images (right side) representative of 8 No BAT, 7 Active BAT and 7 Cold subjects. 18F-FDG uptake in BAT is evident in the Active BAT and Cold subjects (arrows). Femurs were not covered by the scans of the Cold group. bd PET/CT analysis of 18F-FDG uptake in the indicated tissues of No BAT, Active BAT and cold-exposed subjects. e, f 18F-FDG uptake in bone tissue, RM and BMAT (e), or BMAT, scWAT and skeletal muscle (Sk. muscle) (f) of room-temperature subjects (No BAT and Active BAT groups). Data in bd are mean ± SEM of 8 (No BAT) or 7 (Active BAT, Cold) subjects per group and were analysed by paired two-way ANOVA. Data in (ef) are shown as paired individual values (e) or box-and-whisker plots (f) from 15 (Femur, Humerus, Sternum, Sk. Muscle and scWAT), 14 (Clavicle) or 13 (Vertebrae) subjects in the No BAT and Active BAT groups and were analysed by paired one-way ANOVA. In f, boxes indicate the 25th and 75th percentiles; whiskers display the range; and horizontal lines in each box represent the median. For be, significant differences between bone, RM and BMAT are indicated by *P < 0.05, **P < 0.01 or ***P < 0.001. Significant differences between No BAT, Active BAT and Cold groups are indicated by #P < 0.05 or ###P < 0.001. For f, tissues that do not share a common letter have significantly different SUVs. Source data are provided as a Source Data file. See also Supplementary Fig. 6.

Comment in

References

    1. Cinti S. Adipose organ development and remodeling. Compr. Physiol. 2018;8:1357–1431. - PubMed
    1. Cawthorn WP, et al. Bone marrow adipose tissue is an endocrine organ that contributes to increased circulating adiponectin during caloric restriction. Cell Metab. 2014;20:368–375. - PMC - PubMed
    1. Scheller EL, Cawthorn WP, Burr AA, Horowitz MC, MacDougald OA. Marrow adipose tissue: trimming the fat. Trends Endocrinol. Metab. 2016;27:392–403. - PMC - PubMed
    1. Qiang G, et al. Lipodystrophy and severe metabolic dysfunction in mice with adipose tissue-specific insulin receptor ablation. Mol. Metabol. 2016;5:480–490. - PMC - PubMed
    1. Sakaguchi M, et al. Adipocyte dynamics and reversible metabolic syndrome in mice with an inducible adipocyte-specific deletion of the insulin receptor. Cell Metab. 2017;25:448–462. - PMC - PubMed

Publication types