. 2020 Jun 17;10(1):9775.
doi: 10.1038/s41598-020-66224-1.

Genomic deregulation of PRMT5 supports growth and stress tolerance in chronic lymphocytic leukemia

Affiliations

Genomic deregulation of PRMT5 supports growth and stress tolerance in chronic lymphocytic leukemia

Ann-Kathrin Schnormeier et al. Sci Rep. .

Abstract

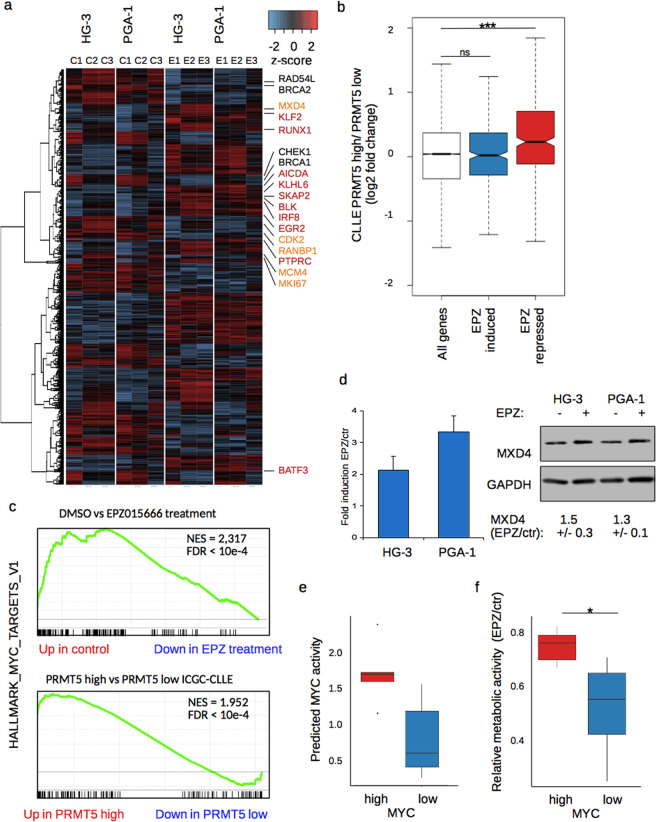
Patients suffering from chronic lymphocytic leukemia (CLL) display highly diverse clinical courses ranging from indolent cases to aggressive disease, with genetic and epigenetic features resembling this diversity. Here, we developed a comprehensive approach combining a variety of molecular and clinical data to pinpoint translocation events disrupting long-range chromatin interactions and causing cancer-relevant transcriptional deregulation. Thereby, we discovered a B cell specific cis-regulatory element restricting the expression of genes in the associated locus, including PRMT5 and DAD1, two factors with oncogenic potential. Experimental PRMT5 inhibition identified transcriptional programs similar to those in patients with differences in PRMT5 abundance, especially MYC-driven and stress response pathways. In turn, such inhibition impairs factors involved in DNA repair, sensitizing cells for apoptosis. Moreover, we show that artificial deletion of the regulatory element from its endogenous context resulted in upregulation of corresponding genes, including PRMT5. Furthermore, such disruption renders PRMT5 transcription vulnerable to additional stimuli and subsequently alters the expression of downstream PRMT5 targets. These studies provide a mechanism of PRMT5 deregulation in CLL and the molecular dependencies identified might have therapeutic implementations.


Conflict of interest statement

The authors declare no competing interests.

Figures

Figure 1
Figure 1
PRMT5 and DAD1 as candidate cancer-genes deregulated through SV in CLL. (a) Workflow to identify genomic breakage-caused aberrant cancer-gene expression (SV: structural variations; PrHi-C: Promoter-HiC; IQR: Interquartile range; OS: Overall survival). (b) Schematic representation of the locus on chr14 harboring DAD1 and PRMT5 with a disrupted cis-regulatory region and its epigenetic make-up in HG-3 cells. Below the genomic coordinates, genomic breakpoints from donors of the ICGC-CLLE cohort are depicted, followed by promoter-interactions (PrHi-C) of the indicated genes derived from total B cells within the IHEC (interactions in grey, anchor-regions in lightblue, heights correspond to published score). CUT&RUN tracks of CTCF (grey), H3K4me3 (red), H3K27ac (blue) and H3K27me3 (green) derived from HG-3 cells are shown below the gene annotation track. (c) Expression of DAD1 and PRMT5 in CLL donors of the ICGC-CLLE cohort for which breakpoint- and transcriptional data were available (donors with a breakpoint upstream of DAD1 in red, other donors in blue). (d) Kaplan-Meier plots of overall survival for donors from the ICGC-CLLE and Herold et al., which were grouped based on their expression of PRMT5 or DAD1 (padj: Benjamini-Hochberg corrected p-value). (e) Protein abundance of PRMT5 and DAD1 in cell lines derived from CLL. GAPDH served as loading control, below the blot median protein abundance relative to control from three biological replicates including standard deviation is indicated. (f) Inhibition of metabolic activity upon PRMT5 inhibition. CLL derived cell lines were treated for 96 h with increasing concentrations of the PRMT5 inhibitor EPZ015666 (EPZ), followed by MTT assay (Error bar represents SD of three independent experiments).
Figure 2
Figure 2
PRMT5 supports growth promoting pathways in vitro and in vivo. (a) Heatmap showing up- and downregulated genes of three replicates of RNA-seq per cell line, calculated by DESeq. 2 (padj < 0.05, logFC > |0.6|). C1-3 represent untreated control replicates, E1-3 those treated with 10 µM EPZ015666 for 96 h. Highlighted are genes involved in B cell and lymphocyte specific pathways (red), cell cycle progression (orange) and checkpoint control (black). b) Correlation between transcriptional changes of EPZ015666 treated cells and donors from the CLLE cohort. Boxplot depicts log2 fold change in expression between PRMT5 high versus PRMT5 low donors, for all genes (white), genes induced (blue) or repressed (red) upon EPZ015666-treatment, respectively. Statistical testing by Mann-Whitney-U test (***p < 10-12). (c) GSEA for control versus EPZ015666 treated HG-3 and PGA-1 cells (upper panel) and for PRMT5 high versus PRMT5 low CLL donors (lower panel) shows a downregulation of hallmark MYC target V1 gene set. (d) Upregulation of MXD4 upon treatment of HG-3 and PGA-1 cells with EPZ015666, shown at the mRNA-level (left) and protein (right), GAPDH served as loading control. Below the blot the median fold change of treated over control of protein abundance was calculated including the SD from three independent experiments. (e) Boxplot shows the transcriptional activity of MYC in the MYC high and MYC low cell line groups, estimated via DoRothEA v2. (f) Metabolic activity upon PRMT5 inhibition in the two cell line groups with high or low MYC activity as determined by MTT (statistical testing by student’s paired T-test; *p < 0.01).
Figure 3
Figure 3
PRMT5 inhibition impairs stress response pathways and sensitizes cells to PARP inhibitors. (a) Reactome pathway analysis of the expression changing genes common to both cell lines. Emapplot showing top 15 categories of enrichment, with dot-size representing number of genes in the category and color representing adjusted p-value. (b) Ingenuity Pathway Analysis (IPA) depicts enriched or depleted pathways in differential expression data between control and EPZ015666-treated cells (pval < 0.05 and z-score > |1|). (c) Western blot for BRCA1 in control and EPZ015666-treated cells (left panel). Tubulin served as loading control. Quantification of BCRA1 abundance in control and EPZ015666-treated cells relative to tubulin with error bars representing SD from three biological replicates (right panel). (d) IncuCyte Caspase-3/7 assay depicts representative pictures showing the induction of apoptosis in HG-3 cells treated as indicated after 0 and 48 h (left panel). Right panel shows summary graphs of the induction of apoptosis over time and with the indicated treatments (error bars represent SD from three biological replicates).
Figure 4
Figure 4
Deregulation of PRMT5 by loss of its regulatory region. (a) Below the genomic coordinates, genomic breakpoints from donors of the ICGC-CLLE cohort are depicted, followed by promoter-interactions (PrHi-C) of the indicated genes. Red box indicates regulatory region excised with CRISPR/cas9. (b) Normalized PRMT5 mRNA expression analyzed by RT-qPCR of PGA-1 clones with a CRISPR/cas9 engineered deletion of the upstream regulatory region and compared to PGA-1 control for which cells were transduced with a construct lacking the guideRNA (error bars represent SD from three biological replicates). (c) Western blot for PRMT5 in the same PGA-1 clones lacking the upstream regulatory region. GAPDH served as loading control and was used to normalize PRMT5 level. Below the blot levels of normalized PRMT5 compared to the control PGA-1 clone are shown (SD derived from three biological replicates). (d) Growth rates of the PGA-1 clones and control cells measured by IncuCyte live cell imaging for a total of 96 h (confluence was measured; error bars resemble SD from three biological experiments, each performed in triplicate). (e) Cells from the PGA-1 control or the respective clones were treated with 1 µM SAHA or 5 µM JQ1 for 48 h or 50 nM Chaetocin for 24 h prior to the analysis of PRMT5 mRNA via RT-qPCR. Shown is normalized expression (error bars resemble SD from three biological replicates and statistical testing by student’s paired T-test; *p < 0.05; **p < 0.005; ***p < 0.001).
Figure 5
Figure 5
Downstream transcriptional changes after PRMT5 deregulation. (a) Below the genomic coordinates and the gene-structure of KLF2, RNA-seq tracks control (blue) and EPZ015666 treated (red) cells are displayed. (b) Similar display for BATF3, tracks as displayed in (a). (c,d) Normalized expression levels assessed by RT-qPCR from PGA-1 clones transduced with a non-guideRNA control or the regulatory deletion clones for the indicated genes previously found activated by PRMT5 inhibition (c), or for genes with impaired expression after PRMT5 inhibition (d) (error bars represent SD from three biological replicates). (e,f) Normalized expression from donors of the CLLE cohort with either PRMT5 high (red) or low (blue) PRMT5 levels for genes induced after PRMT5 inhibition (e) or genes with impaired expression upon EPZ015666 treatment (f). Statistical testing by Mann-Whitney-U test; *p < 0.01; **p < 10-6.

Similar articles

Cited by

References

    1. Fabbri G, Dalla-Favera R. The molecular pathogenesis of chronic lymphocytic leukaemia. Nat. Rev Cancer. 2016;16:145–162. doi: 10.1038/nrc.2016.8. - DOI - PubMed
    1. Herold T, et al. An eight-gene expression signature for the prediction of survival and time to treatment in chronic lymphocytic leukemia. Leukemia. 2011;25:1639–1645. doi: 10.1038/leu.2011.125. - DOI - PubMed
    1. Byrd JC, et al. Targeting BTK with ibrutinib in relapsed chronic lymphocytic leukemia. N. Engl. J. Med. 2013;369:32–42. doi: 10.1056/NEJMoa1215637. - DOI - PMC - PubMed
    1. Furman RR, et al. Idelalisib and rituximab in relapsed chronic lymphocytic leukemia. N. Engl. J. Med. 2014;370:997–1007. doi: 10.1056/NEJMoa1315226. - DOI - PMC - PubMed
    1. Kipps TJ, et al. Chronic lymphocytic leukaemia. Nat Rev Dis Primers. 2017;3:16096. doi: 10.1038/nrdp.2016.96. - DOI - PMC - PubMed

MeSH terms