

A Transcriptome Analysis Reveals that Hepatic Glycolysis and Lipid Synthesis Are Negatively Associated with Feed Efficiency in DLY Pigs
- PMID: 32555275
- PMCID: PMC7303214
- DOI: 10.1038/s41598-020-66988-6
A Transcriptome Analysis Reveals that Hepatic Glycolysis and Lipid Synthesis Are Negatively Associated with Feed Efficiency in DLY Pigs
Abstract
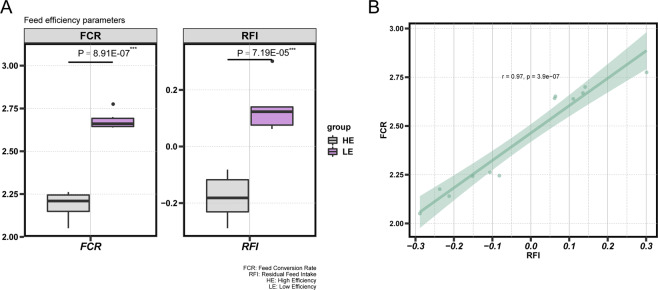
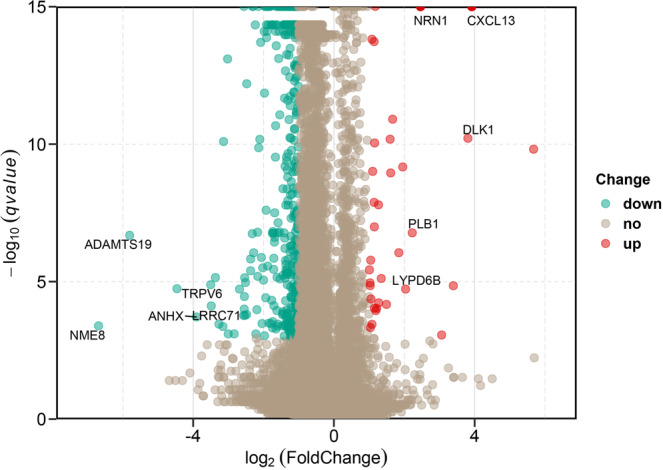
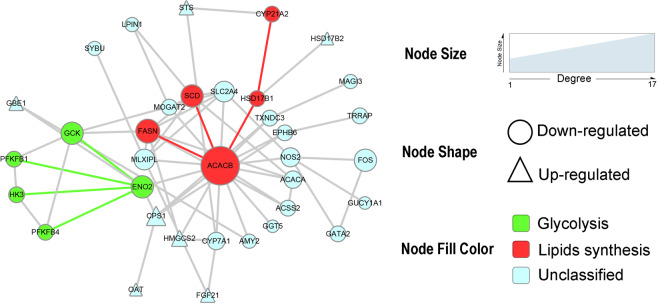
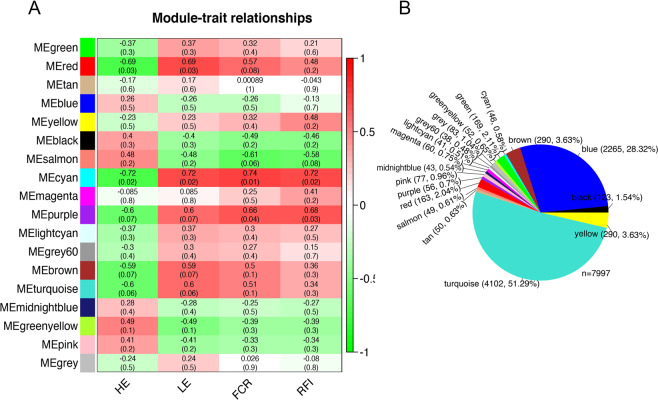
Feed efficiency (FE) is an important trait in the porcine industry. Therefore, understanding the molecular mechanisms of FE is vital for the improvement of this trait. In this study, 6 extreme high-FE and 6 low-FE pigs were selected from 225 Duroc × (Landrace × Yorkshire) (DLY) pigs for transcriptomic analysis. RNA-seq analysis was performed to determine differentially expressed genes (DEGs) in the liver tissues of the 12 individuals, and 507 DEGs were identified between high-FE pigs (HE- group) and low-FE pigs (LE- group). A gene ontology (GO) enrichment and pathway enrichment analysis were performed and revealed that glycolytic metabolism and lipid synthesis-related pathways were significantly enriched within DEGs; all of these DEGs were downregulated in the HE- group. Moreover, Weighted gene co-expression analysis (WGCNA) revealed that oxidative phosphorylation, thermogenesis, and energy metabolism-related pathways were negatively related to HE- group, which might result in lower energy consumption in higher efficiency pigs. These results implied that the higher FE in the HE- group may be attributed to a lower glycolytic, energy consumption and lipid synthesizing potential in the liver. Furthermore, our findings suggested that the inhibition of lipid synthesis and glucose metabolic activity in the liver may be strategies for improving the FE of DLY pigs.
Conflict of interest statement
The authors declare no competing interests.
Figures
Similar articles
-
Brain Transcriptome Analysis Reveals Potential Transcription Factors and Biological Pathways Associated with Feed Efficiency in Commercial DLY Pigs.DNA Cell Biol. 2021 Feb;40(2):272-282. doi: 10.1089/dna.2020.6071. Epub 2020 Dec 9. DNA Cell Biol. 2021. PMID: 33297854
-
A Transcriptome Analysis Identifies Biological Pathways and Candidate Genes for Feed Efficiency in DLY Pigs.Genes (Basel). 2019 Sep 18;10(9):725. doi: 10.3390/genes10090725. Genes (Basel). 2019. PMID: 31540540 Free PMC article.
-
Post-weaning blood transcriptomic differences between Yorkshire pigs divergently selected for residual feed intake.BMC Genomics. 2016 Jan 22;17:73. doi: 10.1186/s12864-016-2395-x. BMC Genomics. 2016. PMID: 26801403 Free PMC article.
-
RNA-seq of muscle from pigs divergent in feed efficiency and product quality identifies differences in immune response, growth, and macronutrient and connective tissue metabolism.BMC Genomics. 2018 Nov 1;19(1):791. doi: 10.1186/s12864-018-5175-y. BMC Genomics. 2018. PMID: 30384851 Free PMC article.
-
Proteomic analysis indicates that mitochondrial energy metabolism in skeletal muscle tissue is negatively correlated with feed efficiency in pigs.Sci Rep. 2017 Mar 27;7:45291. doi: 10.1038/srep45291. Sci Rep. 2017. PMID: 28345649 Free PMC article.
Cited by
-
Characterization of feed efficiency-related key signatures molecular in different cattle breeds.PLoS One. 2023 Sep 27;18(9):e0289939. doi: 10.1371/journal.pone.0289939. eCollection 2023. PLoS One. 2023. PMID: 37756351 Free PMC article.
-
Transcriptome analysis of liver and ileum reveals potential regulation of long non-coding RNA in pigs with divergent feed efficiency.Anim Biosci. 2025 Apr;38(4):588-599. doi: 10.5713/ab.24.0434. Epub 2024 Oct 25. Anim Biosci. 2025. PMID: 39483020 Free PMC article.
-
Transcriptome analysis reveals the potential roles of long non-coding RNAs in feed efficiency of chicken.Sci Rep. 2022 Feb 15;12(1):2558. doi: 10.1038/s41598-022-06528-6. Sci Rep. 2022. PMID: 35169237 Free PMC article.
-
Analysis of merged transcriptomic and genomic datasets to identify genes and pathways underlying residual feed intake in growing pigs.Sci Rep. 2022 Dec 19;12(1):21946. doi: 10.1038/s41598-022-26496-1. Sci Rep. 2022. PMID: 36536008 Free PMC article.
-
Characterization and Duodenal Transcriptome Analysis of Chinese Beef Cattle With Divergent Feed Efficiency Using RNA-Seq.Front Genet. 2021 Oct 5;12:741878. doi: 10.3389/fgene.2021.741878. eCollection 2021. Front Genet. 2021. PMID: 34675965 Free PMC article.
References
-
- Teagasc. Pig Herd Performance Report 2018. Foster City, CA: Teagasc Pig Development Department. https://www.teagasc.ie/publications/2019/national-pig-herd-performance-r... (2018).
-
- Koch RM, Swiger LA, Chambers D, Gregory KE. Efficiency of Feed Use in Beef Cattle. Journal of Animal Science. 1963;22:486–494. doi: 10.2527/jas1963.222486x. - DOI
Publication types
MeSH terms
LinkOut - more resources
Full Text Sources
