. 2020 Jun 17;10(1):9832.
doi: 10.1038/s41598-020-66785-1.

Simulating the human colorectal cancer microenvironment in 3D tumor-stroma co-cultures in vitro and in vivo

Affiliations

Simulating the human colorectal cancer microenvironment in 3D tumor-stroma co-cultures in vitro and in vivo

Mahesh Devarasetty et al. Sci Rep. .

Abstract

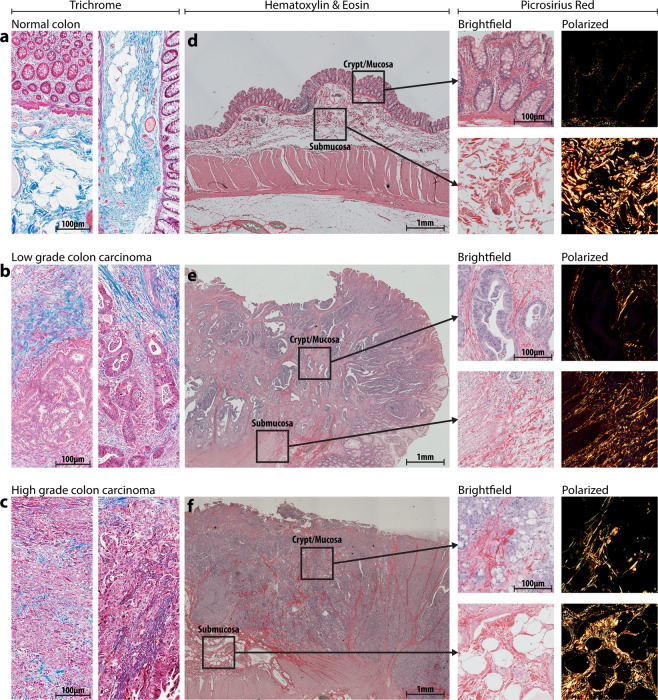
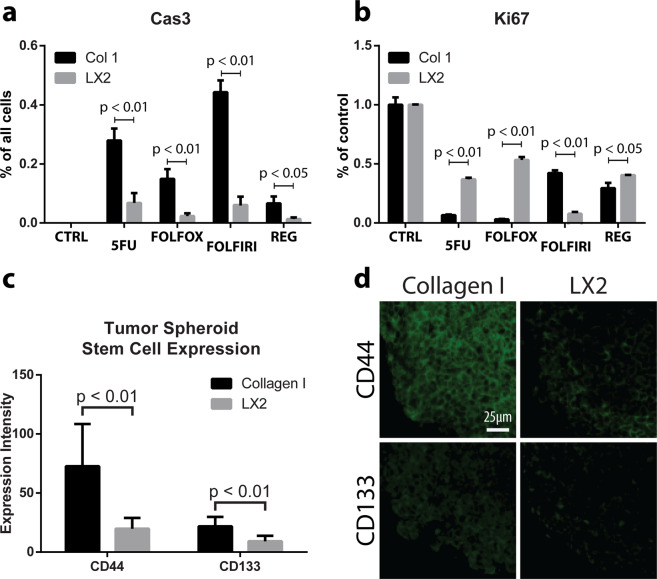
The tumor microenvironment (TME) plays a significant role in cancer progression and thus modeling it will advance our understanding of cancer growth dynamics and response to therapies. Most in vitro models are not exposed to intact body physiology, and at the same time, fail to recapitulate the extensive features of the tumor stroma. Conversely, animal models do not accurately capture the human tumor architecture. We address these deficiencies with biofabricated colorectal cancer (CRC) tissue equivalents, which are built to replicate architectural features of biopsied CRC tissue. Our data shows that tumor-stroma co-cultures consisting of aligned extracellular matrix (ECM) fibers and ordered micro-architecture induced an epithelial phenotype in CRC cells while disordered ECM drove a mesenchymal phenotype, similar to well and poorly differentiated tumors, respectively. Importantly, co-cultures studied in vitro, and upon implantation in mice, revealed similar tumor growth dynamics and retention of architectural features for 28 days. Altogether, these results are the first demonstration of replicating human tumor ECM architecture in ex vivo and in vivo cultures.


Conflict of interest statement

The authors declare no competing interests.

Figures

Figure 1
Figure 1
Clinical colorectal cancer sample morphology, collagen structure, and compartments. Clinical samples of varied grade, as indicated, were obtained initially stained with Masson’s Trichrome (a–c) to visualize collagen (blue signal) structure, density, and localization. H&E staining and imaging was used to qualitatively separate the tissue into mucosal and submucosal compartments (d–f). Then, PRS staining was performed and imaged to isolate collagen fibers specifically.
Figure 2
Figure 2
Microarchitecture of clinical samples. Regions of interest (ROIs) from the crypt and submucosal compartments of clinical samples of varying grade (n > 10 ROIs from n = 4 individual samples for each condition), as indicated, were PRS stained and imaged under polarized light (a,c). Fiber architecture was analyzed with segmentation software (CT-FIRE) to generate distributions of fiber angle, width, and length (b,d). Graphs of fiber hue represent mean + s.e.m. of experiments performed in triplicate (three imaging fields from each patient). Graphs of fiber angle, length, and width are box and whisker plots with Tukey formatting of pooled fibers from four regions of interest from each patient, representing 500–4000 fibers in total; individually drawn points lie beyond 1.5 * inter-quartile range of the plot.
Figure 3
Figure 3
Construct extracellular matrix (ECM) organization in vitro and in vivo. Collagen fiber microarchitecture in collagen-only constructs and LX2 co-cultures, in vitro and in vivo, as indicated, was visualized with PRS (a). Fiber bundling was quantified through signal hue analysis (b): green and yellow signal indicate less bundled fibers and orange and red signal indicate more bundling. Collagen fibers were quantified with segmentation software (CT-FIRE). Distributions of angle (c), length (d), and width (e) of fibers were obtained from samples in vitro and in vivo. Graphs of fiber hue represent mean + s.e.m. of experiments performed in triplicate. Graphs of fiber angle, length, and width are box and whisker plots with Tukey formatting of pooled fibers from experiments performed in quadruplicate or greater; individually drawn points lie beyond 1.5 * inter-quartile range of the plot.
Figure 4
Figure 4
Tumor construct morphology and growth in vitro and in vivo. Tumor spheroid morphology was visualized on days 7 and 28 in vitro (a) and in vivo (b) in both collagen-only constructs and LX2 co-cultures, as indicated. Integration of vasculature was also observed at day 28 of in vivo implanted samples (insets f–i). Spheroid diameter was tracked over time in vitro (c), and in vivo implanted samples were measured at the time of explantation for average diameter (d). Examples of gross implant size in vivo can be seen in insets j, k. Implant retrieval data for the in vivo studies (e). Graphs represent mean + s.e.m. of experiments performed in triplicate.
Figure 5
Figure 5
Immunophenotyping of tumor cells within fabricated constructs and clinical sample. Samples from constructs cultured in vitro, constructs implanted in vivo, and clinical CRC biopsies of varying grade were immune-stained for markers related to EMT and oncogenesis, as indicated. Staining results were analyzed using Visiopharm and graphed as the proportion of cancer cells with: (a) nuclear localization of Ki67; (b) with fully intact, membrane localized E-Cadherin expression; (c) with N-Cadherin expression; (d) with nuclear localization of β-Catenin. (e) Ratio of total area corresponding to positive FAK expression in tumor spheroid and clinical CRC biopsies of varying grade. Graphs represent mean + s.e.m. of three regions of interest from each sample of experiments performed in triplicate.
Figure 6
Figure 6
Chemotherapeutic sensitivity and expression of cancer stem cell markers in CRC constructs. Collagen-only constructs and LX2 co-cultures, as indicated, were exposed to various chemotherapeutics for 72 hours, and the expression of Caspase3 (measured as percent of all cells) (a) and Ki67 (measured as percent of control) was analyzed (b). CD44 and CD133 expression was quantified in collagen-only construct and LX2 co-culture samples, as indicated, (c) using IHC (d). Graphs represent mean + s.e.m. of three regions of interest from each sample of experiments performed in triplicate or greater.

References

    1. Catalano V, et al. Tumor and its microenvironment: a synergistic interplay. Seminars in cancer biology. 2013;23:522–532. doi: 10.1016/j.semcancer.2013.08.007. - DOI - PubMed
    1. Hanahan D, Coussens LM. Accessories to the crime: functions of cells recruited to the tumor microenvironment. Cancer cell. 2012;21:309–322. doi: 10.1016/j.ccr.2012.02.022. - DOI - PubMed
    1. Pietras K, Östman A. Hallmarks of cancer: Interactions with the tumor stroma. Experimental Cell Research. 2010;316:1324–1331. doi: 10.1016/j.yexcr.2010.02.045. - DOI - PubMed
    1. Khoo CY, Chai X, Quek R, Teo MCC, Goh BKP. Systematic review of current prognostication systems for primary gastrointestinal stromal tumors. European journal of surgical oncology: the journal of the European Society of Surgical Oncology and the British Association of Surgical Oncology. 2018;44:388–394. doi: 10.1016/j.ejso.2017.12.006. - DOI - PubMed
    1. Carreras-Torras C, Gay-Escoda C. Techniques for early diagnosis of oral squamous cell carcinoma: Systematic review. Med Oral Patol Oral Cir Bucal. 2015;20:e305–e315. doi: 10.4317/medoral.20347. - DOI - PMC - PubMed

Publication types