. 2020 Dec;34(12):3323-3337.
doi: 10.1038/s41375-020-0901-2. Epub 2020 Jun 19.

S100A6 is a critical regulator of hematopoietic stem cells

Affiliations

S100A6 is a critical regulator of hematopoietic stem cells

Tan Hooi Min Grahn et al. Leukemia. 2020 Dec.

Erratum in

  • Correction: S100A6 is a critical regulator of hematopoietic stem cells.
    Grahn THM, Niroula A, Végvári Á, Oburoglu L, Pertesi M, Warsi S, Safi F, Miharada N, Capellera-Garcia S, Siva K, Liu Y, Rörby E, Nilsson B, Zubarev RA, Karlsson S. Grahn THM, et al. Leukemia. 2020 Dec;34(12):3439. doi: 10.1038/s41375-020-0971-1. Leukemia. 2020. PMID: 32665696 Free PMC article.

Abstract

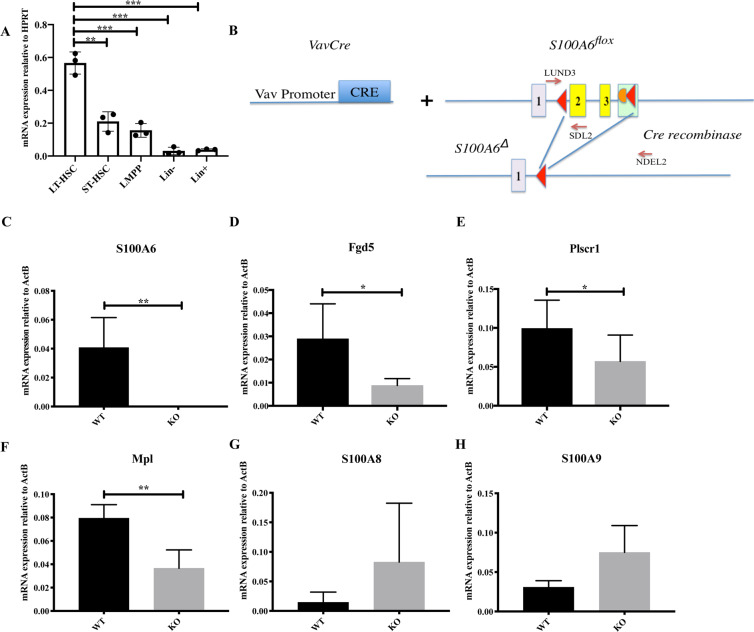
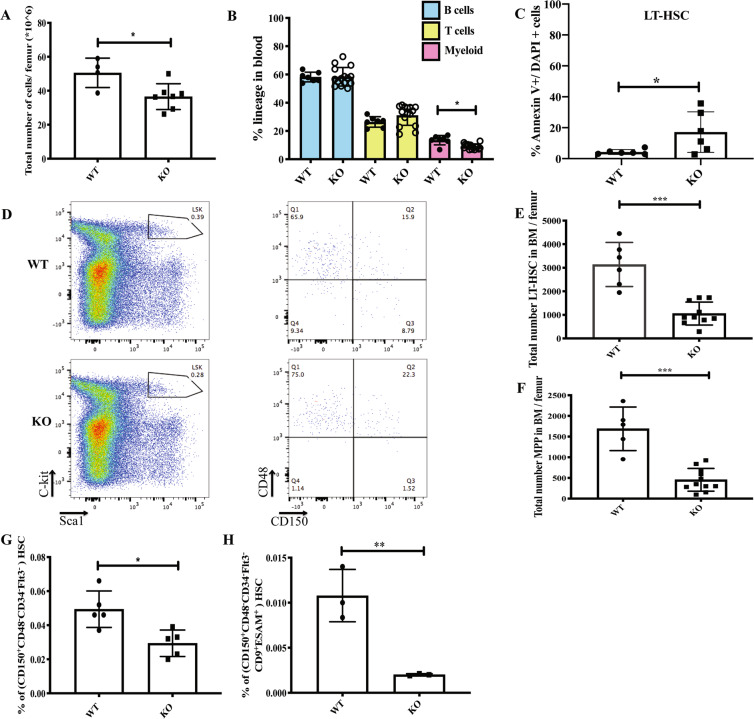
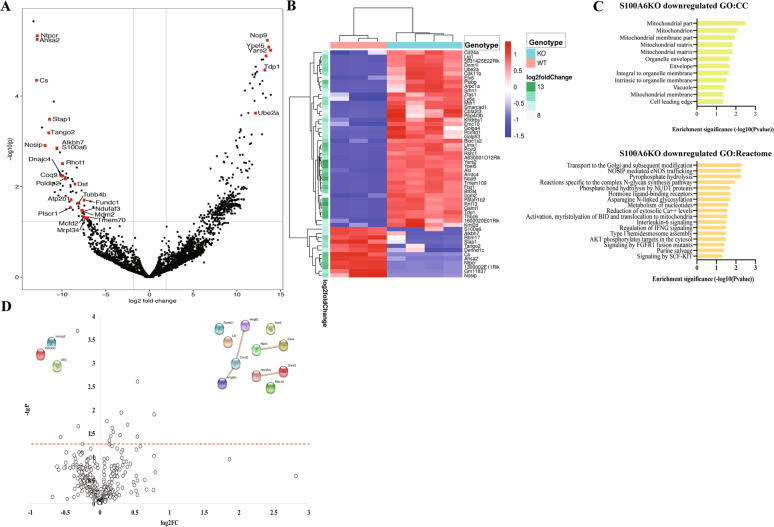
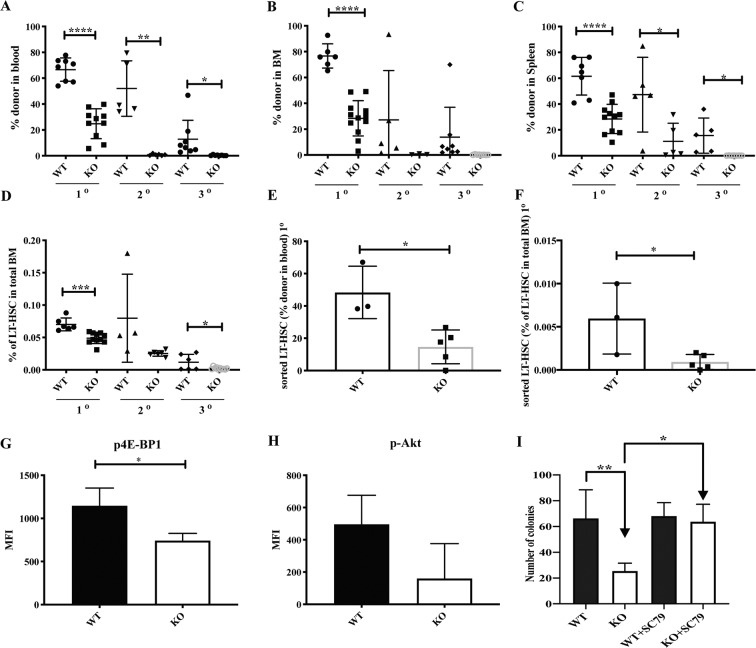
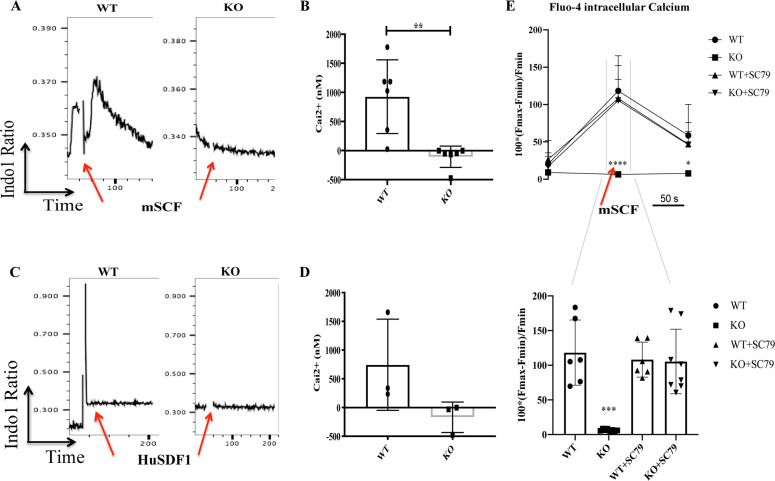
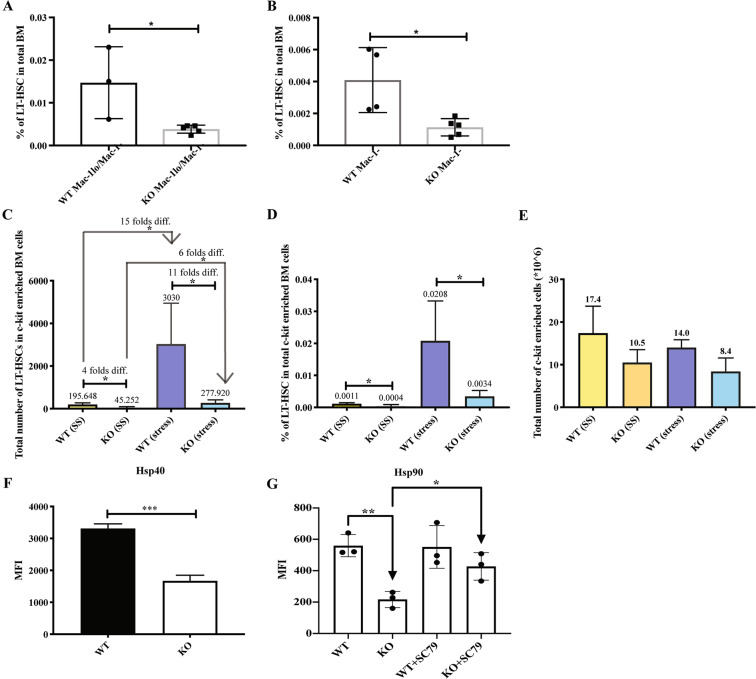
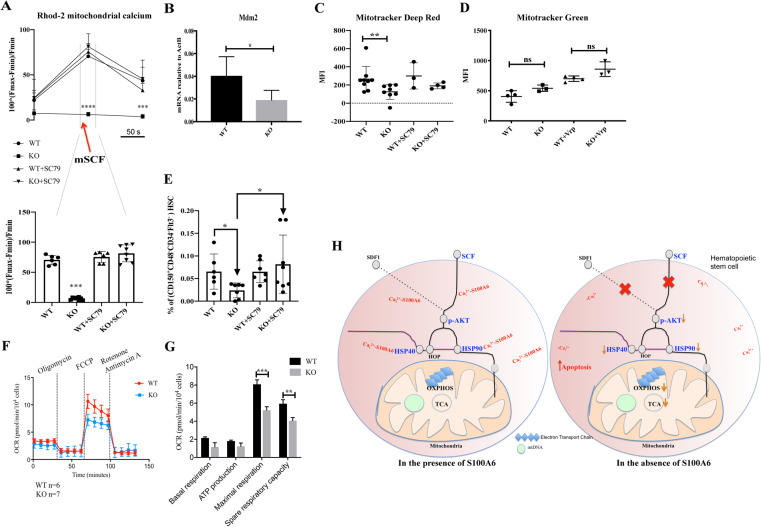
The fate options of hematopoietic stem cells (HSCs) include self-renewal, differentiation, migration, and apoptosis. HSCs self-renewal divisions in stem cells are required for rapid regeneration during tissue damage and stress, but how precisely intracellular calcium signals are regulated to maintain fate options in normal hematopoiesis is unclear. S100A6 knockout (KO) HSCs have reduced total cell numbers in the HSC compartment, decreased myeloid output, and increased apoptotic HSC numbers in steady state. S100A6KO HSCs had impaired self-renewal and regenerative capacity, not responding to 5-Fluorouracil. Our transcriptomic and proteomic profiling suggested that S100A6 is a critical HSC regulator. Intriguingly, S100A6KO HSCs showed decreased levels of phosphorylated Akt (p-Akt) and Hsp90, with an impairment of mitochondrial respiratory capacity and a reduction of mitochondrial calcium levels. We showed that S100A6 regulates intracellular and mitochondria calcium buffering of HSC upon cytokine stimulation and have demonstrated that Akt activator SC79 reverts the levels of intracellular and mitochondrial calcium in HSC. Hematopoietic colony-forming activity and the Hsp90 activity of S100A6KO are restored through activation of the Akt pathway. We show that p-Akt is the prime downstream mechanism of S100A6 in the regulation of HSC self-renewal by specifically governing mitochondrial metabolic function and Hsp90 protein quality.


Conflict of interest statement

The authors declare that they have no conflict of interest.

Figures

Fig. 1
Fig. 1. S100A6 is highly expressed in LT-HSCs and several stem-cell-specific transcripts are decreased in the absence of S100A6.
a Quantitative real-time PCR (qRT-PCR) analysis of S100a6 expression in long-term HSC (LT-HSCs; (lineageScal-1+ c-Kit+) LSK CD34Flt3), short-term HSC (ST-HSC; LSK CD34+Flt3), lymphoid-primed multipotent progenitors (LMPP; LSK CD34+Flt3+), lineage, and lineage+ cells. Each value is normalized to HPRT expression and mean ± SD of triplicates is shown (n = 3; *p < 0.05; **p < 0.001; ***p < 0.0001; analyzed by an unpaired two-sided t-test). b Schematic representation of Vav-Cre-mediated conversion of the S100a6flox allele into the S100a6Δ allele by deletion of DNA between the two loxP sites in the S100a6flox locus. This includes the entire S100a6 exons 2 and 3 (yellow). Exons 1–3 are indicated. Red triangles are loxP sites. Orange semisphere is FRT site from excised neo cassette (green rectangular). Cre recombinase cleaved at loxP sites. c S100a6 mRNA expression in BM HSCs (CD150+, CD48, Flt3, CD34) (n = 4). mRNA levels of Fgd5 (n = 4) (d), Plscr1 (n = 8) (e), Mpl (n = 4) (f), S100A8 (n = 4) (g), S100A9 (n = 3) (h), assessed by qRT-PCR on LT-HSCs (CD150+CD48CD34Flt). Results are the mean ± SD of triplicates. Each value is normalized to ActB expression (*p < 0.05; **p < 0.001; analyzed by an unpaired two-sided t-test).
Fig. 2
Fig. 2. S100A6-deficient mice display reduced steady-state hematopoietic stem and progenitor cells.
a Total number of whole bone marrow cells is reduced in S100A6KO mice. b Lineage distribution in steady-state peripheral blood. c S100A6KO HSCs have significant higher levels of apoptotic cells. d Schematic gating of LSK, CD150, CD48 HSPC compartment, in steady-state whole bone marrow cells. Representative FACS plots of LT-HSC (CD150+CD48) and multipotent progenitor (MPP, CD150CD48). S100A6KO had a robust reduction in the LT-HSC and MPP compartments compared with WT. e, f Histogram summarized total cells number within the LT-HSC and MPP in bone marrow. g C-kit-enriched FACS sorted bone marrow cells (LSK CD150+CD48CD34Flt3). h More stringent gating of FACS sorted c-kit-enriched bone marrow cells (LSK CD150+CD48 CD34Flt3ESAM+CD9Hi) (*p < 0.05; **p < 0.001; ***p < 0.0001; all data were analyzed by unpaired two-sided t-test and Mann–Whitney U test). All individual dots represent randomized biological replicates with matched littermates and experiments were repeated three times.
Fig. 3
Fig. 3. Gene expression analysis shows that S100A6 null HSCs have reduced transcripts of genes that regulate intracellular calcium, Akt signaling, and mitochondria aerobic activity; differential protein expression between S100A6WT and KO HSCs indicates reduction of Hsp90 protein.
a Volcano plot of RNA-seq showing log fold change and negative logarithm of p values between WT and S100A6-deficient LT-HSC (CD150+CD48CD34Flt). b Heatmap summarizing expression of 54 genes exhibiting differential expression between WT (pinkish-orange) and KO (light blue) at steady state. Samples are in the columns, genes in the rows, and the standardized expression levels are depicted by the color gradient: upregulated genes in red, downregulated genes in blue, adjusted p value < 0.2. c (above) Gene ontology enrichment analysis of cellular components for downregulated genes in S100A6-deficient samples. (Below) Gene ontology enrichment analysis of Reactome for downregulated genes in KO samples (accessed NetworkAnalyst 3.0). d Volcano plot of protein relative abundances between S100A6WT and KO at steady state. The X-axis shows the fold change in logarithmic scale. The Y-axis shows the log of the p value. Horizontal dashed line corresponds to p value = 0.05.
Fig. 4
Fig. 4. S100A6KO have impaired reconstitution ability of HSCs after transplantation and a decrease in progenitor cell activity, but Akt phosphorylation activator restores the numbers of colonies in vitro.
ac Whole bone marrow competitive transplantation assays (blood, bone marrow, and spleen at 16 weeks; primary (1°) (WT n = 8; KO n = 10); secondary (2°) (WT n = 5; KO n = 6); tertiary (3°) transplantation (WT n = 8; KO n = 8)). d Frequencies of LT-HSCs (LSK CD150+CD48) in 1°–3° recipients 16 weeks after whole bone marrow competitive transplants (n = similar as (ac)). e Reduced reconstitution of 50 sorted LT-HSCs in blood determined by CD45.1/45.2 at 16 weeks end point (WT n = 3; KO n = 5). f Frequencies of LT-HSCs (LSK CD150+CD48CD34Flt3ESAM+CD9Hi) in primary recipients 16 weeks end point after intravenous injection of 50 sorted LT-HSCs transplant (WT n = 3; KO n = 5) (*p < 0.05; **p < 0.001; *** or ****p < 0.0001; all data were examined by unpaired two-sided t-test and Mann–Whitney U test). g Intracellular staining of phosphorylated 4E-BP1 (Thr37/46) in S100A6WT and KO HSCs (CD150+CD48CD34Flt) (n = 3; *p < 0.05, analyzed by unpaired two-sided t-test). h Intracellular staining of phosphorylated Akt (Ser473) in HSCs (n = 3). i S100A6KO bone marrow cells exhibited reduced colony formation capacity in colony-forming unit (CFU) assays. Akt Activator, SC79, 2–8 μg/ml (Abcam) reverted colony-forming capacity in the KO (WT n = 4; KO n = 6; WT + SC79 n = 3; KO + SC79 n = 3). **p < 0.001, analyzed by Mann–Whitney U test comparing WT with KO. All data above represent mean values from three independent experiments ± SD.
Fig. 5
Fig. 5. S100A6 null HSCs failed to mobilize intracellular calcium flux upon stimulation and S100A6-calcium flux is p-Akt dependent.
Time gating before (first 100,000 cells were recorded) and immediately after addition of mSCF (a) or HuSDF-1 (c). The c-kit-enriched cells were exposed to mSCF (a) or HuSDF-1 (c) and the data show that only the HSC in the WT responded to both stimuli but not the S100A6 null cells as indicated by a change of the ratio between the violet (Ca2+ bound) and blue (free) fluorescence of Indo1. b, d Histograms show the changes in [Ca2+]i, cytoplasmic Ca2+ evoked by mSCF and HuSDF-1, respectively. Error bars represent SD in S100A6WT and KO c-kit-enriched bone marrow cells stained with Indo1 gated on CD150+CD48CD34Flt (b n = 6; d n = 3; *p < 0.05; Mann–Whitney U test). Experiments were repeated three times. e (above) The corresponding change in [Ca2+]i measured by Fluo-4 AM fluorescence intensity before, during and after the stimulation with mSCF over 50 s gated on CD150+CD48CD34Flt. (below) Trace the period of mSCF application and total samples that respond upon mSCF stimulation with or without SC79 (WT, WT + SC79 n = 6; KO, KO + SC79 n = 8); *** or ****p < 0.0001; analyzed by multiple t-test (above); Mann–Whitney U test (below), which are representative of three independent experiments.
Fig. 6
Fig. 6. The LT-HSCs in S100A6KO mice were unable to respond to 5FU chemotoxic stress and the chaperonin Hsp90 activity of S100A6KO was restored by Akt activator.
a Frequencies of LT-HSC (LSKMaclo/MacCD150+CD48) in total bone marrow 12 days after 5FU administration (WT n = 3, KO n = 5). b Frequencies of LT-HSC (LSKMacCD150+CD48) in total bone marrow 12 days after 5FU administration (WT n = 4, KO n = 5). c, d Frequencies and total number of cells from a stringent gating of LT-HSCs (LSKMacCD150+CD48ESAM+CD9Hi) in c-kit-enriched bone marrow cells 12 days after 5FU administration. Steady state (SS), stress introduced with 5FU administration (S) (SS (WT, KO) n = 4; S (WT, KO) n = 3). e Absolute numbers of total c-kit-enriched bone marrow cells 12 days after 5FU administration (SS (WT, KO) n = 4; S (WT, KO) n = 3) (*p < 0.05; **p < 0.001; *** or ****p < 0.0001; all data dissected by unpaired two-sided t-test and Mann–Whitney U test). f Intracellular staining of Hsp40 in LT-HSCs (n = 3). g Intracellular staining of Hsp90 in LT-HSCs. Akt activator, SC79 restored Hsp90 activity in the KO (f, g) (n = 3). Data represent mean values from independent experiments ± SD. *p < 0.05; **p < 0.001, gated on CD150+CD48CD34Flt, analyzed by unpaired two-sided t-test. The variance found inside values in a single group was smaller than the variance caused by interactions between different samples (one-way ANOVA, p = 0.006).
Fig. 7
Fig. 7. S100A6 regulates mitochondrial calcium levels and mitochondrial respiratory capacity; Akt activator SC79 molecule restores S100A6KO LT-HSC compartment.
a (above) The corresponding change measured by Rhod-2 AM fluorescence intensity in mitochondrial calcium before, during, and after the stimulation with mSCF over 50 s, gated on CD150+CD48CD34Flt. (below) Trace the period of mSCF application on Rhod-2 fluorescence and total samples that respond upon mSCF stimulation phase (WT, WT + SC79 n = 6; KO, KO + SC79 n = 8); *** or **** p < 0.0001; analyzed by multiple t-test (above); Mann–Whitney U test (below). b qRT-PCR analysis for Mdm2 mRNA expression and relative mRNA expression is normalized to ActB expression levels, and mean ± SD is shown (n = 6). Intracellular staining of Mitotracker deep red (c) and Mitotracker green (d) in S100A6WT and KO HSCs for 30 min and analyzed by flow cytometry gated on CD150+CD48CD34Flt. c SC79 added on c-kit-enriched cells for 20 min at room temperature, before Mitotracker deep red staining. e Frequency of S100A6KO LT-HSC (LSK CD150+CD48CD34Flt3) from total c-kit-enriched BM cells is restored after Akt activator SC79 treatment (*p < 0.05; analyzed by Mann–Whitney U test). f Oxygen consumption rate (OCR) trace was determined using a Seahorse XF96 Analyzer. g Maximum respiratory capacity and reserve respiratory capacity decreased in S100A6 null cells. *p < 0.05; * *p < 0.001; ***p < 0.000 as determined by multiple t-test. Bars represent mean ± SD (n = 7). h Summary of S100A6 regulation of mitochondria oxidative phosphorylation through Akt and Hsp90 interaction in mouse HSC. All data represent mean values from independent experiments ± SD. *p < 0.05, analyzed by unpaired t-test.

References

    1. Morrison SJ, Shah NM, Anderson DJ. Regulatory mechanisms in stem cell biology. Cell. 1997;88:287–98. - PubMed
    1. Daley GQ, Goodell MA, Snyder EY. Realistic prospects for stem cell therapeutics. Hematology Am Soc Hematol Educ Program. 2003;1:398–418. - PubMed
    1. Ito K, Suda T. Metabolic requirements for the maintenance of self-renewing stem cells. Nat Rev Mol Cell Biol. 2014;15:243–56. - PMC - PubMed
    1. Anso E, Weinberg SE, Diebold LP, Thompson BJ, Malinge S, Schumacker PT, et al. The mitochondrial respiratory chain is essential for haematopoietic stem cell function. Nat Cell Biol. 2017;19:614–25. - PMC - PubMed
    1. Vannini N, Girotra M, Naveiras O, Nikitin G, Campos V, Giger S, et al. Specification of haematopoietic stem cell fate via modulation of mitochondrial activity. Nat Commun. 2016;7:13125. - PMC - PubMed

Publication types