. 2020 Jun;582(7813):539-544.
doi: 10.1038/s41586-020-2397-3. Epub 2020 Jun 17.

Hidden neural states underlie canary song syntax

Affiliations

Hidden neural states underlie canary song syntax

Yarden Cohen et al. Nature. 2020 Jun.

Abstract

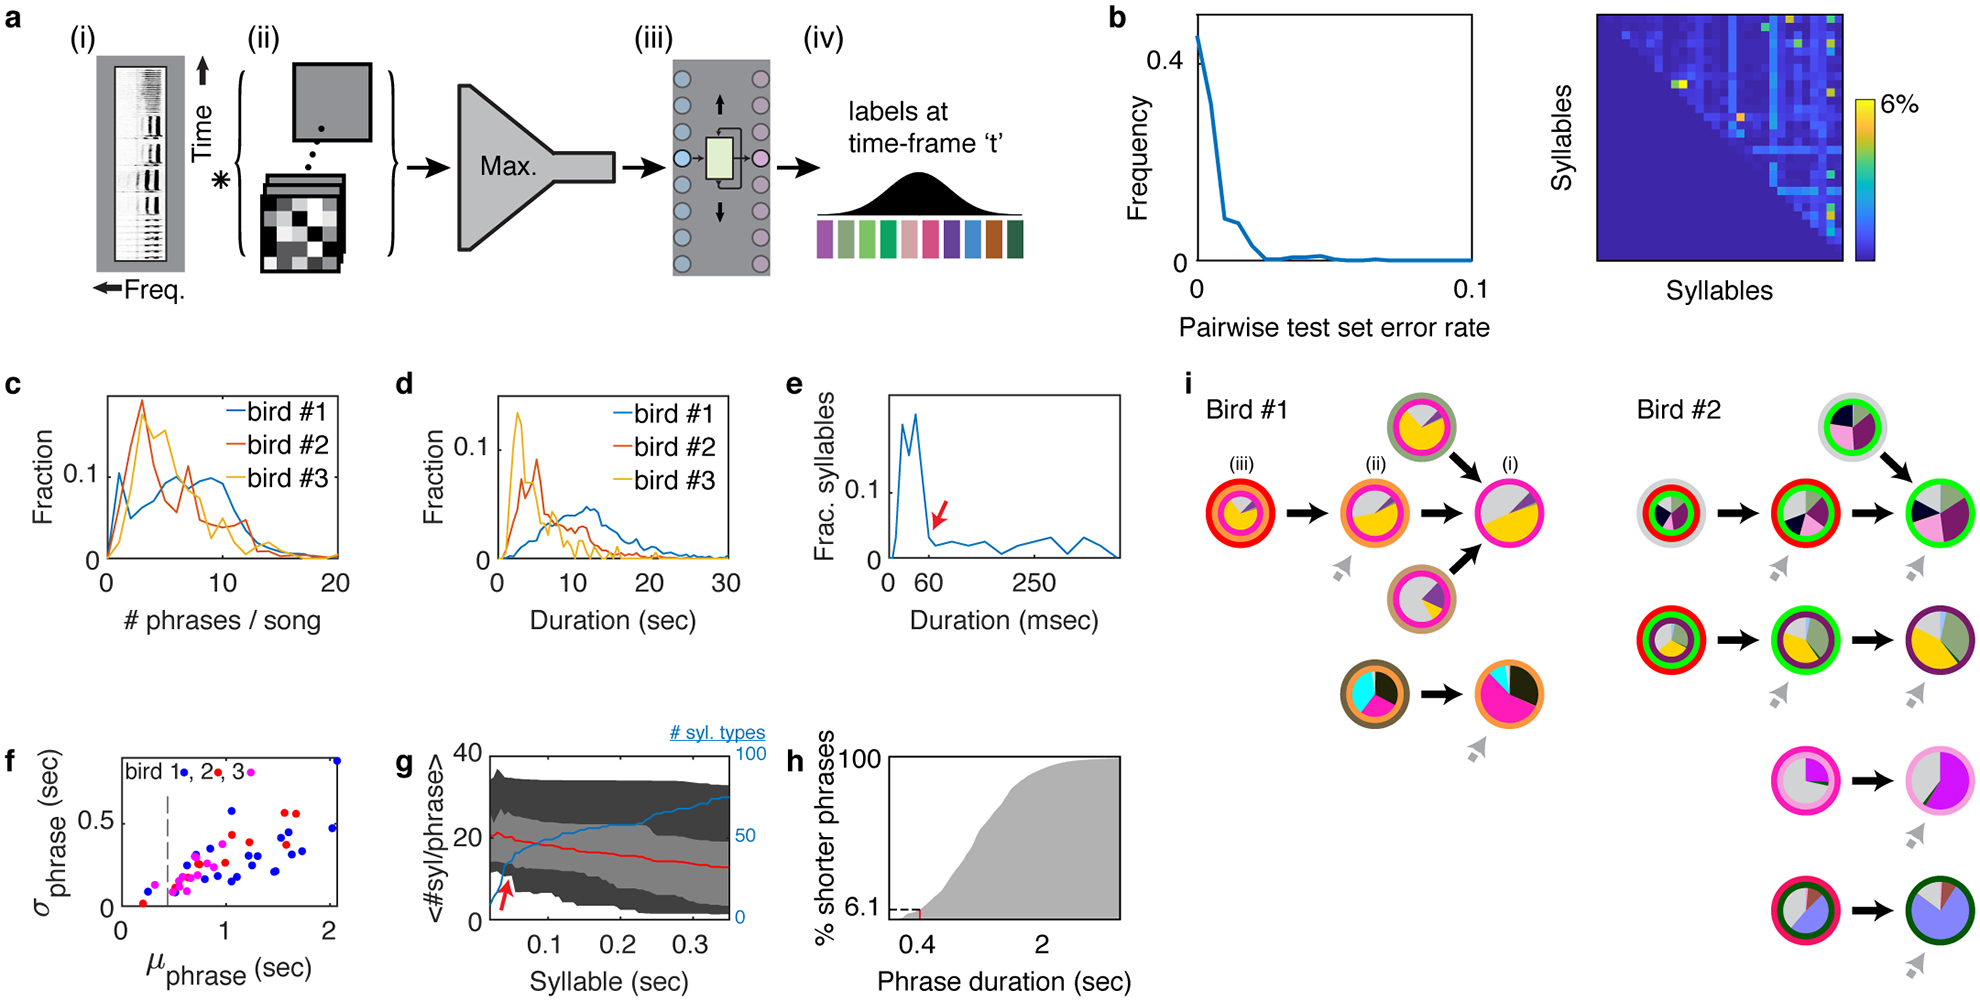
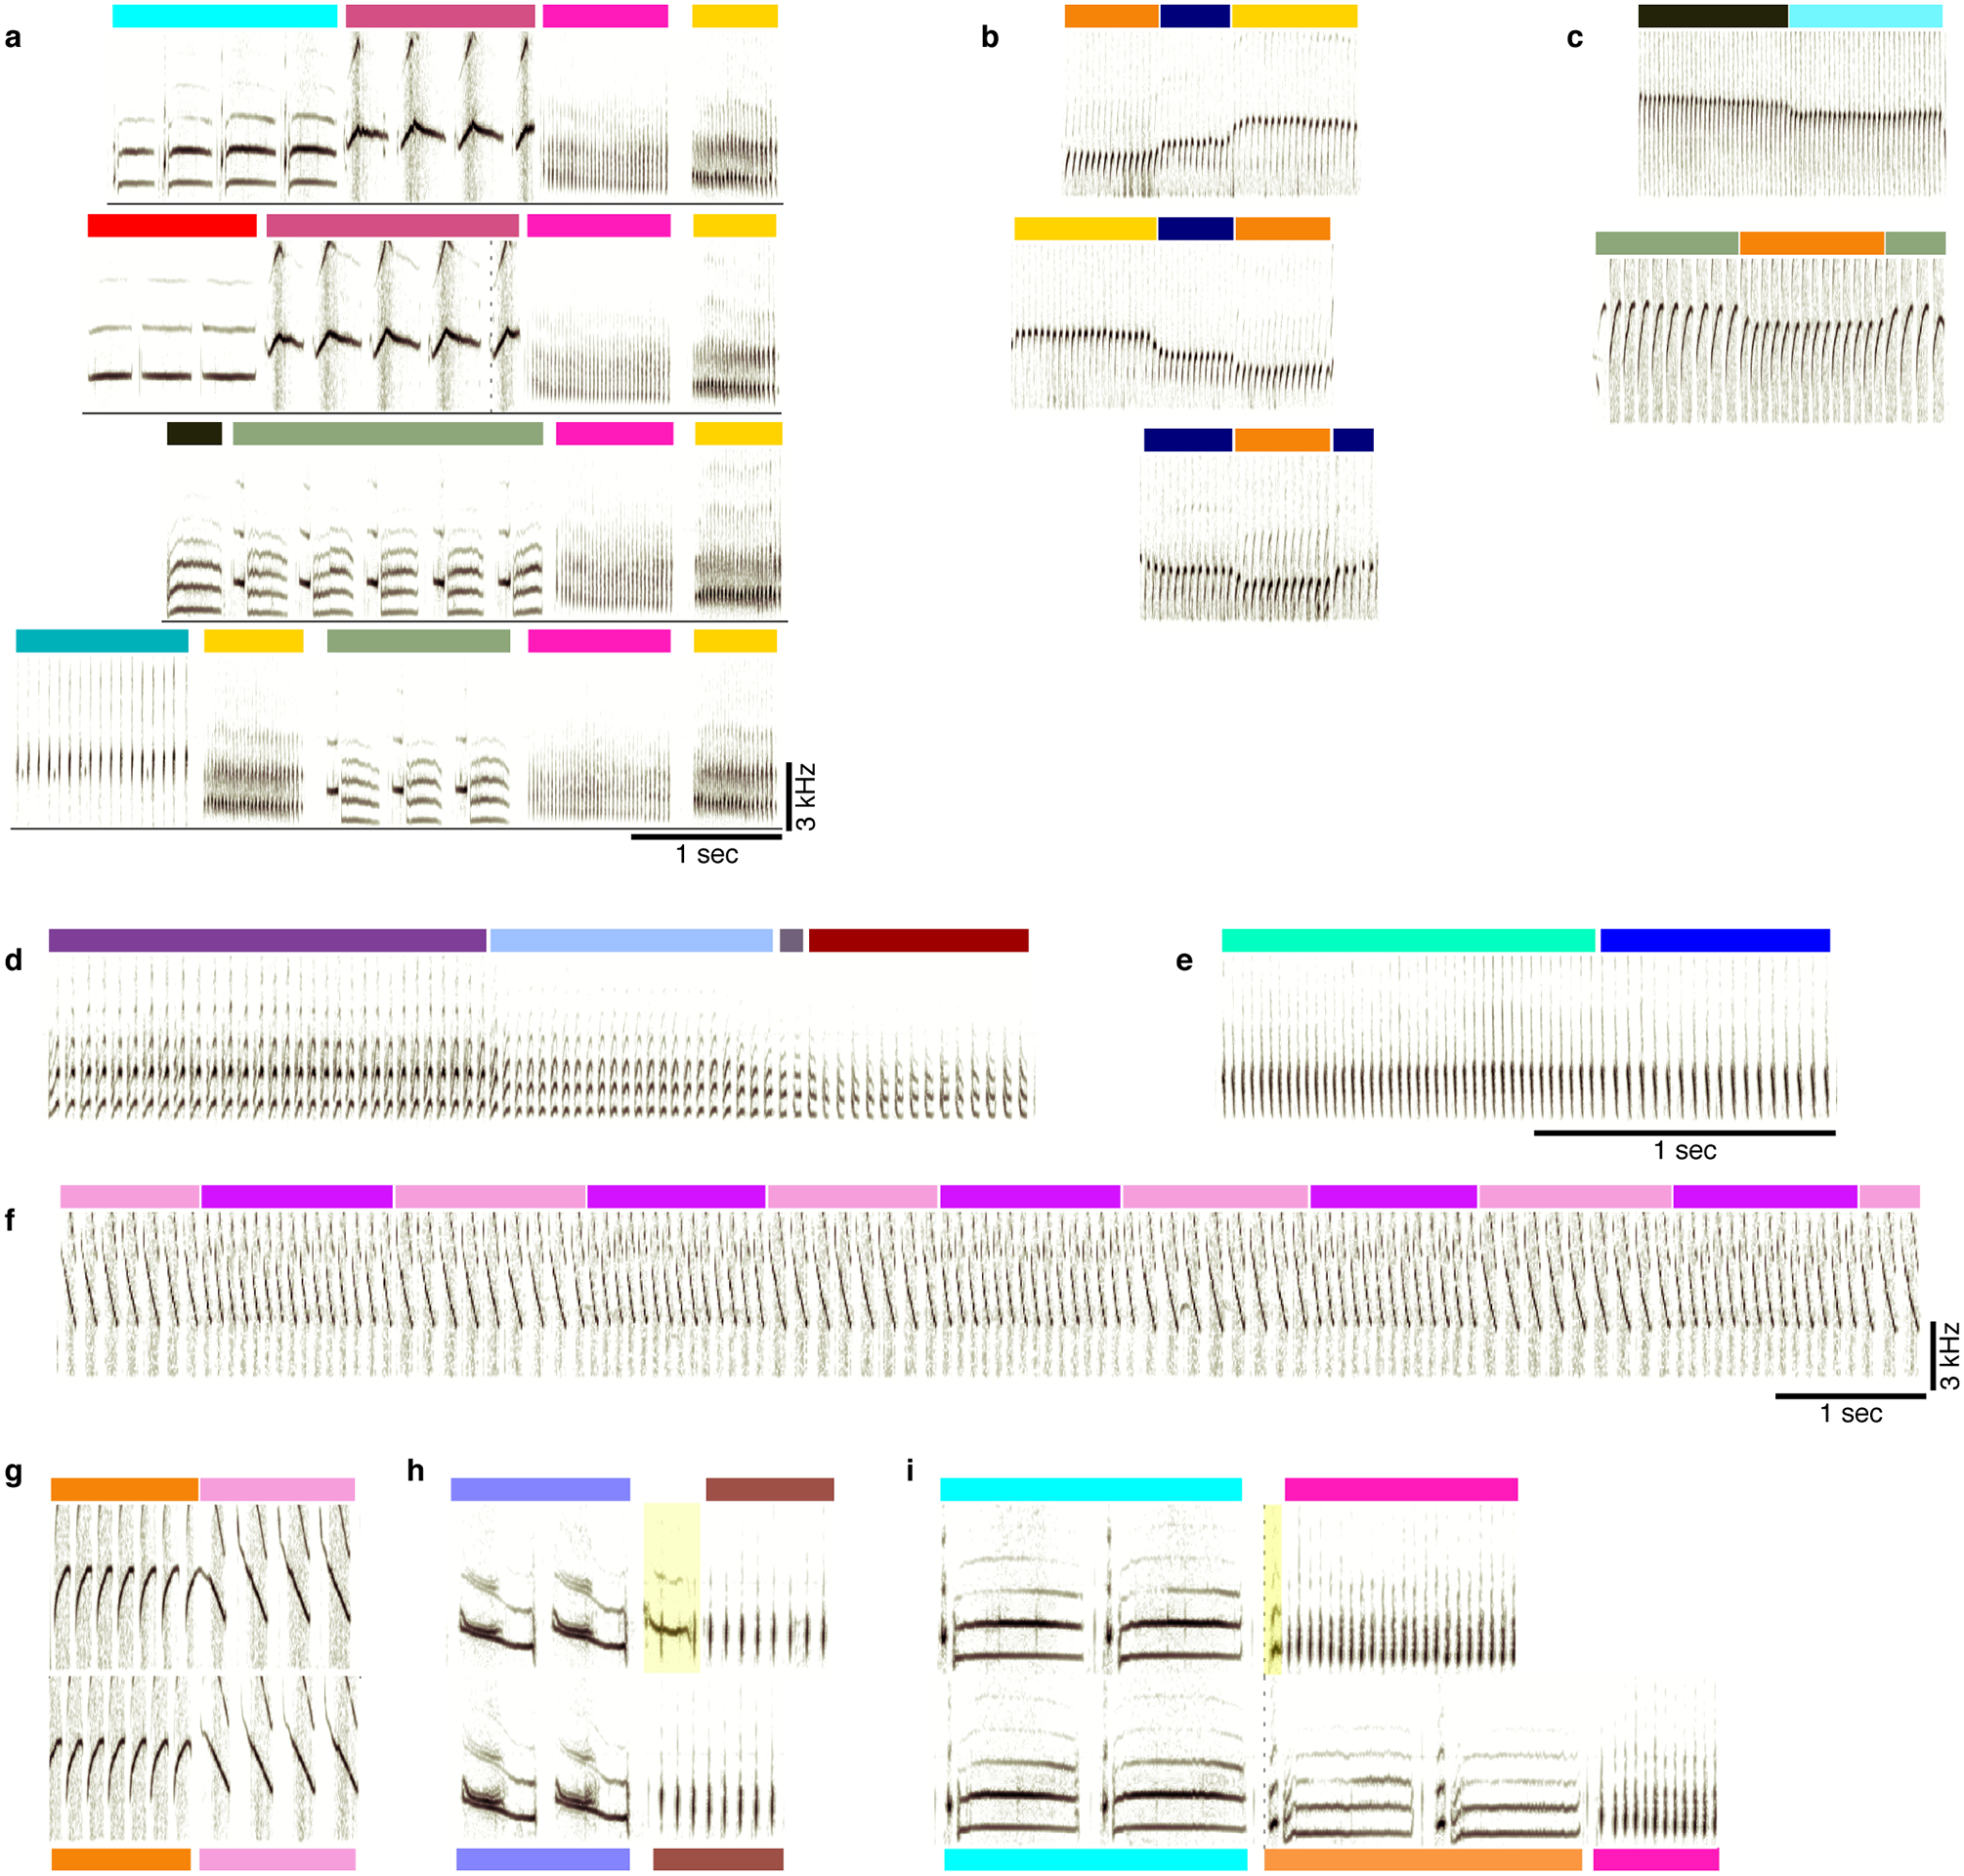
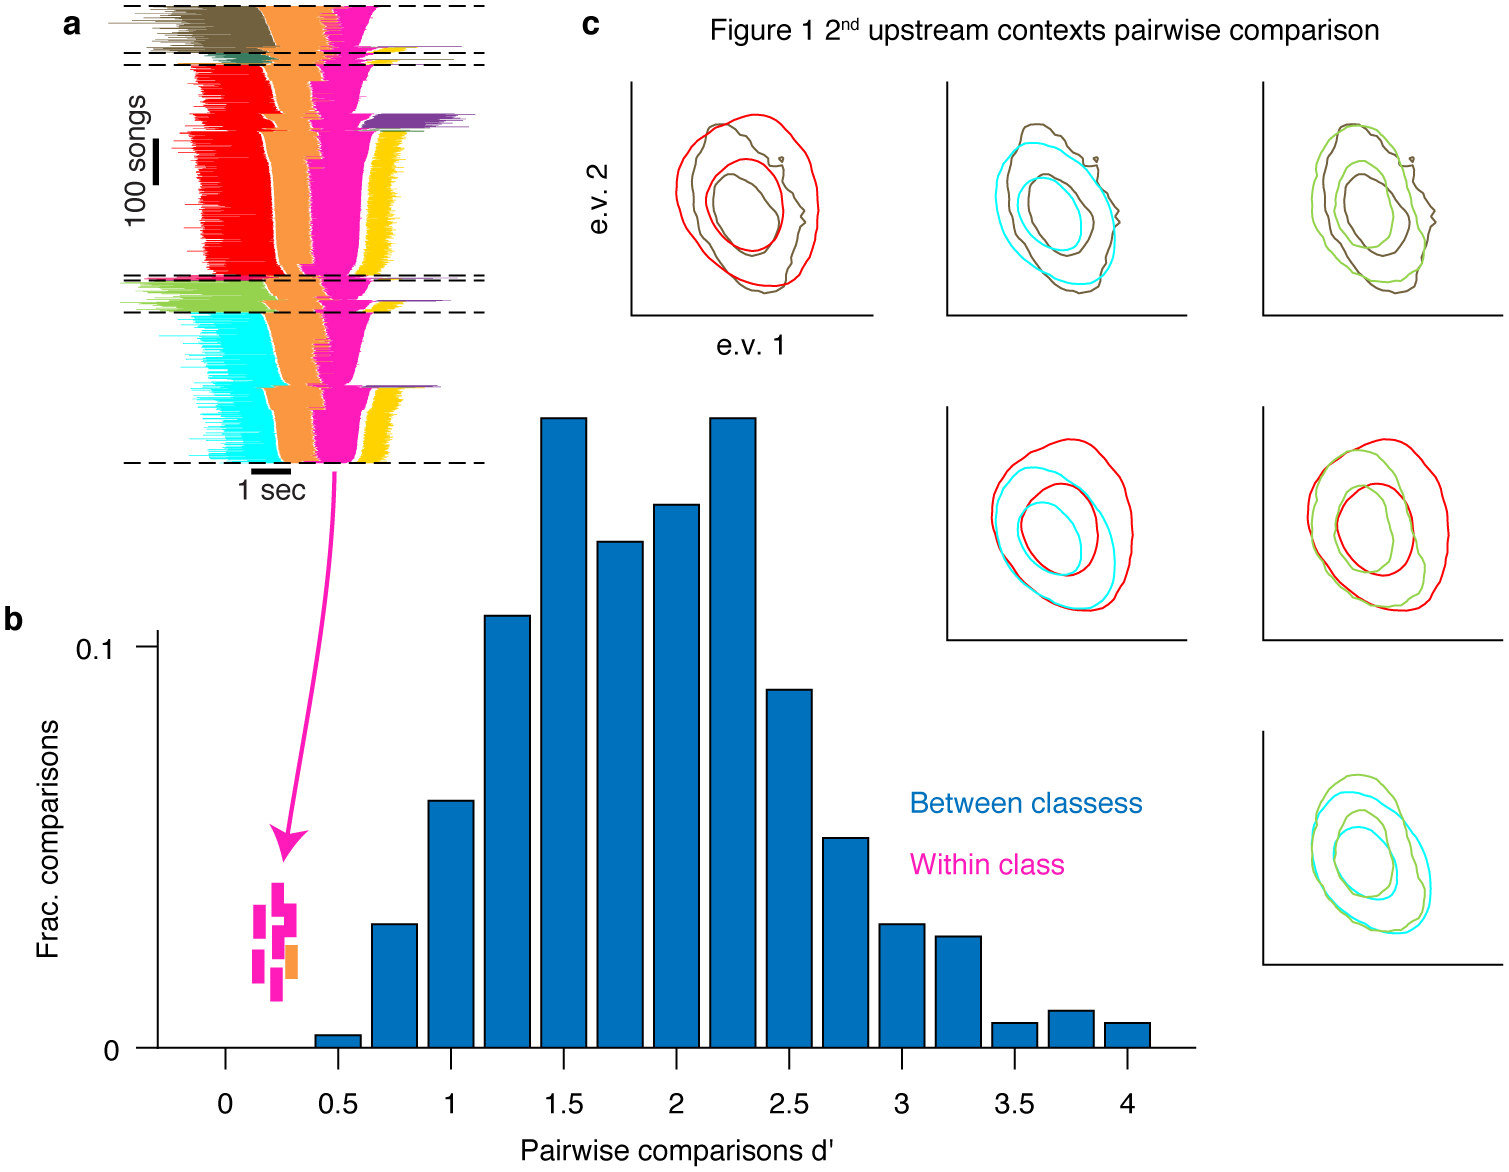
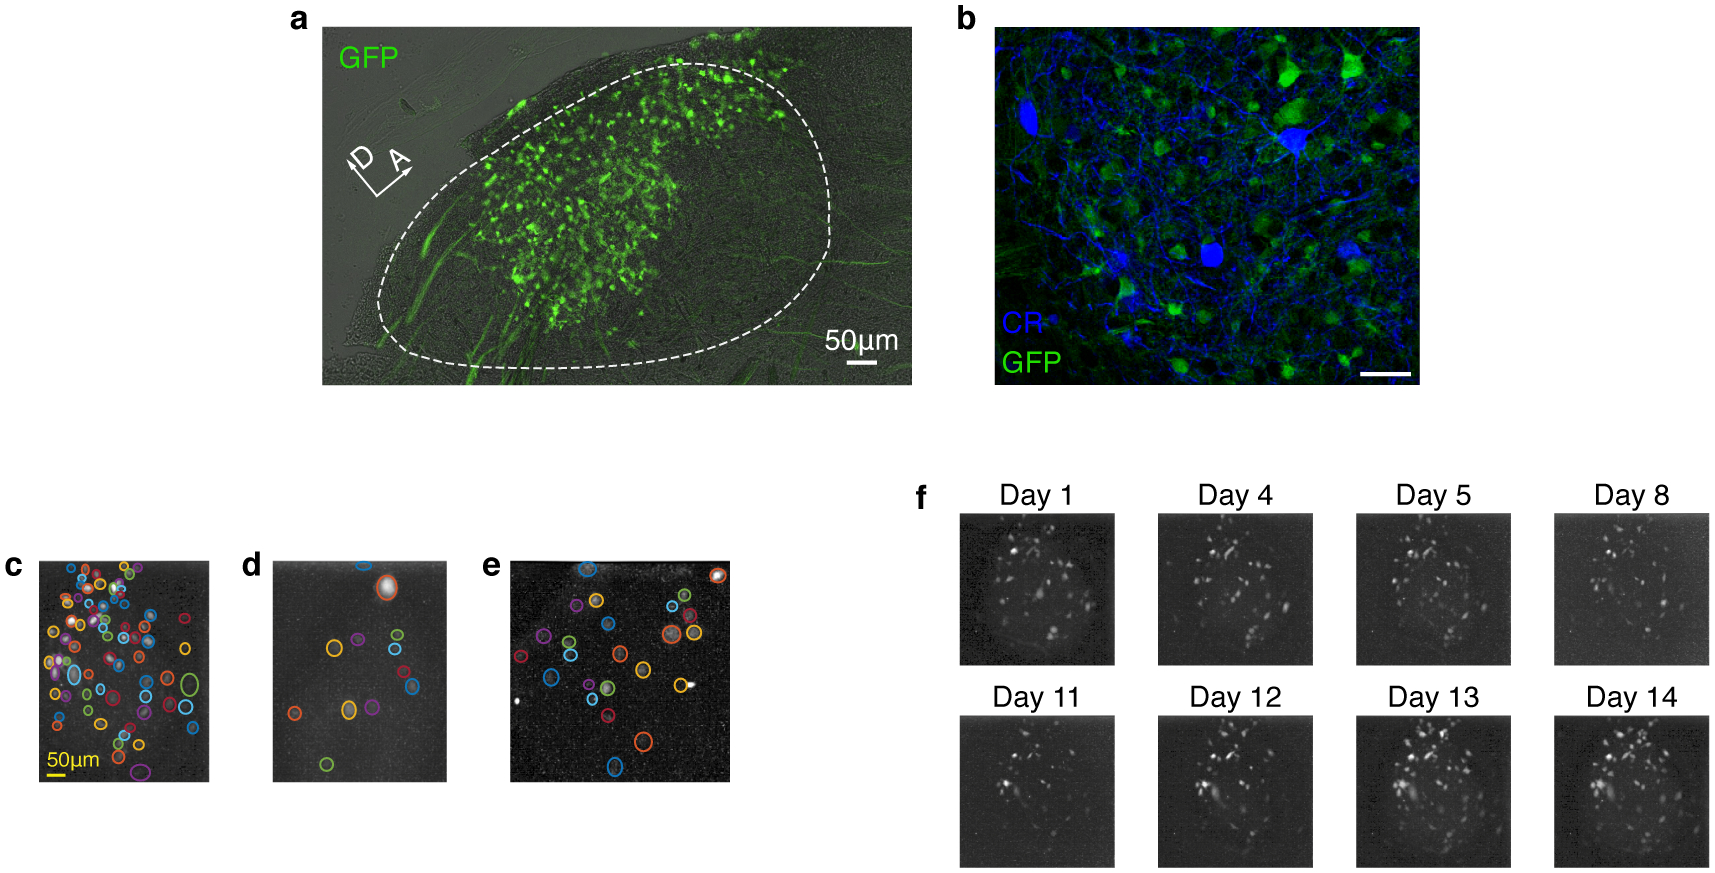
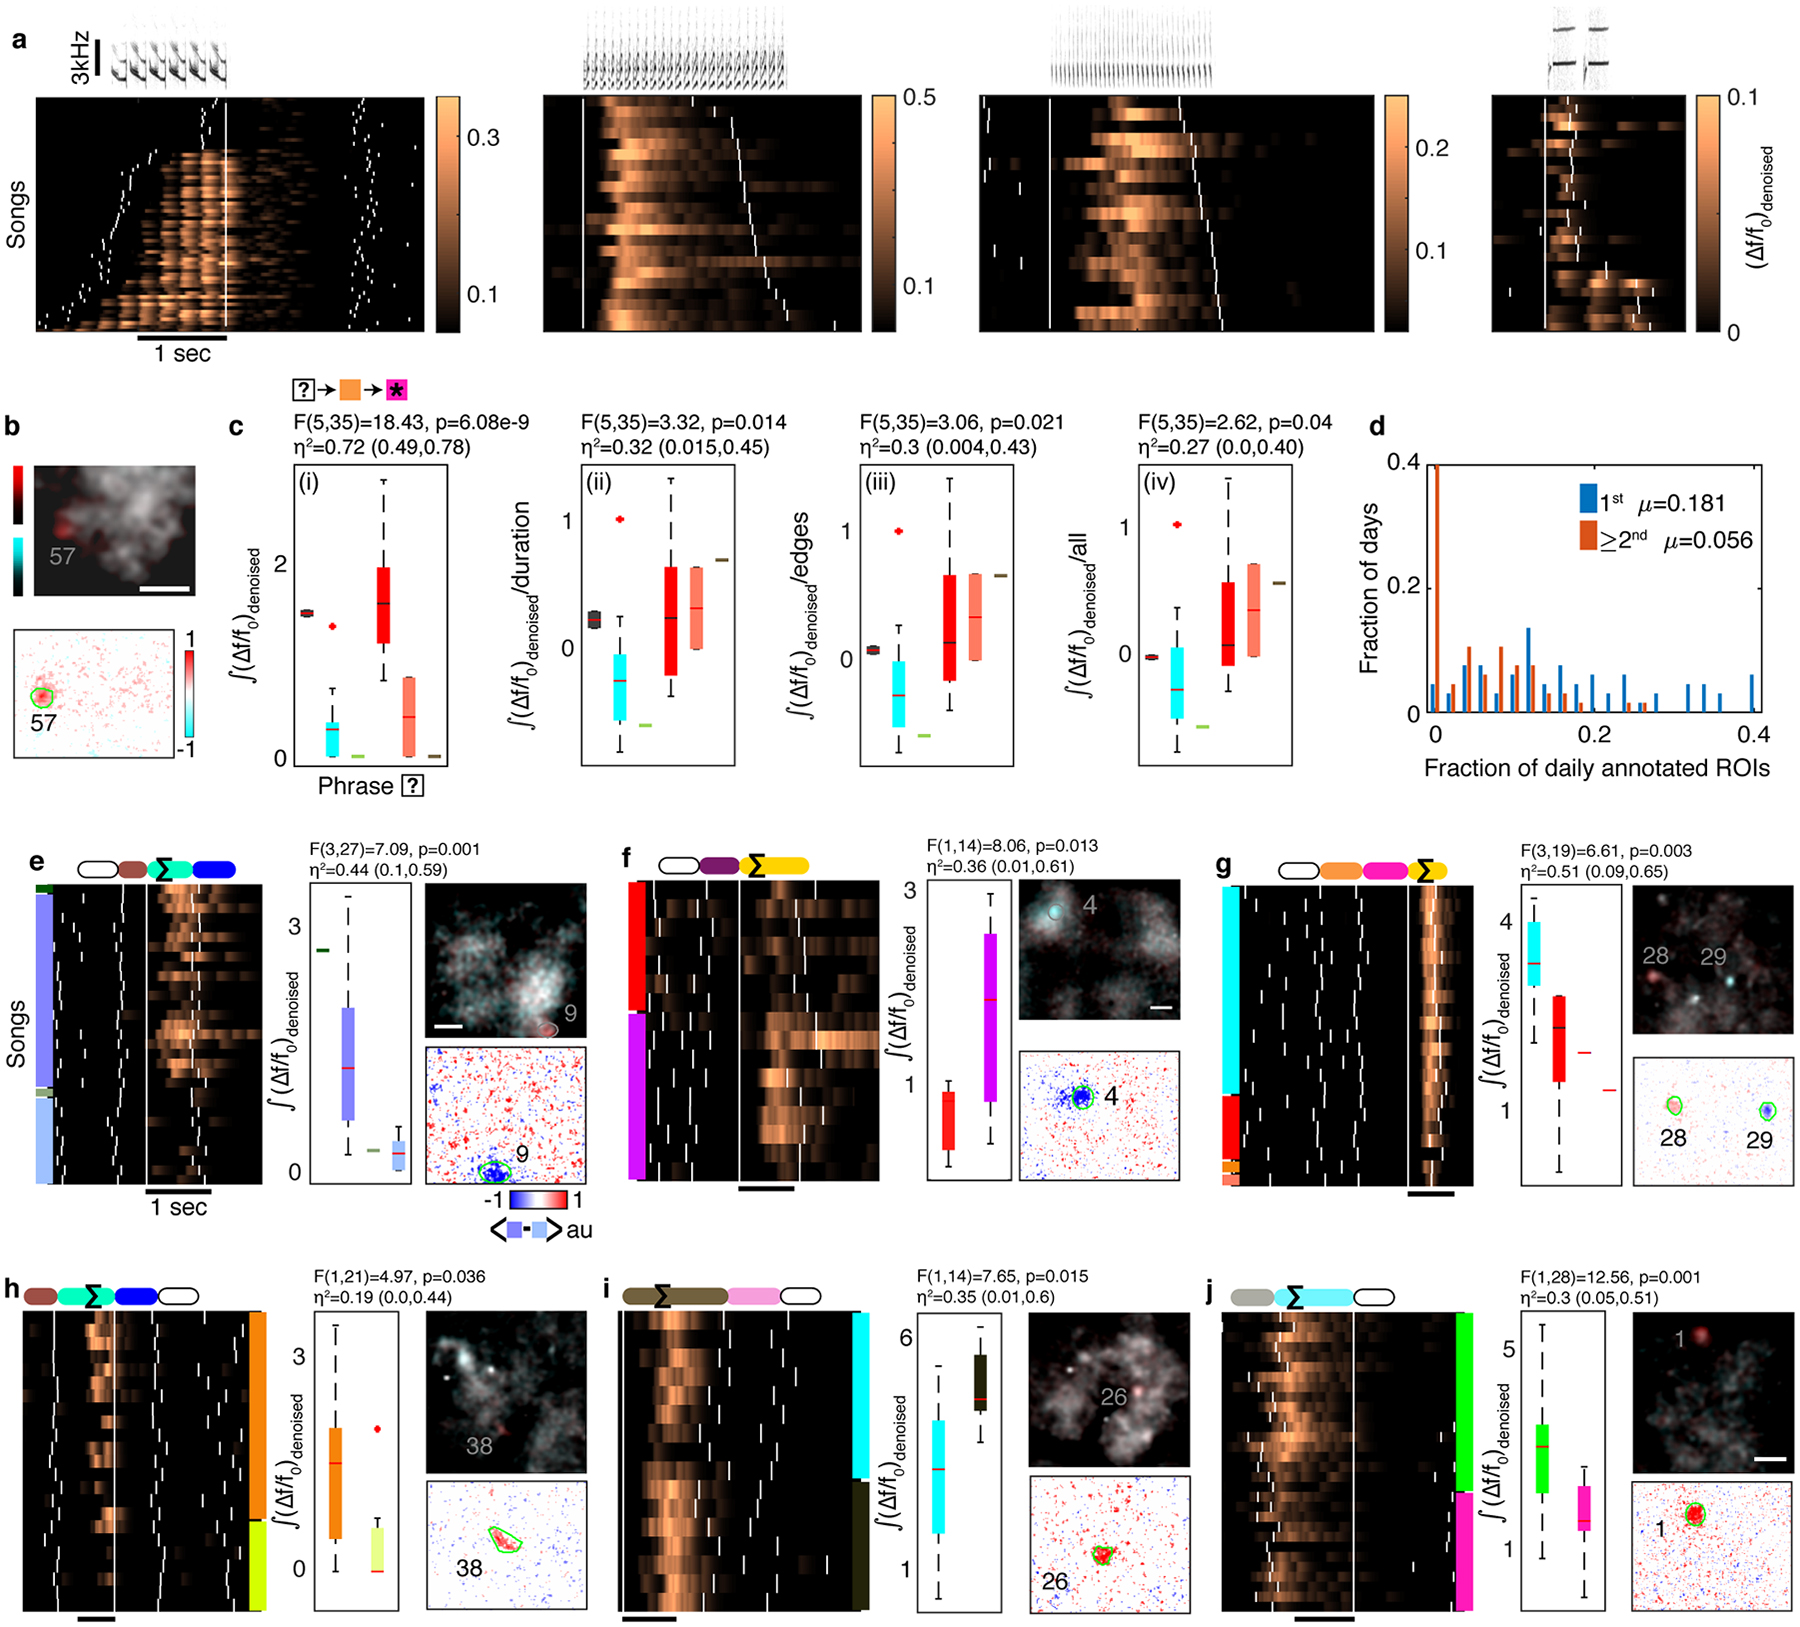
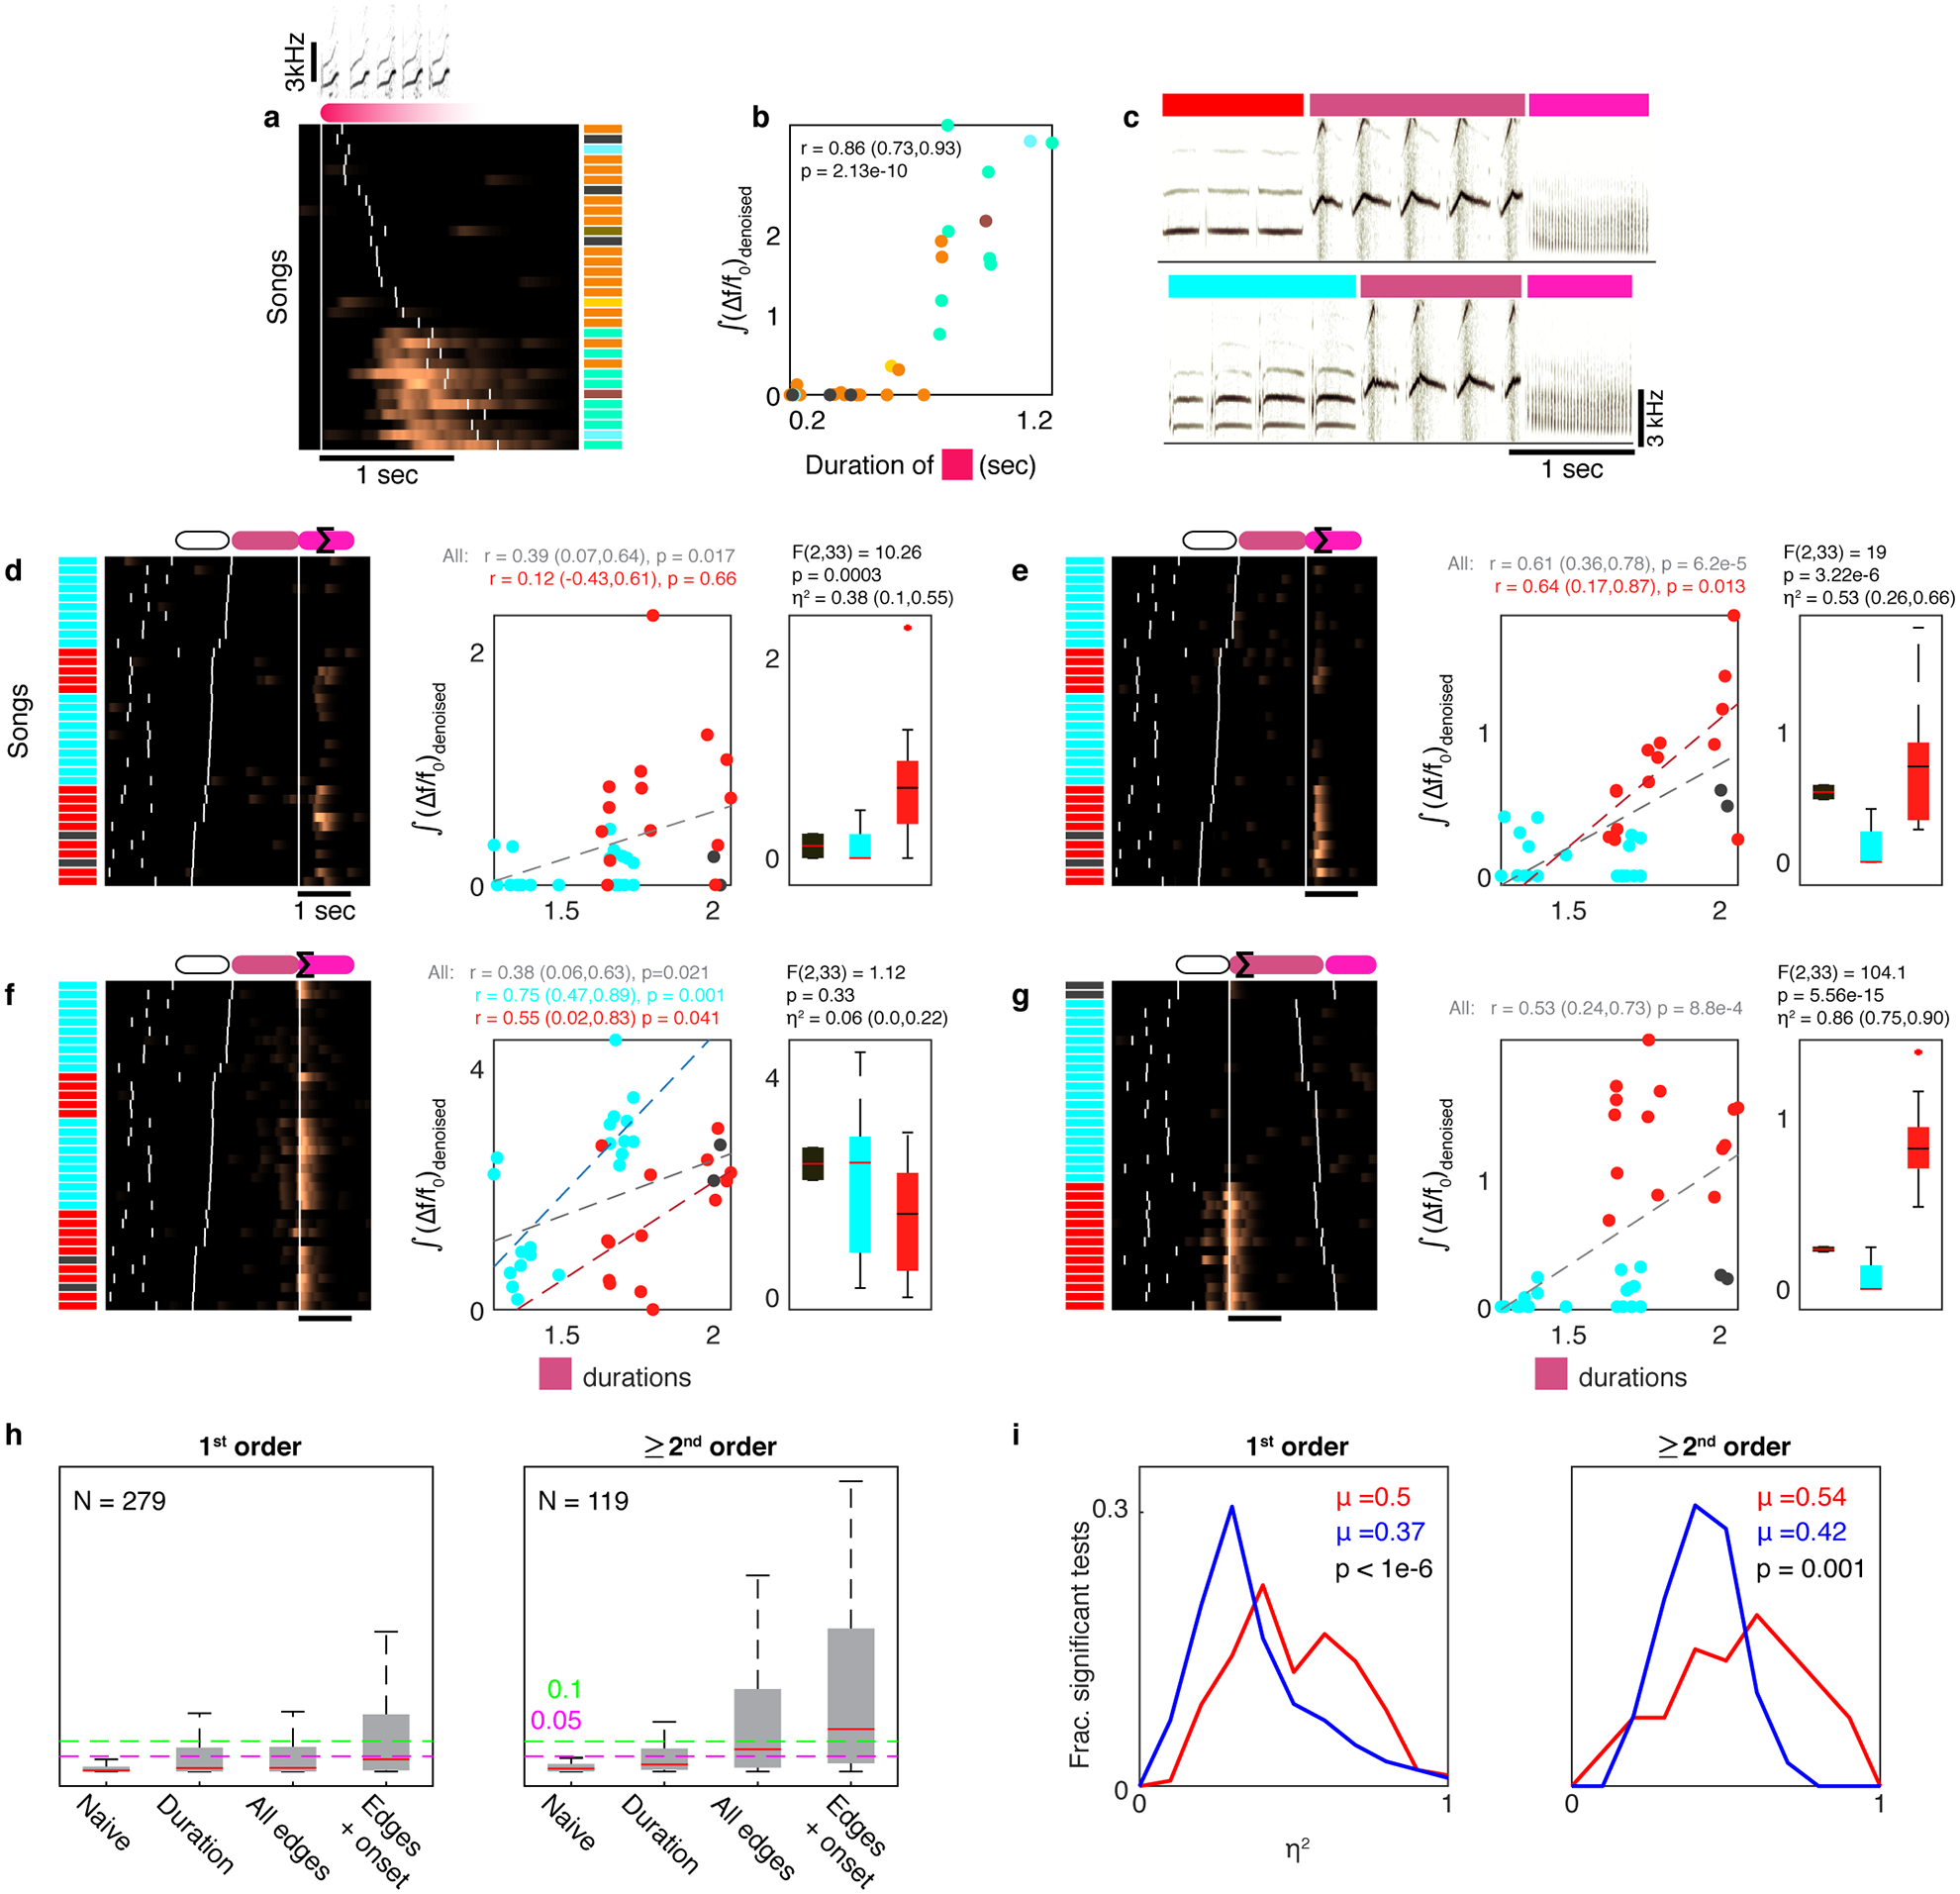
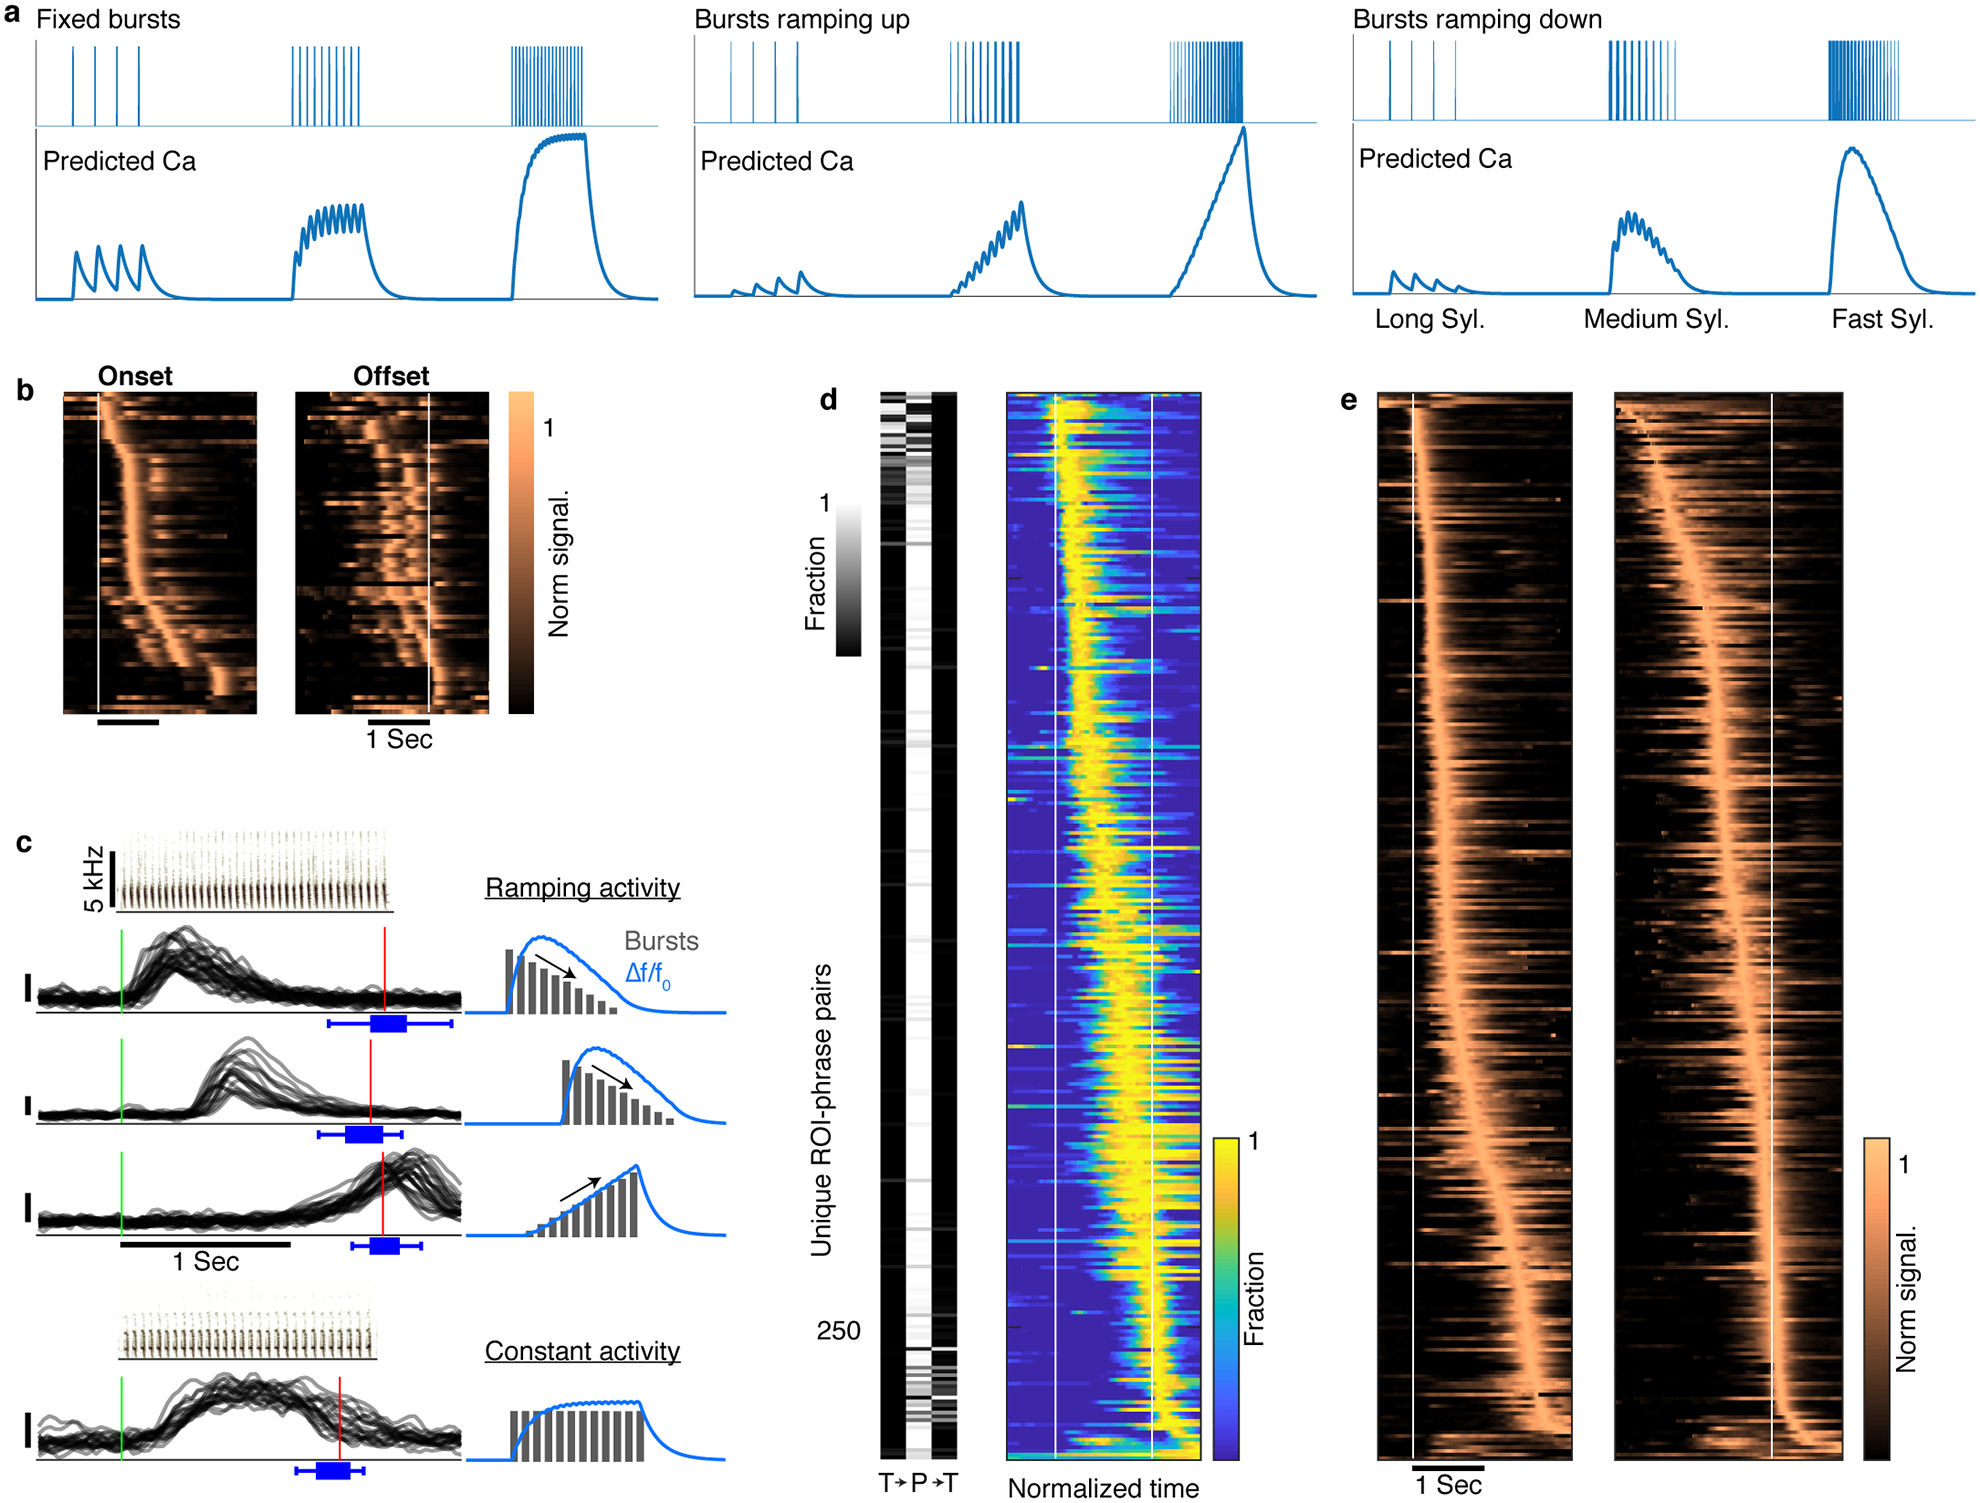
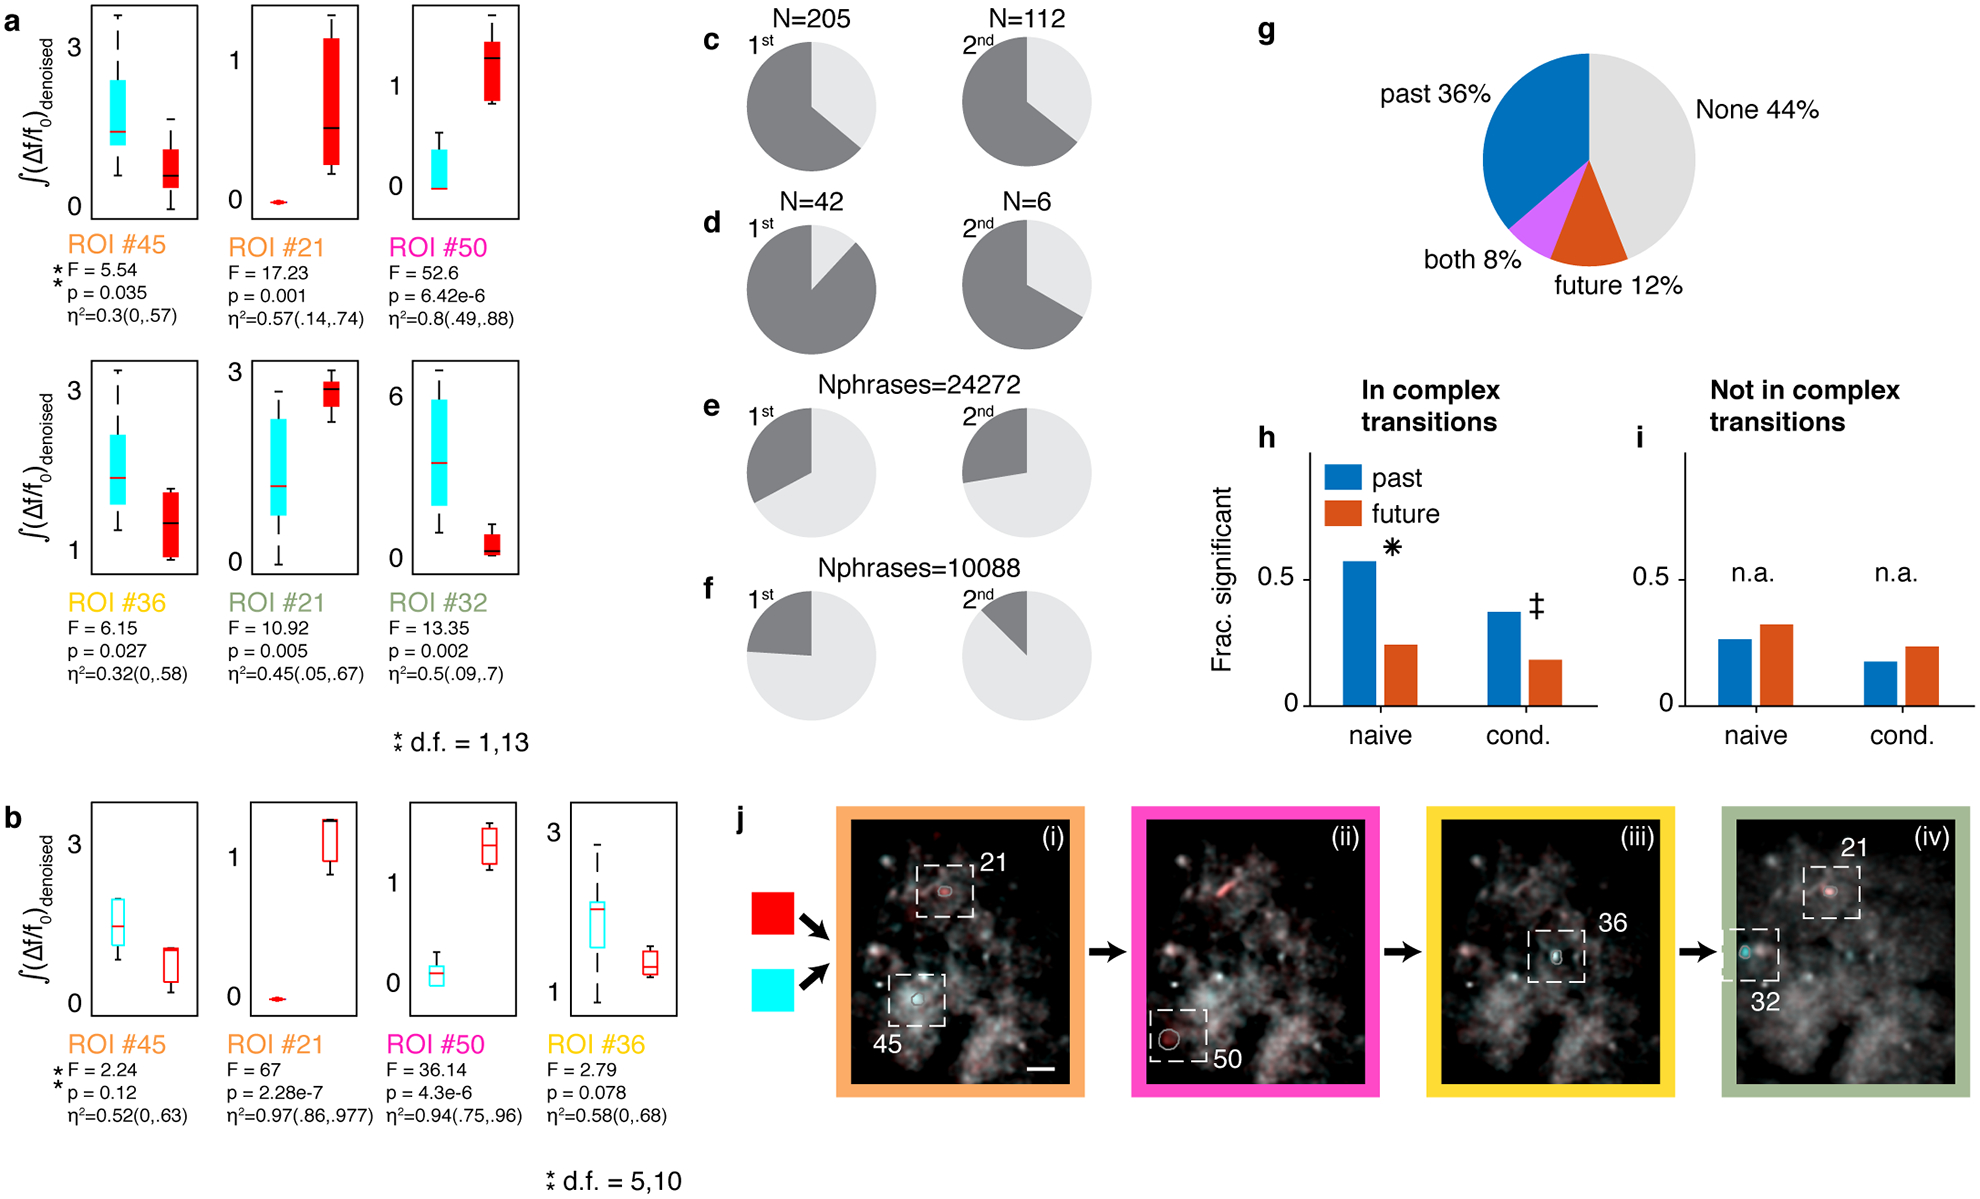
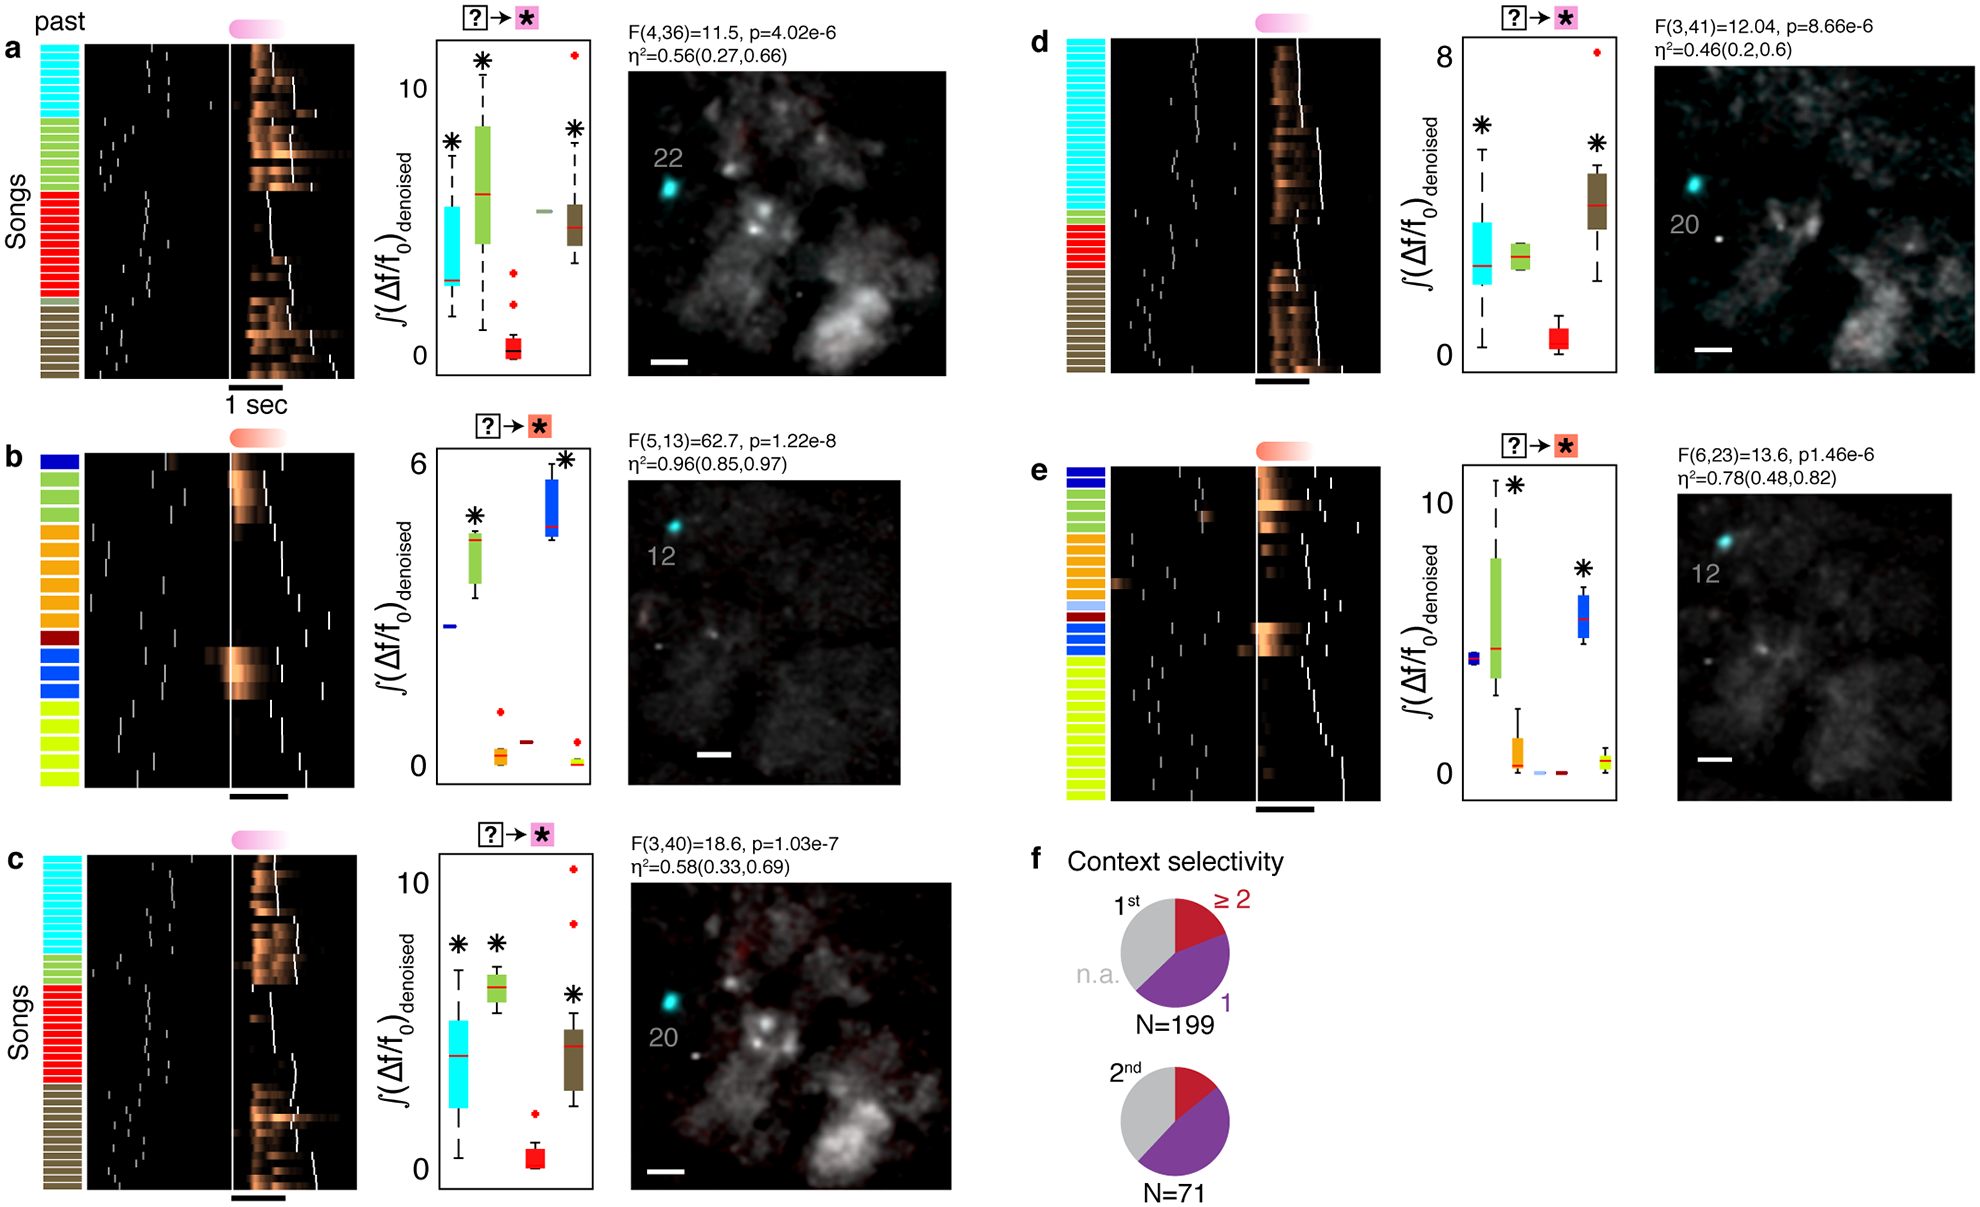
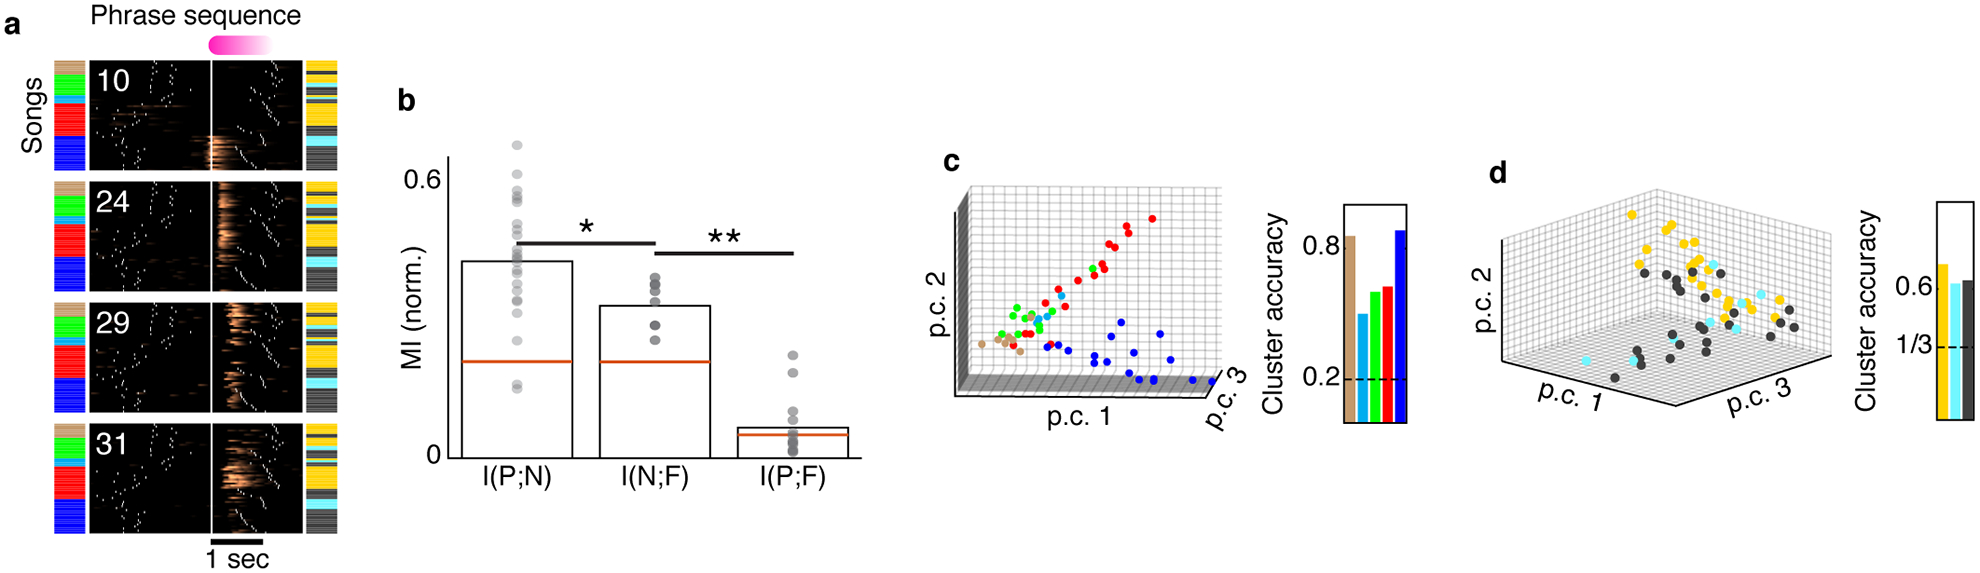
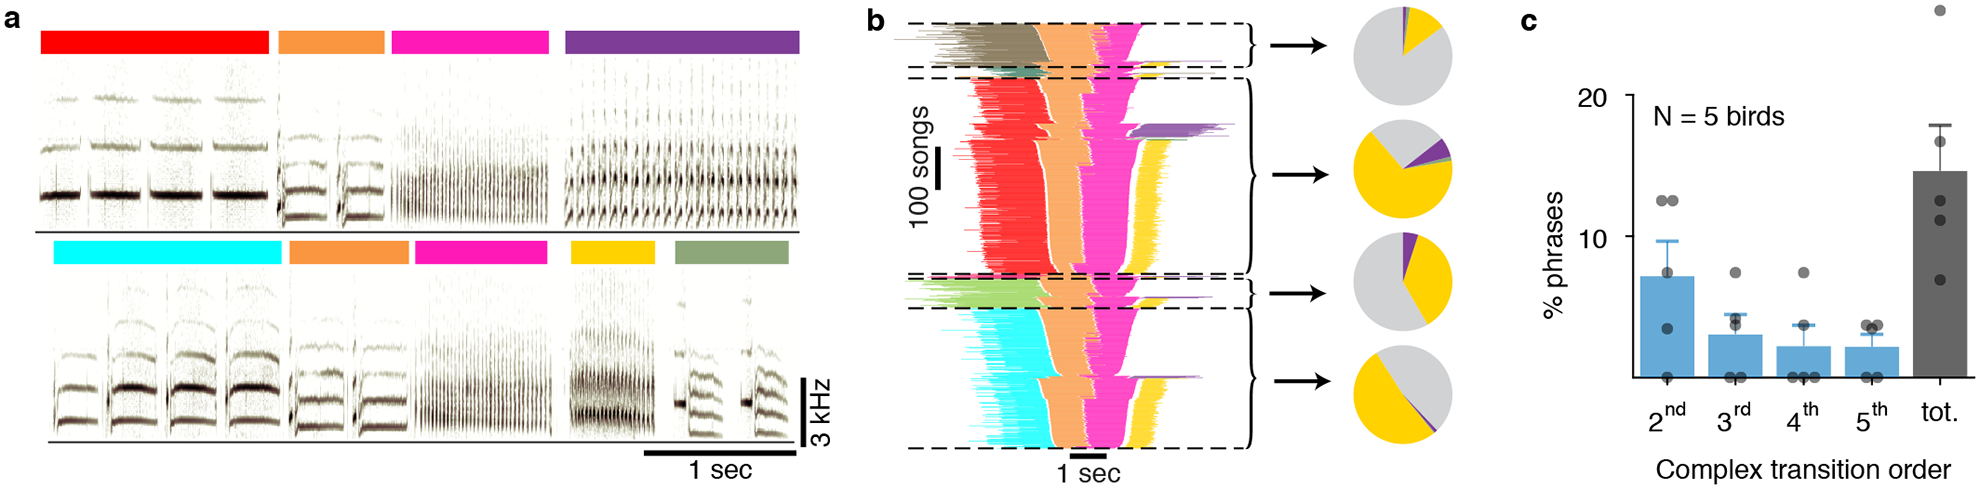
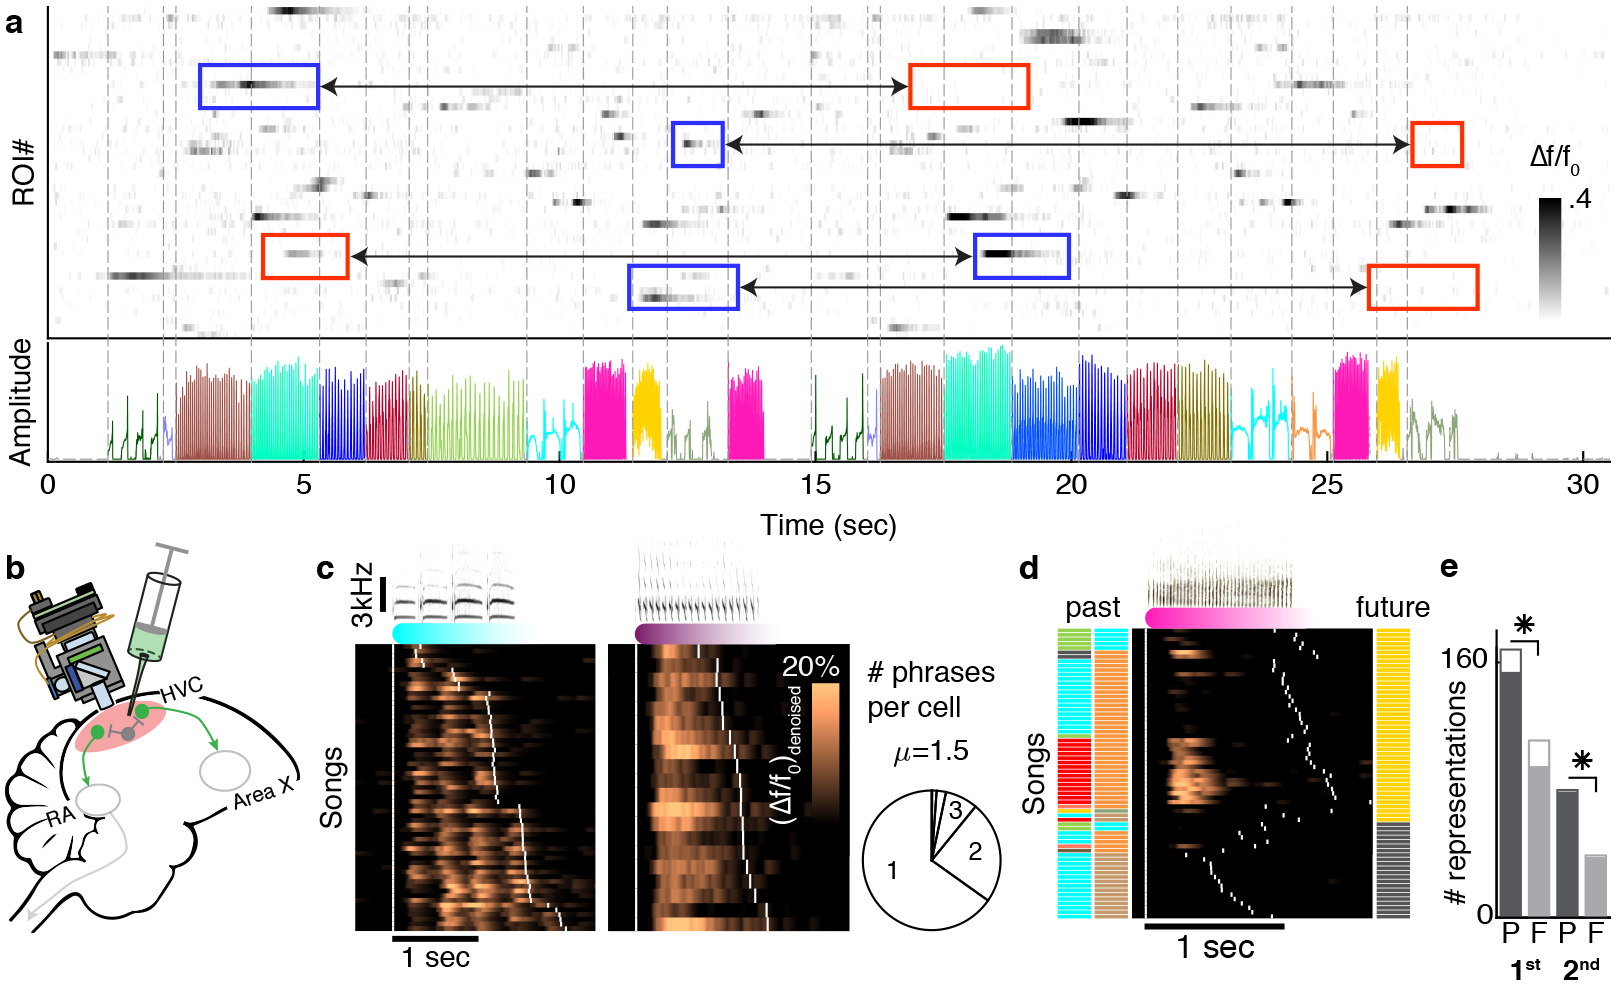
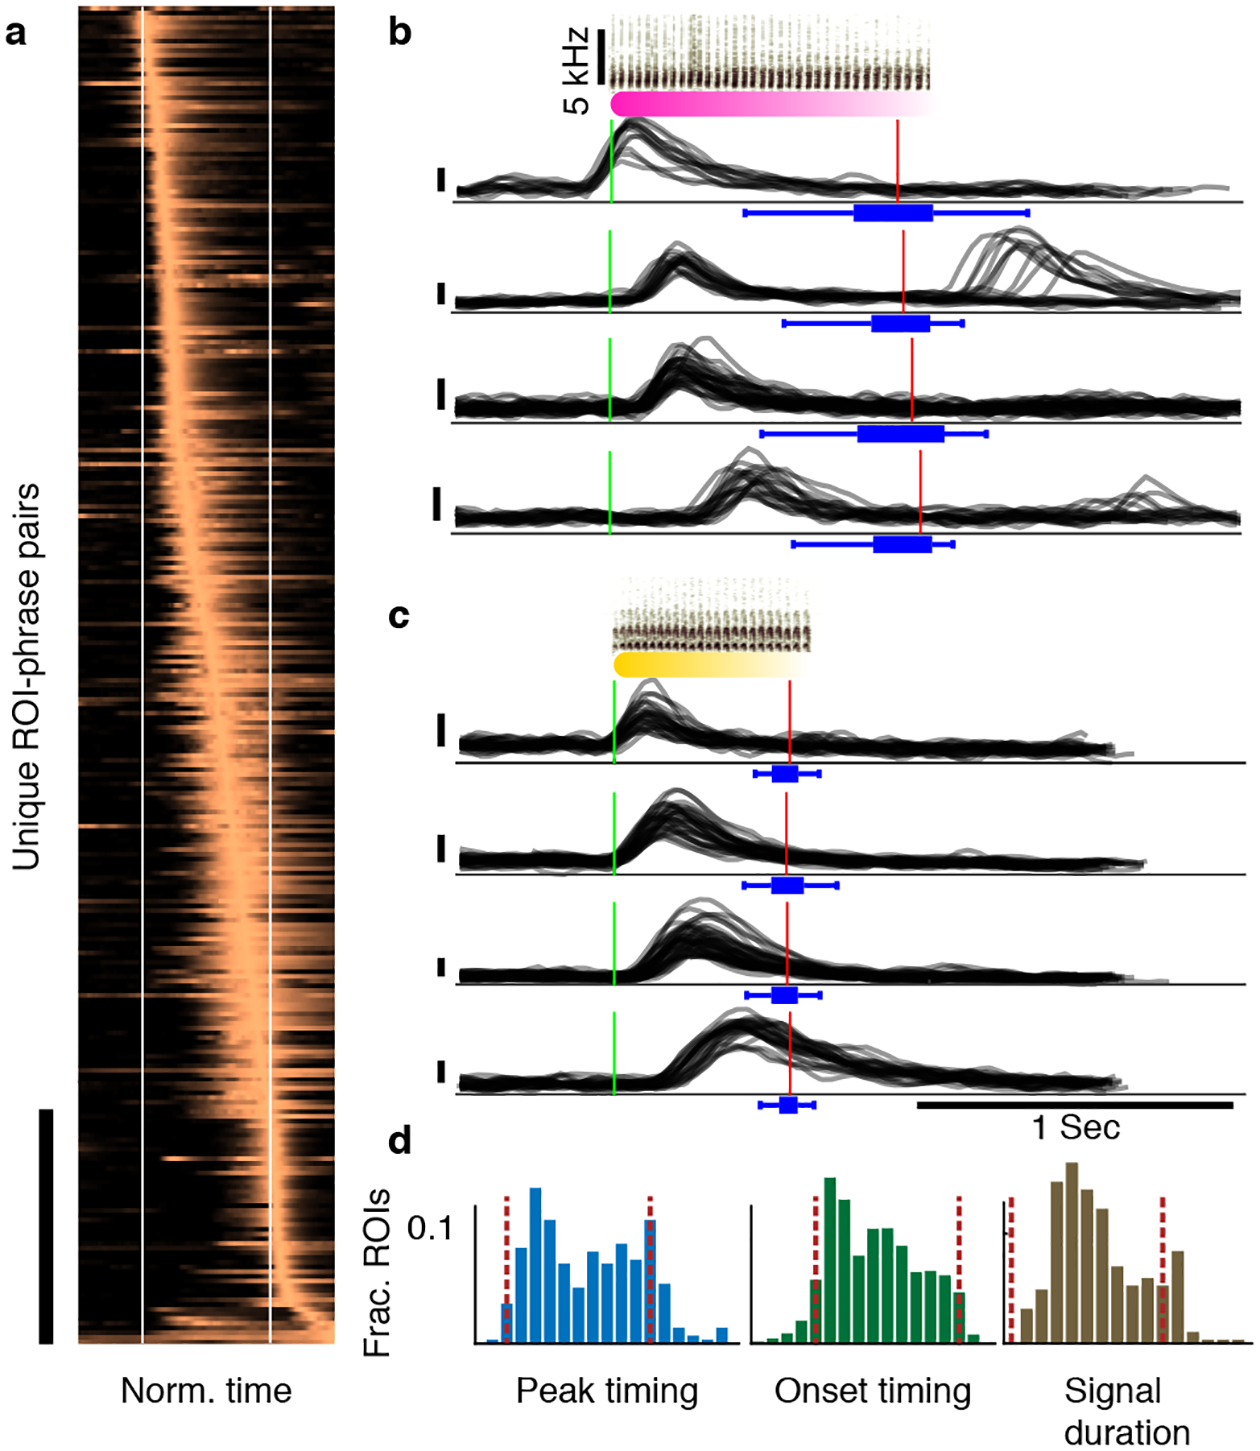
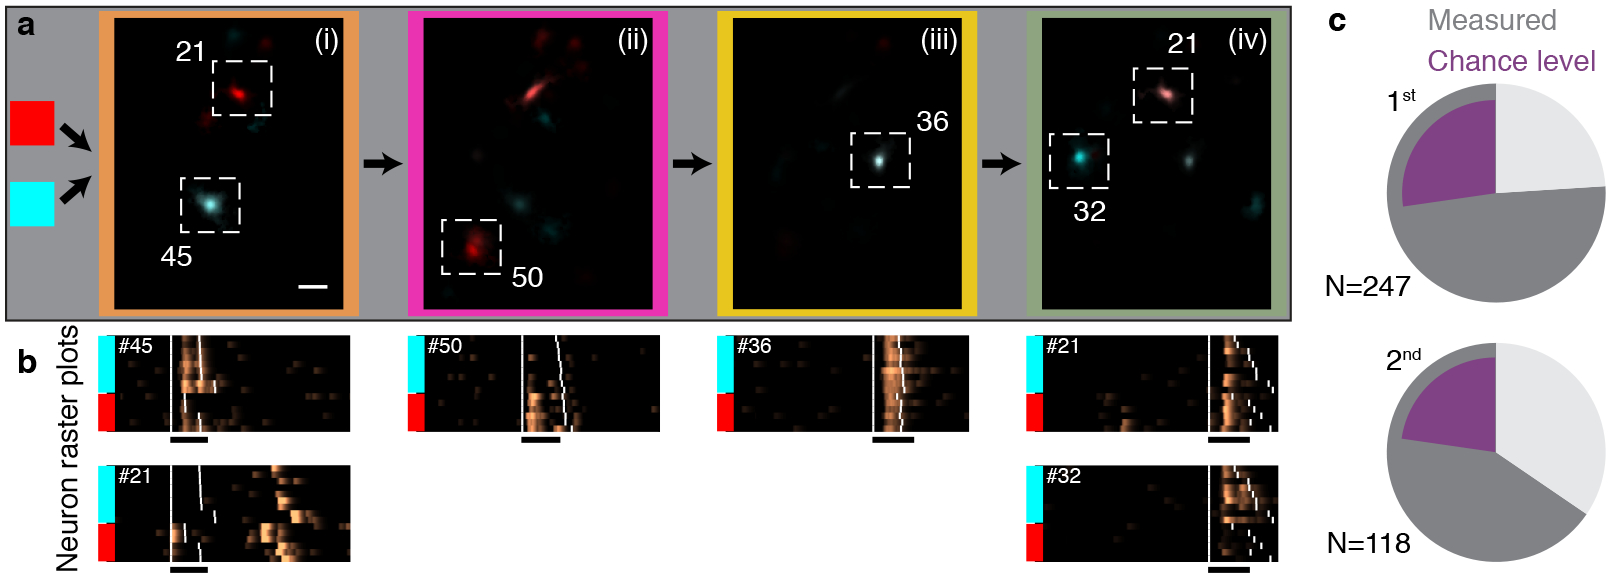
Coordinated skills such as speech or dance involve sequences of actions that follow syntactic rules in which transitions between elements depend on the identities and order of past actions. Canary songs consist of repeated syllables called phrases, and the ordering of these phrases follows long-range rules1 in which the choice of what to sing depends on the song structure many seconds prior. The neural substrates that support these long-range correlations are unknown. Here, using miniature head-mounted microscopes and cell-type-specific genetic tools, we observed neural activity in the premotor nucleus HVC2-4 as canaries explored various phrase sequences in their repertoire. We identified neurons that encode past transitions, extending over four phrases and spanning up to four seconds and forty syllables. These neurons preferentially encode past actions rather than future actions, can reflect more than one song history, and are active mostly during the rare phrases that involve history-dependent transitions in song. These findings demonstrate that the dynamics of HVC include 'hidden states' that are not reflected in ongoing behaviour but rather carry information about prior actions. These states provide a possible substrate for the control of syntax transitions governed by long-range rules.


Conflict of interest statement

Competing interests

The authors declare no competing interests

Figures

Extended Data Fig. 1 |
Extended Data Fig. 1 |. Canary song annotation and sequence statistics.
a. Architecture of syllable segmentation and annotation machine learning algorithm. (i) A spectrogram is fed to the algorithm as a 2D matrix in segments of 1 second. (ii). Convolutional and max-pooling layers learn local spectral and temporal filters. (iii). Bidirectional recurrent Long-Short-Term-Memory (LSTM) layer learns temporal sequencing features. (iv). Projection onto syllable classes assigns a probability for each 2.7 millisecond time bin and syllable. b. After manual proof reading (methods), a support vector machine (SVM) classifier was used to assess the pairwise confusion between all syllables classes of bird #1 (methods). The test set confusion matrix (right) and its histogram (left) show that in rare cases the error exceeded 1% and at most reached 6%. Since the higher values occurred only in phrases with 10s of syllables this metric guarantees that most of the syllables in every phrase cannot be confused as belonging to another syllable class. Accordingly, the possibility for making a mistake in identifying a phrase type is negligible. c. Histogram of the number of phrases per song for 3 birds used in this study. d. Histogram of song durations for 3 birds. e. Histogram of mean syllable durations, 85 syllable classes from 3 birds. Red arrow marks the duration, below which all trill types have more than 10 repetitions on average. f. Relation between phrase classes’ duration mean (x-axis) and standard deviation (y-axis). Syllables classes (dots) of 3 birds are colored by the bird number. Dashed line marks 450 msec, an upper limit for the decay time constant of GCaMP6f. g. Range of mean number of syllables per phrase (y-axis) for all syllable types with mean duration shorter than the x-axis value. Red line is the median, light gray marks the 25%, 75% quantiles and dark gray mark the 5%, 95% quantile (blue line marks the # of syllable types contributing to these statistics). The red arrow matches the arrow in panel e. h. Cumulative histogram of trill phrase durations. i. All complex phrase transitions with ≥2nd order dependence on song history context (for birds #1, #2). For each phrase type that precedes a complex transition, the context dependence is visualized by a graph called a Probabilistic Suffix Tree (methods). Transition outcome probabilities are marked by pies at the center of each node. The song context—phrase sequence—that leads to the transition, is marked by concentric circles, the inner most being the phrase type preceding the transition. Nodes are connected to indicate the sequences in which they are added in the search for longer Markov chains that describe context dependence (e.g. i-iii for 1st to 3rd order Markov chains). Grey arrows indicate additional incoming links that are not shown for simplicity.
Extended Data Fig. 2 |
Extended Data Fig. 2 |. Examples of canary song phrase sequences, rare inter-phrase gaps, and aberrant syllables.
a. Additional spectrograms of phrase sequences (colors above the spectrograms indicate phrase identity), leading to a repeating pair of phrases (pink and yellow). b. Examples of flexible phrase sequencing comprised of pitch changes (from bird #3). c. Examples of phrase transitions with a pitch change from bird #2. d-f. Phrase sequences showing changes in spectral and temporal parameters. d, bird #1, changes from up sweep (purple) to down sweep (dark red) through intermediate phrases of intermediate acoustic structure. e, bird #1, a change in inter-syllable gaps. f, from bird #2, changes in pitch sweep rate. g. Top and bottom sonograms compare the same phrase transitions where the inter-phrase gap varies. h, i. The top sonogram includes a rare vocalization in the beginning of the 2nd phrase (highlighted) that, in panel i, resemble the onset of an orange phrase type.
Extended Data Fig. 3 |
Extended Data Fig. 3 |. An example in which context-dependence of syllable acoustics prior to complex transitions is too small for clear distinction.
a. Repeats main figure 1b. A summary of all phrase sequences that contain a common transition reveals that the choice of what to sing after the pink phrase depends on the phrases that were produced earlier. Lines represent phrase identity and duration. Song sequences are stacked (vertical axis) sorted by the identity of the 1st phrase, the last phrase and then the center phrases’ duration. b. The discriminability (d’, x-axis) measures the acoustic distance between pairs of syllable classes in units of the within-class standard deviation (methods). Bars show the histogram across all pairs of syllables identified by human observers (methods) corresponding to about 99% or larger identification success (in Extended Data Fig. 1b). The pink ticks mark the d’ values for 6 within-class comparison of the main 4 contexts in panel a. The orange tick marks the d’ another context comparison in a different syllable that precedes a complex transition for this bird. c. The pairwise comparison of distributions matching the pink ticks in panel b. Each inset shows overlays of two distributions marked by contours at the 0.1 and 0.5 values of the peak and colored by the context in panel a. The distributions are projected onto the 2 leading principle components of the acoustic features (methods). While some of these distributions are statistically distinct they only allow for ~70% context identification success in the most distinct case.
Extended Data Fig. 4 |
Extended Data Fig. 4 |. Calcium indicator is expressed exclusively in HVC excitatory neurons and imaged in annotated regions of interest (ROIs)
a. Sagittal slice of HVC showing GCaMP expressing projection neurons (Experiment repeated in 5 birds with similar results). b. We observed no overlap between transduced GCaMP6f-expressing neurons, and neurons stained for the inhibitory neurons markers calretinin, calbindin, and parvalbumin (CR stain shown, staining experiment repeated 6 times for each marker with similar results). c-e. Example of daily ROI annotation in 3 birds. Colored circles mark different ROIs, manually annotated on maximum fluorescence projection images an exemplary day (see methods). Panel are for birds 1–3. f. Maximum fluorescence images (methods, from bird 1) revealing the fluorescence sources including sparsely active cells in the imaging window across multiple days.
Extended Data Fig. 5 |
Extended Data Fig. 5 |. Syllable and phrase-sequence-correlated ROIs from 3 birds.
a. Sonograms on top of rasters from 4 ROIs from 3 birds. White ticks indicate phrase onsets. The fluorescent calcium indicator is able to resolve individual long syllables. b. Top, average maximum fluorescence images during the pink phrase in Figure 2d, compare the two most common contexts in orthogonal colors (red and cyan). Scale bar is 50μm. Bottom, the difference of the overlaid images. ROI outlined in green. c. (i) 1-way ANOVA (F,p,η2 and its 95% CI), tests the effect of contexts (x-axis, 2nd preceding phrase type in N=41 sequences) on the signal (y-axis. Lines, boxes, whiskers, and ‘+’s show the median, 1st and 3rd quartiles, full range, and outliers), during the target phrase (marked by ★) in Figure 2d. (ii-iv), ANOVA tests carried out using the residuals from the signal after removing the cumulative linear dependence on the duration of the target phrase, the relative timing of onset and offset edges of two fixed phrases, and the absolute onset time of the target phrase in each rendition. Colors correspond to phrases in Figure 2d. d. Histogram of fractions of daily annotated ROIs showing sequence correlation in all 3 birds. Each ROI can be counted only once per order. This estimate includes sparsely active ROIs. e-j. Activity during a target phrase (marked by ∑) is strongly related to non-adjacent phrase identities (empty ovals in color coded phrase sequence). Songs are arranged by the phrase sequence context (left or right color patches for past and future phrase types). White ticks indicate phrase onsets. Box plots and contrast images as defined in panels b,c. N=31,16,23,23,16,30 songs contribute to panels e-j. e,f. Similar to main Figure 2d, (Δf/f0)denoised from ROIs with 2nd order upstream sequence (color coded) from two more birds. g. 3rd order upstream relation. h,i. 2nd order downstream relations. j. 1st order downstream relation from another bird.
Extended Data Fig. 6 |
Extended Data Fig. 6 |. Phrases’ durations and onset times also correlate to their sequence, but cannot fully account for HVC activity.
a. (Δf/f0)denoised signal traces (ROI 18, bird 3) during one phrase type (red) arranged by its duration. Colored barcode annotates the final phrase in the sequence. b. The signal correlates to the red phrase’s duration (r (95%CI), p: 2-sided Pearson’s test for N=32 songs. Colors match barcode in panel a). c. Sonograms of two phrase sequences. d-g. ROI signals during N=36 sequences containing the last 2 phrases in panel c have various relations to the duration of the middle (purple) phrase (Scatter plots as in panel b. Dashed lines indicate significant correlations) and the identity of the 1st phrase (colors, 1-way ANOVA (F,p,η2(95% CI)) tests the effect on the signal Σ. Whiskers, boxes, and lines show full range, 1st and 3rd quartiles, and medians). d. Signal correlation with phrase duration is completely entangled with the signal’s sequence preference and does not apply in separate preceding contexts (red, p > 0.5). e. Signal correlation with phrase duration is influenced by the signal’s sequence preference but also exists in the preferred sequence context separately (red). f. Signal duration correlation is observed within each single preceding context separately, but the correlation reduces across all songs. g. Similar to panel a, but the signal is in the 2nd phrase, not the 3rd. h. Distributions of 1-way ANOVA p-values (y-axis, whiskers, boxes, and red lines show full range, 1st and third quartiles, and medians) relating phrase identity and signal for adjacent phrases (N=279 independent 1st order tests, left) and non-adjacent phrases (N=119 independent ≥2nd order tests, right). Tests are also done on residuals of signals, after discounting the following variables: variance explained by the target phrase duration, the timing of all phrase edges in the test sequence, and the time-in-song (x-axis, effects accumulated left to right by multivariate linear regression, see methods). Colored, dashed lines mark 0.05 and 0.1 p-values. i. Effect size (η2 denotes frac. variance accounted for by the signals’ context dependence) of past (red) and future (blue) 1-way ANOVA tests for 1st order (left, N=279 tests) and ≥2nd order (right, N=119) correlations. Difference of the mean value (μ) is tested using 1-sided bootstrap shuffles (p-values, methods).
Extended Data Fig. 7 |
Extended Data Fig. 7 |. Signal shape and onset time of sequence-correlated HVC neurons reflect within-phrase timing.
a. Simulation of calcium indicator (GCaMP6f) fluorescence corresponding to syllable-locked spike bursts in HVC projection neurons. Syllable-locked spike bursts are convolved with the indicator’s kernel (methods) to estimate the expected signal when the number of spikes per burst is constant (left), ramps up (middle), or ramps down (right) linearly with the syllable number. The simulation assumes one burst per syllable in time spacing (x-axis) that matches long canary syllables (400–500msec), medium range syllables (100msec) and short syllables (50msec). b. Complementing Figure 3a, average context-sensitive activity in phrases with long syllables reveals syllable-locked peaks aligned to phrase onsets (left) or offsets (right, same row order as left) that change in magnitude across the phrase. c. Signal shape and onset timing has properties of within-phrase timing codes. Example raw Δf/f0 signals (y-axis, 0.1 marked by vertical bar) of 4 ROIs aligned to onset of specific phrase types (green line, sonograms show the repeating syllables. Red lines and blue box plots show the median, range, and quartiles of the phrase offset timing). The signal shapes resemble the expected fluorescence of the calcium indicator elicited by syllable-locked ramping (sketches, top three) or constant activity. d. Left, barcode show the fraction of signal onsets found in the preceding transition, within the phrase, and in the following transition (T→P→T, methods). Rows correspond to the phrases in Figure 3a. Right, rows show the average signal state occupancy estimated from HMMs fitted to the single-trial data contributing to Figure 3a. The resulting traces are time-warped to fixed phrase edges (white lines). e. The single-trial data in Figure 3a is aligned to phrase onsets (left) and offsets (right) and averaged in real time. The resulting traces are ordered by peak location (separately in left and right rasters).
Extended Data Fig. 8 |
Extended Data Fig. 8 |. Context sensitive signals aggregate in complex transitions and preferentially encode past transitions.
a. Distribution of signal integrals (y-axis, whiskers show full range, boxes show 1st and third quartiles, and lines show the medians) for ROIs in Figure 4a. (Text label is color coded by phrase type in sub-panels i-iv). F-numbers, p-values, and η2 (95% CI) for 1-way ANOVA relating history (x-axis) and signal (y-axis) in N=15 song sequences. b. ROIs in panel (a) retain their song-context bias also for songs that happen to terminate at end of the third phrase rather than continue. Box plots repeat the ANOVA tests in panel (a) for N=16 songs in which the last phrase is replaced by end-of-song. c-f. Dark grey slices indicate the fraction of correlations occurring in complex behavioral transitions. c,d. the data in Figure 4c separated to the two birds. e,f. The fraction in panels c,d expected by the null hypothesis of correlations distributing by the frequency of each phrase type among Nphrases phrases in the dataset. g. In sequence-correlated ROIs, multi-way ANOVA is used to separate the effect of the preceding and following phrase types on the signal (methods). Pie shows the percent of sequence-correlated ROIs significantly influenced by the past, future, or both phrase identities among N=336 significant ANOVA tests. h. Restricting analysis to complex transitions, more ROIs correlated to the preceding phrase type (blue) than to following (red). This is true in both Naive signal values (left, N=185 tests) and after removing dependencies on phrase durations and time-in-song (right, N=185). (one-sided binomial z-test: ✳: proportion difference 0.33 ± 0.09, Z=6.45, p = 5.5e-11, ‡: proportion difference 0.19 ± 0.09, Z=4.05,p = 2e-5). i. Restricting to phrase types not in complex transitions (N=136 ANOVA tests) reveals more ROIs correlated with the future phrase type but the difference is not significant (left,right n.a.: one-sided binomial z-test, p = 0.14,0.11). j. Figure 4a showed maximum projection images, calculated with de-noised videos (methods). The algorithm, CNMF-E, involves estimating the source ROI shapes, de-convolving spike times as well as estimating the background noise. Here, recreating the maximum projection images with the original fluorescence videos shows the background as well but the preceding-context-sensitive neurons remain the same. Namely, the same ROI footprints annotated in panels i-iv show the color bias (cyan or red) that indicates coding of the past phrase with the same color.
Extended Data Fig. 9 |
Extended Data Fig. 9 |. ROIs reflecting several preceding song contexts.
a,b. ROIs active in multiple preceding contexts. (Δf/f0)denoised traces are aligned to a specific phrase onset, arranged by identity of preceding phrase (color barcode). White ticks indicate phrase onsets. Box plot shows distributions of (Δf/f0)denoised integrals (y-axis, summation in the phrase marked by ★) for various song contexts (x-axis). F-number, p-value, and effect size (η2(95% CI)) show the significance of separation by song context (1-way ANOVA) and ✳ marks contexts that lead to larger mean activity compared to another context (Tukey’s multiple comparisons, N=41 songs p=0.01,7.5e-6,5.6e-5 in a, N=19, p=8.8e-7,8.15e-8 in b). Average maximum projection images (methods) during the aligned phrase compare the song contexts that lead to significantly higher activity to the other contexts in orthogonal colors (cyan and red for high and low activity). Bar is 50μm. c-e. Neurons with similar context preference like the examples in panels a,b in adjacent days. (Tukey’s multiple comparisons: N=44, p=0.001,4.08e-6,1.3e-6 in c. N=45, p=0.0016,2.85e-6 in d. N=30, p=0.0002,0.0001 in e). f. Fraction of ROIs with selectivity for one context (purple) or multiple contexts (red) identified using Tukey’s post-hoc multiple comparisons (methods). Grey slices (n.a.) mark context-sensitive ROIs for which the post-hoc analysis did not isolate a specific context with larger mean signal. Top (bottom) pie shows selectivity for 1st (2nd) preceding phrases.
Extended Data Fig. 10 |
Extended Data Fig. 10 |. HVC neurons can be tuned to complementary preceding contexts.
a. Four jointly-recorded ROIs exhibit complementary context selectivity. Color bars indicate phrase identities preceding and following a fixed phrase (pink). For each ROI (rasters), (Δf/f0)denoised traces are aligned to the onset of the pink phrase (x-axis) arranged by the identity of the preceding phrase, by the following phrase and finally by the duration of pink phrase. b. For the example in (a), normalized mutual information between the identity of past (P) and future (F) phrase types is significantly smaller than the information held by the network states about the past and future contexts (left bars. N is the 4-ROIs activity). Dots, bars, and red lines mark bootstrap assessment shuffles, their mean, and the 95% level of the mean in shuffled data (methods). *: difference is 0.09 ± 0.03, Z =4.3, p=7.3e-6, **: difference is 0.26 ± 0.02, Z=8.9, p< 1e-15, bootstrapped one-sided z-test. c. Signal integrals from the 4 ROIs in panel a are plotted for each song (dots, N=54 songs) on the 3 most informative principle components. Dots are colored by the identity of the preceding phrase. Clustering accuracy measures the ‘leave-one-out’ label prediction for each preceding phrase (true positive), calculated by assigning each dot to the nearest centroid (L2). Dashed line marks chance level. d. Similar to panel c but for the 1st following phrase.
Figure 1 |
Figure 1 |. Long range syntax rules in canary song.
a. Two example spectrograms of canary song. Colored bars indicate different phrases assembled from basic elements called syllables. Both examples contain a common phrase transition (orange to pink) but differ in the preceding and following phrases. b. A summary of all phrase sequences containing this common transition reveals that the choice of what to sing after the pink phrase depends on the phrases that were produced earlier. Lines represent phrase identity and duration. Song sequences are stacked (vertical axis) sorted by the identity of the 1st phrase, the last phrase and then the center phrases’ duration. Pie charts show the frequency of phrases that follow the pink phrase, calculated in the subset of songs that share a preceding sequence context (separated by dashed lines). In the pie chart, grey represents the song end, and other colors represent a phrase pictured in the first panel. The pink phrase precedes a 3rd order ‘complex transition’; the likelihood that a particular phrase will follow it is dependent on transitions three phrases in the past. c. Percent of phrases that precede complex transitions of different orders in N=5 birds (dots). Bars and error bars show mean and SE.
Figure 2 |
Figure 2 |. HVC projection neuron activity reflects long-range phrase sequence information.
a. Fluorescence (Δf/f0) of multiple ROIs during a singing bout reveals sparse, phrase-type-specific activity. Phrase types are color coded in the audio amplitude trace, and dashed lines mark phrase onsets. Context-dependent ROIs show larger phrase-specific signal in one context (blue frames) than another (connected red frames). b. Experimental paradigm. Miniature microscopes were used to image GCaMP6f-expressing neurons in HVC, transduced via lentivirus injection. c. Most ROIs are phrase-type-specific. Neural activity is aligned to the onset of phrases. These phrases have long (left) and short (right) syllables and traces are sorted (y-axis) by the phrase duration. White ticks indicate phrase onsets. Pie shows fractions of ROIs that are active during just one, two or three phrase types (methods). d. Phrase-type-specific ROI activity that is strongly related to 2nd upstream phrase identity. Neural activity is aligned to the onset of the current phrase. Songs are arranged by the ending phrase identity (right, color patches), then by the phrase sequence context (left, color patches), and then by duration of the pink phrase. White ticks indicate phrase onsets. e. Cells reveal more information about past events than future events. 307 different ROIs had 398 significant correlations with adjacent (1st order, 2 left bars) and non-adjacent (≥2nd order, 2 right bars) phrases. The correlations are separated by phrases that precede (P) or follow (F) the phrase, during which the signal is integrated. Empty bars mark transition-locked representations (methods, Extended Data Fig. 7d). 2-sided binomial z-test evaluate significant differences (✳: proportion differences 0.2 ± 0.08, 0.34 ± 0.11, Z=4.82,5.31, p=1.39e-6, 1.065e-7 for 1st and ≥2nd order).
Figure 3|
Figure 3|. Sequence-correlated HVC neurons reflect within-phrase timing.
a. Activity of context-sensitive ROIs (y-axis, bar marks 50 rows) is time-warped to fixed phrase edges (x-axis, white lines) and averaged across repetitions of short-syllable phrases. Traces are ordered by their peak timing to reveal the span of the phrase time frame. b,c. Example raw Δf/f0 traces (y-axis, vertical bars equal 0.1) of 8 ROIs during phrase types that precede (b) and follow (c) the complex transition in Figure 1. Traces are aligned to phrase onsets (green line, sonograms show the syllables) and panels show ROIs with various onset timing across the phrase. Red lines and blue box plots show the median, range, and quartiles of the phrase offset timing (top to bottom: N = 70,23,55,39,40,38,50,31 phrases summarized by the box plots). d. Histograms showing the distribution of peak timing (left), onset timing (middle) and signal durations (right) of the activity in panel a relative to the phrase edges (dashed lines).
Figure 4 |
Figure 4 |. Sequence-correlated HVC neurons reflect preceding context up to four phrases apart and show enhanced activity during context-dependent transitions.
a. A sequence of four phrases (i-iv, color coded) is preceded by two upstream phrase types (red or cyan). Average maximum projection denoised images (methods) are calculated in each sequence context during each phrase in the sequence (i-iv) and overlaid in complementary colors (red, cyan) to reveal context-preferring neurons. Scale bar is 50 μm. b. (Δf/f0)denoised rasters for the ROIs in panel (a). Songs are ordered by the preceding phrase type (colored bars). Extended Data Fig. 8a shows the statistical significance of song context relations. c. Fraction of sequence-correlated ROIs found in complex transitions. Pie charts separate 1st order and higher order (≥2nd) sequence correlations. Dark grey summarizes the total fraction for two birds. Purple shows fractions expected from sequence correlates uniformly-distributed in all phrase types.

Comment in

  • Canaries record song history.
    Bray N. Bray N. Nat Rev Neurosci. 2020 Sep;21(9):450-451. doi: 10.1038/s41583-020-0351-x. Nat Rev Neurosci. 2020. PMID: 32669661 No abstract available.

References

    1. Markowitz JE, Ivie E, Kligler L & Gardner TJ Long-range Order in Canary Song. PLOS Comput Biol 9, e1003052 (2013). - PMC - PubMed
    1. Nottebohm F, Stokes TM & Leonard CM Central control of song in the canary, Serinus canarius. J. Comp. Neurol 165, 457–486 (1976). - PubMed
    1. Hahnloser RHR, Kozhevnikov AA & Fee MS An ultra-sparse code underlies the generation of neural sequences in a songbird. Nature 419, 65–70 (2002). - PubMed
    1. Long MA & Fee MS Using temperature to analyse temporal dynamics in the songbird motor pathway. Nature 456, 189–194 (2008). - PMC - PubMed
    1. Rokni U, Richardson AG, Bizzi E & Seung HS Motor learning with unstable neural representations. Neuron 54, 653–666 (2007). - PubMed

Publication types