. 2020 Jul;583(7818):862-866.
doi: 10.1038/s41586-020-2419-1. Epub 2020 Jun 17.

Molecular basis of β-arrestin coupling to formoterol-bound β1-adrenoceptor

Affiliations

Molecular basis of β-arrestin coupling to formoterol-bound β1-adrenoceptor

Yang Lee et al. Nature. 2020 Jul.

Abstract

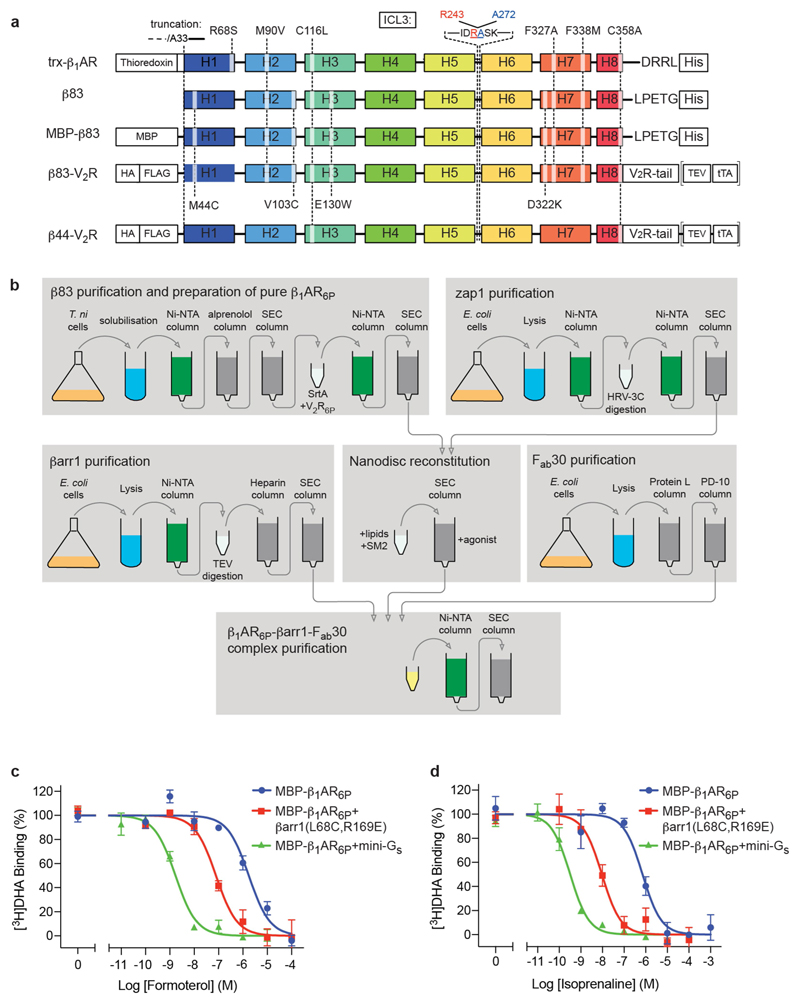
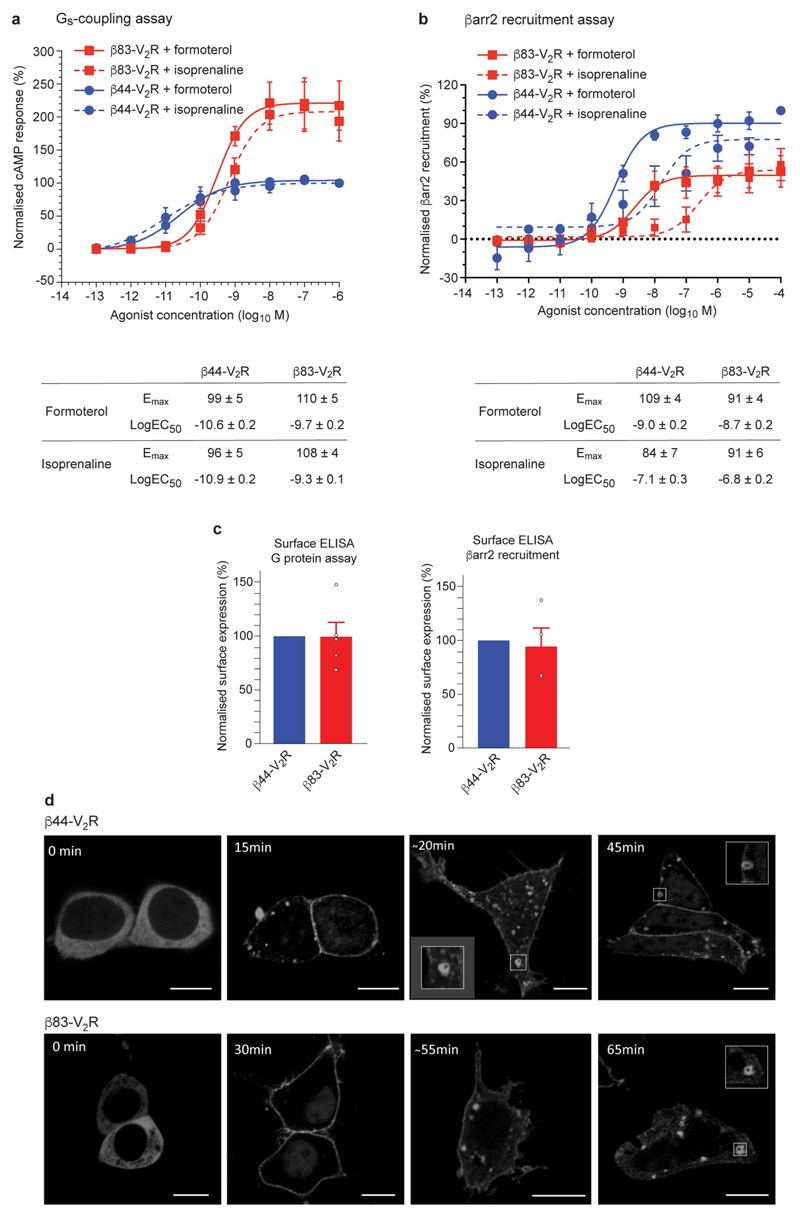
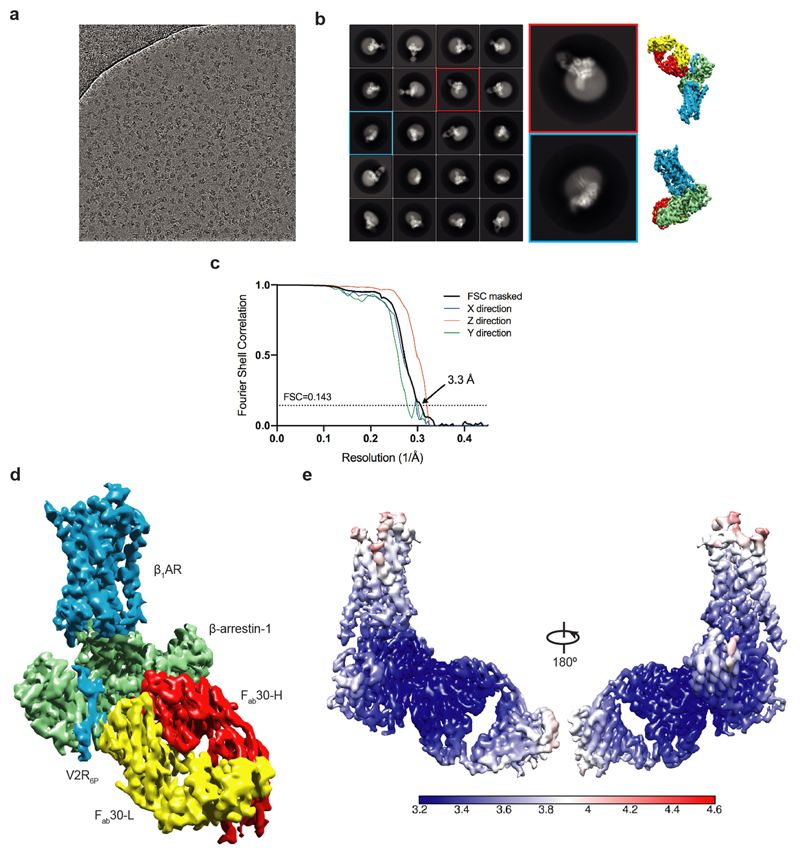
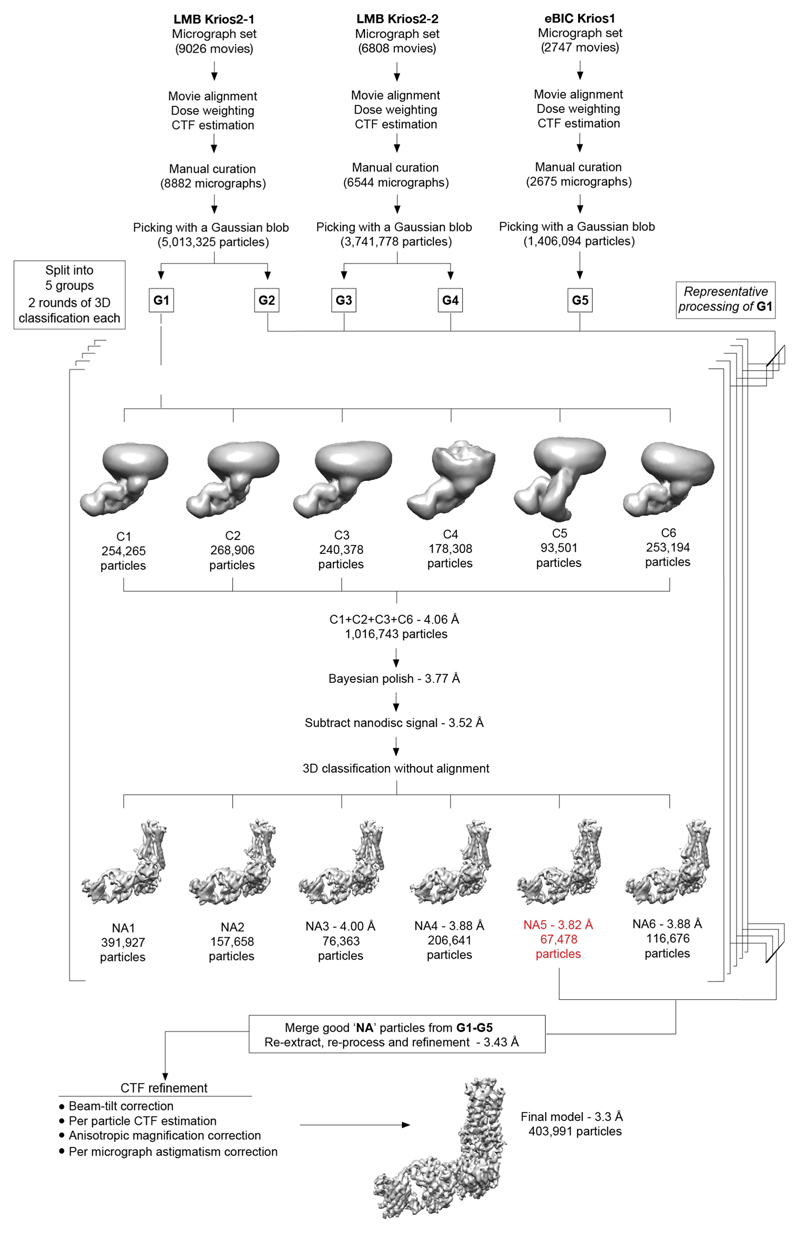
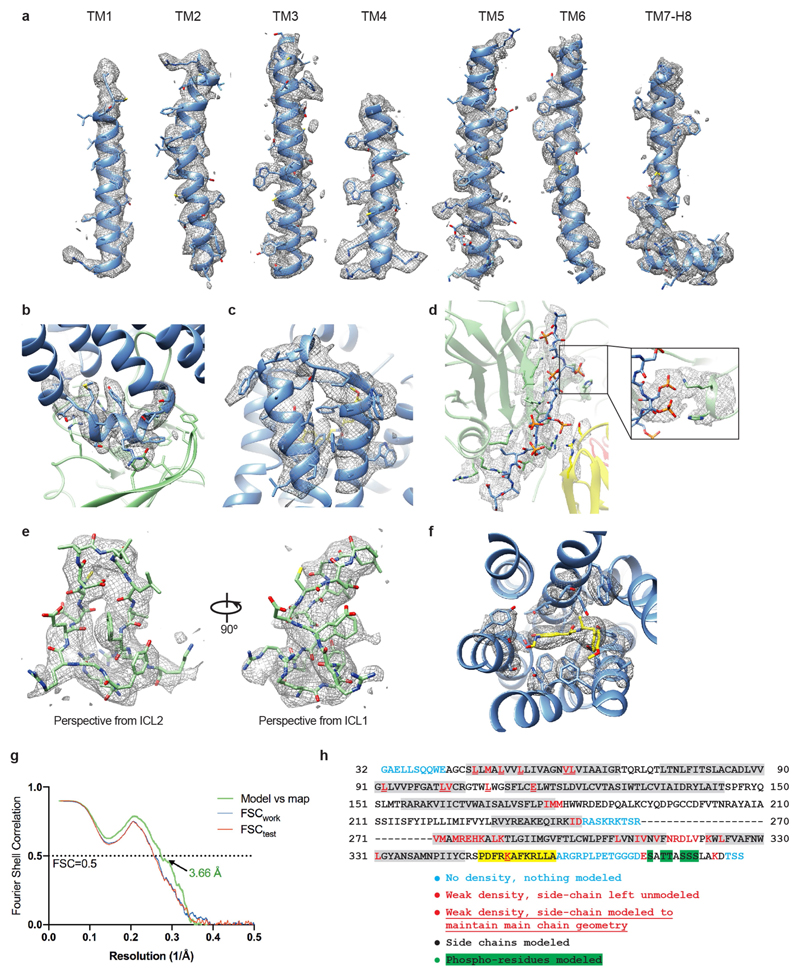
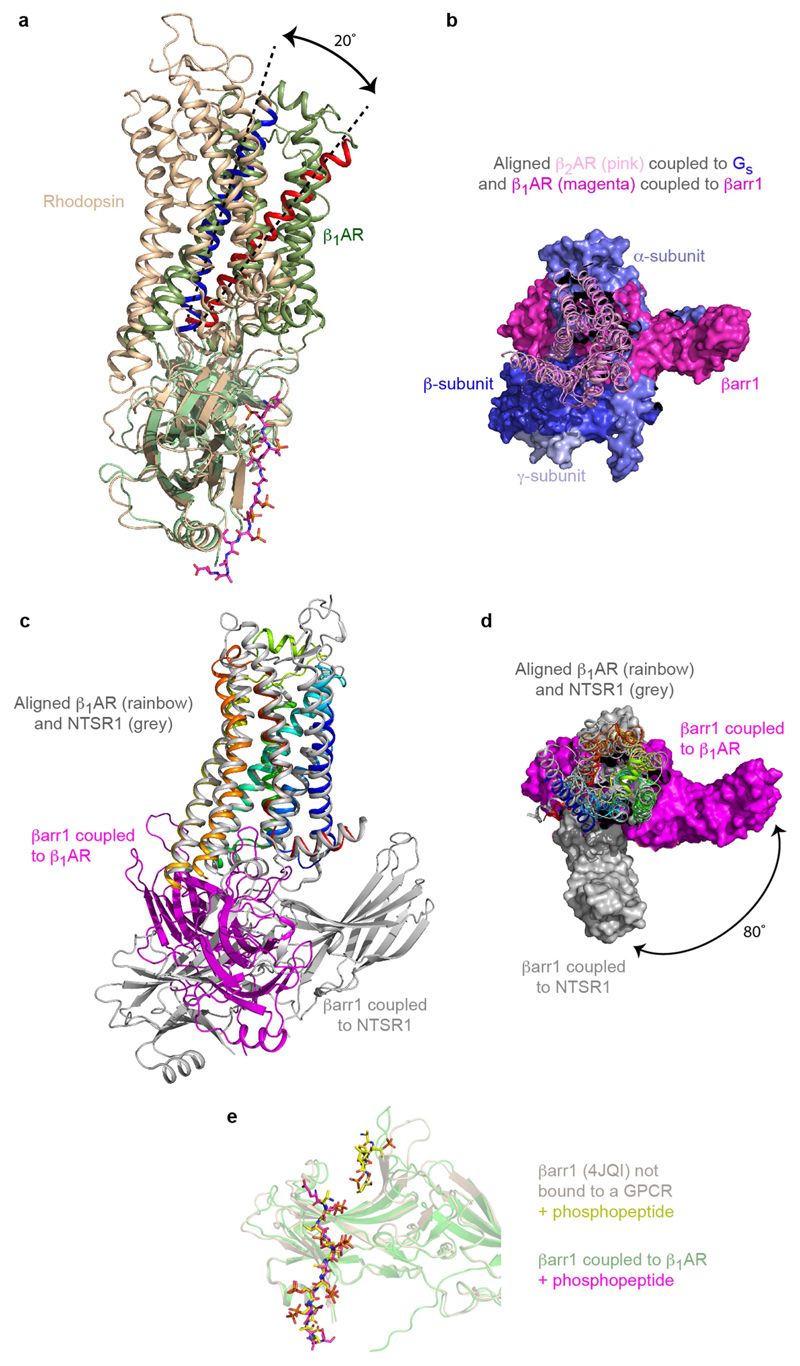
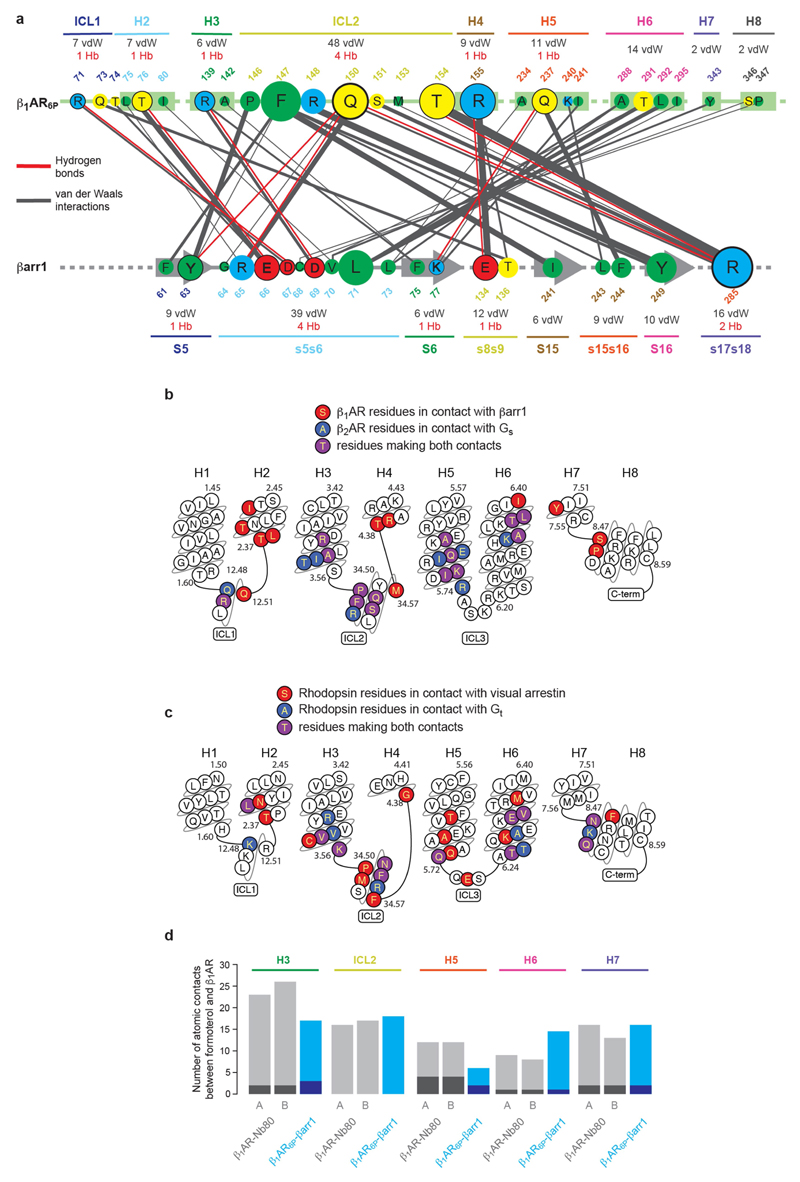
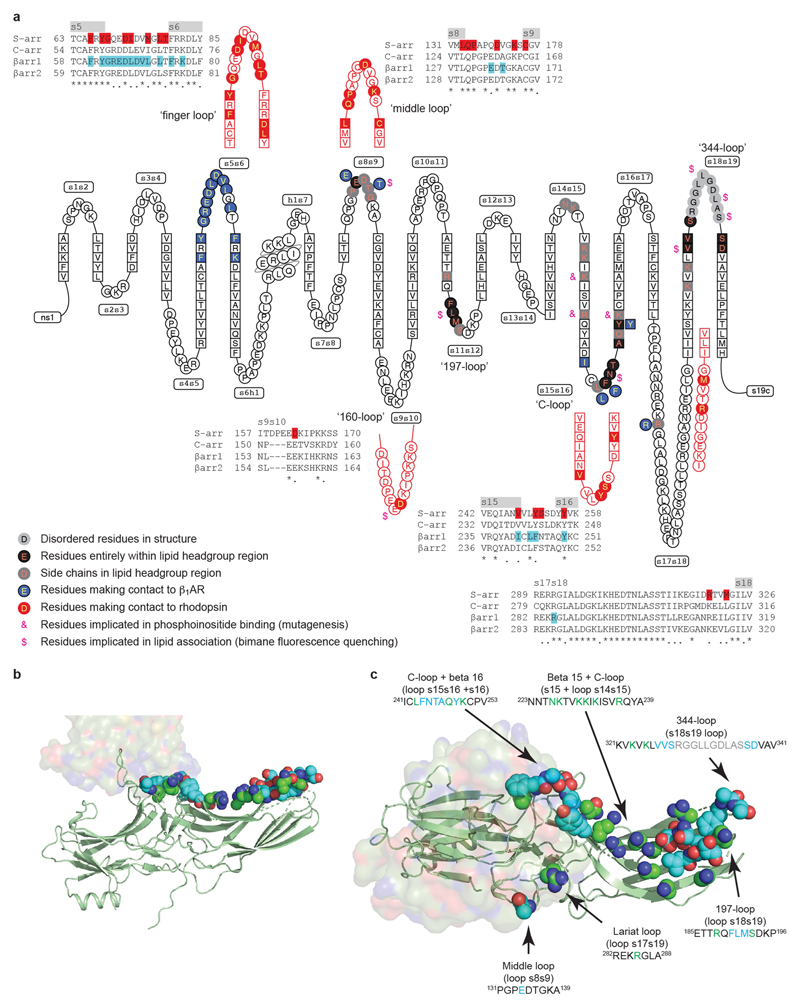
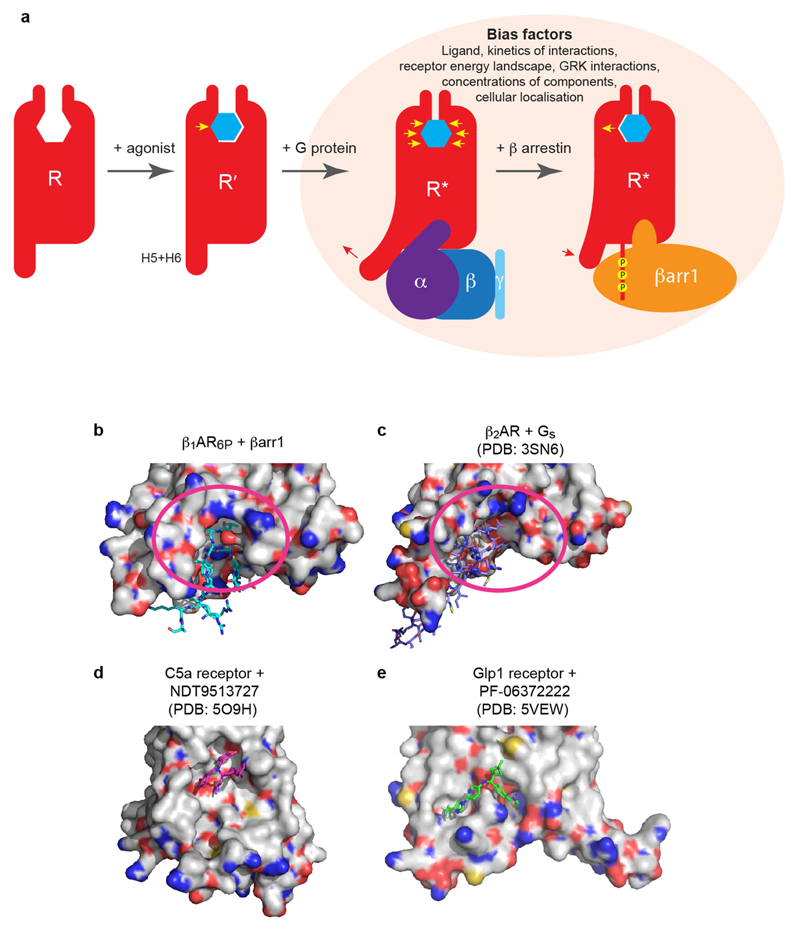
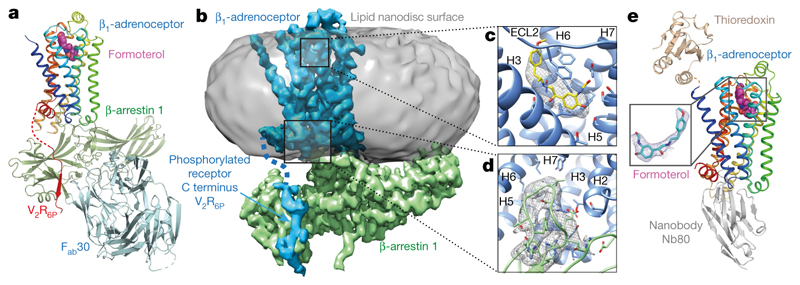
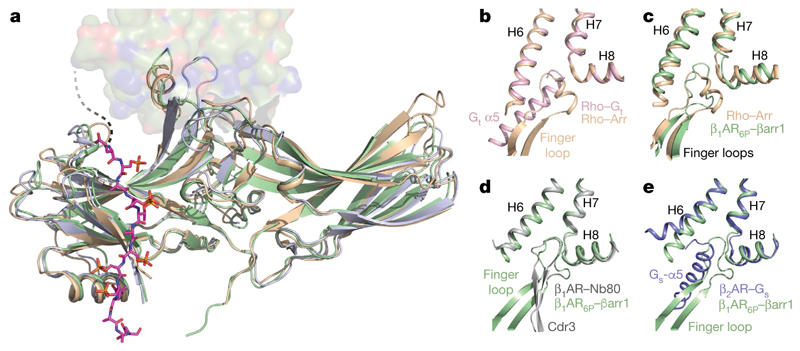
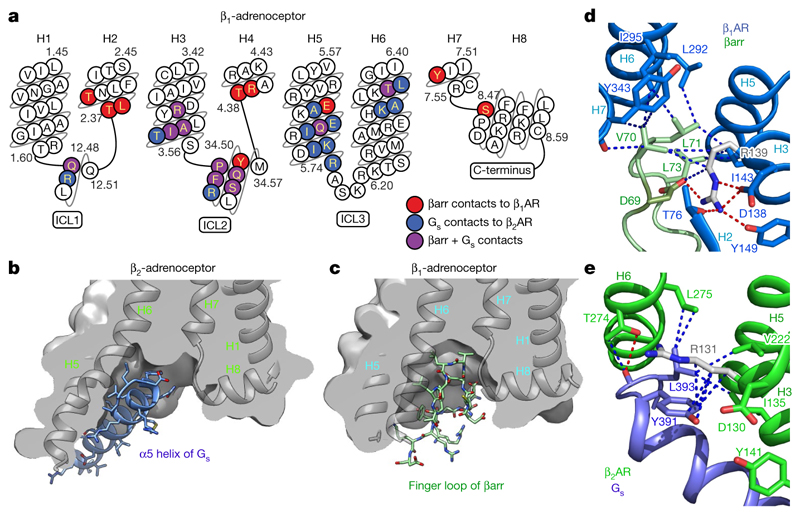
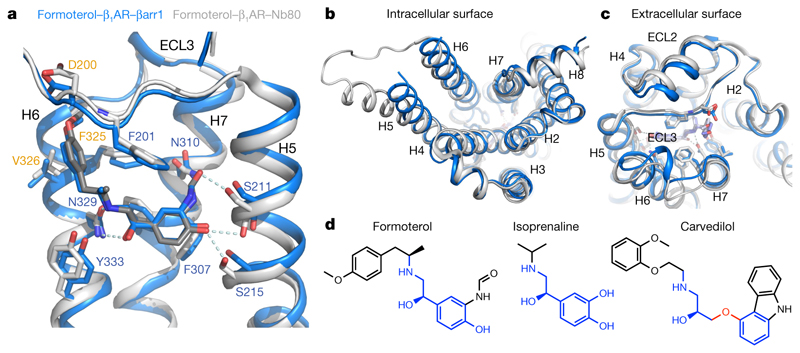
The β1-adrenoceptor (β1AR) is a G-protein-coupled receptor (GPCR) that couples1 to the heterotrimeric G protein Gs. G-protein-mediated signalling is terminated by phosphorylation of the C terminus of the receptor by GPCR kinases (GRKs) and by coupling of β-arrestin 1 (βarr1, also known as arrestin 2), which displaces Gs and induces signalling through the MAP kinase pathway2. The ability of synthetic agonists to induce signalling preferentially through either G proteins or arrestins-known as biased agonism3-is important in drug development, because the therapeutic effect may arise from only one signalling cascade, whereas the other pathway may mediate undesirable side effects4. To understand the molecular basis for arrestin coupling, here we determined the cryo-electron microscopy structure of the β1AR-βarr1 complex in lipid nanodiscs bound to the biased agonist formoterol5, and the crystal structure of formoterol-bound β1AR coupled to the G-protein-mimetic nanobody6 Nb80. βarr1 couples to β1AR in a manner distinct to that7 of Gs coupling to β2AR-the finger loop of βarr1 occupies a narrower cleft on the intracellular surface, and is closer to transmembrane helix H7 of the receptor when compared with the C-terminal α5 helix of Gs. The conformation of the finger loop in βarr1 is different from that adopted by the finger loop of visual arrestin when it couples to rhodopsin8. β1AR coupled to βarr1 shows considerable differences in structure compared with β1AR coupled to Nb80, including an inward movement of extracellular loop 3 and the cytoplasmic ends of H5 and H6. We observe weakened interactions between formoterol and two serine residues in H5 at the orthosteric binding site of β1AR, and find that formoterol has a lower affinity for the β1AR-βarr1 complex than for the β1AR-Gs complex. The structural differences between these complexes of β1AR provide a foundation for the design of small molecules that could bias signalling in the β-adrenoceptors.


Conflict of interest statement

Competing interests C.G.T. is a shareholder, consultant and member of the scientific advisory board of Sosei Heptares, who also partly funded this work.

Figures

Extended Data Fig. 1
Extended Data Fig. 1. β1AR constructs, purification and activity.
a, Schematic of the constructs used for X-ray crystallography (trx-β1AR), cryo-EM (β83), radioligand binding (MBP-β83) and cell-based assays (β44–V2R, β83–V2R), indicating the sites of truncations, point mutations and tags. b, Purification scheme for the preparation of the β1AR6P–βarr1–Fab30 complex for structure determination by cryo-EM. c, d, Representative competition binding curves using either formoterol (c) or isoprenaline (d) show the high-affinity state of MBP–β1AR6P stabilized by either mini-Gs or βarr1. Experiments (Methods) to determine the high-affinity state were performed in a molar excess of mini-Gs (green curves; n = 2) or βarr1 (red curves; n = 3 with formoterol, n = 4 with isoprenaline) and compared to the low-affinity state (blue curves; n = 4). Experiments were all performed in duplicate, with the number of independent experiments indicated (n). Data are mean ± s.e.m. The apparent K i values were determined using the Cheng–Prusoff equation, using apparent K d values for [3H]DHA of 6 nM (MBP–β1AR6P and MBP–β1AR6P + βarr1) and 1.5 nM (MBP–β1AR6P + mini-Gs). K i values for formoterol are 1.5 ± 0.4 µM (MBP–β1AR6P), 42 ± 18 nM (MBP–β1AR6P + βarr1) and 0.7 ± 0.1 nM (MBP–β1AR6P + mini-Gs). K i values for isoprenaline are 340 ± 70 nM (MBP–β1AR6P), 4.4 ± 0.8 nM (MBP–β1AR6P + βarr1) and 0.13 ± 0.02 nM (MBP–β1AR6P + mini-Gs).
Extended Data Fig. 2
Extended Data Fig. 2. Functional characterization of β1AR construct β83 in cells.
a, HEK293 cells expressing the two β1AR constructs β44–V2R (blue circles) and β83–V2R (red squares) together with the cAMP sensor 22F (GloSensor assay) were stimulated with the indicated concentrations of isoprenaline (dashed line) or formoterol (solid line). Subsequently, the luminescence readings were recorded and normalized with respect to the signal at the maximal dose of isoprenaline for β44–V2R (treated as 100%). The results are from four independent experiments of duplicate measurements, data are mean ± s.e.m. The maximum effect (E max) and half-maximal effective concentration (EC50) were calculated by nonlinear regression (GraphPad Prism), data are mean ± s.e.m. b, HTLA cells expressing the β44–V2R (blue circles) and β83–V2R (red squares) Tango assay constructs (Methods) were stimulated with indicated concentrations of isoprenaline and formoterol, and the luminescence readings were recorded 8 h post-stimulation. Afterwards, the data were normalized with respect to the signal at the maximal dose of isoprenaline for β44–V2R (treated as 100%). Results are from five independent experiments of a duplicate measurement, data are mean ± s.e.m. E max and EC50 values were calculated by nonlinear regression (GraphPad Prism), data are mean ± s.e.m. c, Surface expression of β44–V2R and β83–V2R constructs in cells used for assays in a, b were measured by whole-cell ELISA using anti-Flag M2 antibody. Data are normalized with respect to β44–V2R (blue bars; treated as 100%). Values for p83–V2R are as follows: ELISA for G-protein assay, 99% ± 13% (n = 5); ELISA for arrestin assay, 94% ± 17% (n = 4). Experiments were performed in duplicate with the number of independent experiments indicated (n), data are mean ± s.e.m. d, HEK293 cells expressing β44–V2R and β83–V2R together with βarr1–mYFP were stimulated with 100 µM formoterol for the indicated times and the localization of βarr1–mYFP was monitored using live-cell confocal microscopy. Representative images from three independent experiments are shown. Scale bars, 10 µm.
Extended Data Fig. 3
Extended Data Fig. 3. Cryo-EM single-particle reconstruction of the β1AR–βarr1‒Fab30 complex.
a, Representative micrograph (LMB-Krios2, magnification 105,000×, defocus –1.9 µm) of the β1AR6P–βarr1–Fab30 complex collected using a Titan Krios with the GIF Quantum K2 detector. b, Representative 2D class averages of the β1AR6P–βarr1–Fab30 complex determined using approximately 1 million particles after 3D classification. Copies of the final reconstruction are juxtaposed to indicate relative orientations. c, FSC curve of the final reconstruction (black) showing an overall resolution of 3.3 Å using the gold standard FSC of 0.143. The directional 3D-FSC curves calculated from the two half maps are shown in colour. d, Final reconstruction coloured by polypeptides (contour level 0.023). e. Local resolution estimation of the β1AR6P–βarr1–Fab30 map as calculated by Relion.
Extended Data Fig. 4
Extended Data Fig. 4. Flow chart of cryo-EM data processing.
Micrographs were collected during three sessions on a Titan Krios (between 48-h and 96-h long) using a 30° stage tilt to improve particle orientation distribution. Each dataset was corrected separately for drift, beam-induced motion and radiation damage. After focus gradient and CTF estimation, particles were picked using a Gaussian blob. At this stage, each of the LMB Krios2 datasets was split into two halves by micrographs, generating a total of five groups of particles. Each group was processed and curated independently. The number of particles from group G1 is indicated on the flowchart as a guide. At the bottom of the figure, the final number of particles is shown. Particles were submitted to two rounds of 3D classification using an ab initio model as a reference. In each round, classification was performed in six classes. The models with the best features were merged and refined together before correcting for per-particle beam-induced motion. Subtracted particles were generated by removing most of the non-receptor nanodisc signal and refined. 3D classification without alignment was performed in six classes using a mask encompassing the entire complex. The models showing the best features were refined either individually or in combination. The quality of the models was judged on the basis of both resolution and map features and weighed against the size of the contributing particle set (the resolution of the models refers to the resolution after refinement and calculation of gold-standard FSC of 0.143). The best particles from each group were merged and re-extracted. After merging, the combined particle set was processed together except at the stage of per-particle beam-induced motion correction, at which particles were split into their session-stacks for Bayesian polishing. Particles were assigned to one of 19 optical groups (Methods) and corrected iteratively for beam-tilt, per-micrograph astigmatism, anisotropic magnification and per-particle CTF estimation. A final model with 403,991 particles was refined and achieved a global resolution of 3.3 Å.
Extended Data Fig. 5
Extended Data Fig. 5. Cryo-EM map quality of the β1AR6P–βarr1–Fab30 complex and model validation.
Unless otherwise stated, density maps were visualized using Chimera (contour level 0.017) and encompass a radius of 2 Å around the region of interest. a, Transmembrane helices of β1AR6P with density shown as a mesh. b, ICL2 of β1AR6P. For clarity, the neighbouring βarr1 side chains are depicted without density. c, ECL3 of β1AR6P and the adjacent helical turns of H6 and H7. d, The phosphorylated V2R6P C terminus. Inset, interaction between the V2R6P phospho-threonine dyad and the βarr1 lariat loop. Density in the inset is depicted with contour level 0.01 (carve radius 2 Å). e, The finger loop of βarr1. f, Formoterol and the neighbouring side chains in the orthosteric binding site. g, FSC of the refined model versus the map (green curve), and FSCwork and FSCfree validation curves (blue and red curves, respectively). h, Amino acid sequence of the β1AR6P construct used for the cryo-EM structure determination. The residues are numbered according to the wild-type sequence of β1AR. Residues are coloured according to how they have been modelled (key). Regions highlighted in grey represent the transmembrane α-helices, amphipathic helix 8 is highlighted in yellow, and phosphorylated residues are highlighted in green. The dashes represent amino acid residues that were deleted.
Extended Data Fig. 6
Extended Data Fig. 6. Comparison of arrestin coupled to different GPCRs.
a, Superposition of arrestin molecules in the complexes of β1AR6P–βarr1 (green) and rhodopsin–arrestin (pale brown). The different angle between the respective receptors and coupled arrestins is shown by the 20° difference in tilt of H3 (blue, H3 in rhodopsin; red, H3 in β1AR). b, Superposition of β1AR6P and β2AR (pink and purple cartoons, respectively) coupled to either βarr1 (magenta surface) or Gs (blue and purple surfaces), respectively. c, Superposition of β1AR6P (rainbow cartoon) and NTSR1 (grey cartoon) coupled to βarr1 (magenta) and βarr1 (grey), respectively. d, Alignment in c viewed from the membrane surface and the respective molecules of βarr shown in surface representation. e, Superposition of the active state of βarr1 (pale brown; PDB ID: 4JQI) not bound to receptor and βarr1 (green) coupled to β1AR6P. The phosphopeptides are shown as sticks: yellow carbon atoms, V2Rpp in 4JQI; magenta carbon atoms, V2R6P in the β1AR6P–βarr1 complex.
Extended Data Fig. 7
Extended Data Fig. 7. β1AR6P–βarr1 and formoterol–β1AR6P contacts, and comparison with other complexes.
a, interactions between amino acid residues in β1AR6P and βarr1. The size of the circle depicting the residue is proportional to the number of van der Waals interactions (grey lines) and hydrogen bonds (red lines) made, with residues in circles outlined in black making potential hydrogen bonds. Secondary structure elements are shown with the total number of interactions they make. The thickness of lines making contacts is proportional to the number of contacts made. b, Residues are depicted in β1AR6P that make contact (≤3.9 Å) with βarr1 (red) and residues in β2AR (PDB ID: 3SN6) that make contact to Gs (blue); purple residues make contacts in both structures. The sequence of turkey β1AR is depicted. c, Residues in human rhodopsin that make contact with either visual arrestin or transducin (Gt). Plots were made using GPCRdb. d, The number of atomic contacts between the ligand formoterol and secondary structure elements in β1AR is depicted; grey bars, β1AR–Nb80 complex; blue bars, β1AR6P–βarr1 complex. Light regions correspond to the number of van der Waals interactions and dark regions correspond to the number of hydrogen bonds. Data for chain A and chain B in the crystal unit cell of the β1AR–Nb80 complex are shown separately (A and B).
Extended Data Fig. 8
Extended Data Fig. 8. Comparison of the visual arrestin and βarr1 interfaces with GPCRs and lipids.
a, A snake plot (GPCRdb) of human βarr1 depicts the secondary structure elements in the protein, with amino acid residues that make contact with β1AR coloured blue. Equivalent regions in mouse visual arrestin (S-arr) that make contact to rhodopsin are shown in red. Alignments of human arrestins show the variation of amino acid sequences within these specific regions, with residues that make contact to the respective receptors highlighted. Highlighted are residues equivalent to those in visual arrestin that have been shown by mutagenesis to interact with phosphoinositides by mutagenesis (&) or to interact with the lipid bilayer by bimane fluorescence quenching ($). b, c, β1AR6P is depicted in surface representation and βarr1 as a cartoon (green) with atoms predicted to be within the head group region of the lipid bilayer shown as spheres: oxygen, red; nitrogen, blue; carbon, green or cyan. Residues coloured cyan are predicted to be entirely within the lipid head group region, while the carbons coloured green are the portions of these side chains that are potentially interacting with lipid head groups. b, c, View of the lipid-interacting surface viewed parallel to the membrane plane (b) and through the receptor (c).
Extended Data Fig. 9
Extended Data Fig. 9. Conformational changes in β1AR and potential drug-interaction sites to discriminate between complexes of β-adrenoceptors coupled to either βarr1 or Gs.
a, The inactive state (R) of β1AR binds agonist (blue hexagon) resulting in an inward movement of H5 in the orthosteric binding pocket (yellow arrow), to form an intermediate state (R′). Coupling of G protein results in outward movement of the cytoplasmic ends of H5 and H6 (red arrow) and contraction of the orthosteric binding site (yellow arrows). Displacement of G protein by arrestin results in an inward movement of the cytoplasmic ends of H5 and H6 (red arrow) and an outward movement of H5 in the orthosteric biding pocket (yellow arrow). Receptors in the R* state have higher affinity for agonists than those in the R state. Representative structures of each of the states depicted have been determined, but in reality there is likely to be a continuum of states between them. Several factors probably affect the arrestin bias of ligands, not just the structure of the receptor–arrestin complex. b, Surface view of β1AR6P showing the finger loop of βarr1 (sticks). c, Surface view of β2AR showing the α5 helix of Gs (sticks). In b, c, potential druggable sites are depicted (magenta oval) in b and c that could be used to develop small molecules that discriminate between the same receptor coupled to either βarr1 or Gs. d, e, Two examples of small-molecule negative allosteric modulators that bind to the surface of GPCRs, which give a proof of concept to the surface-interacting molecules.
Fig. 1
Fig. 1. Overall cryo-EM reconstruction of the β1AR6P–βarr1 complex.
a, Overall structure of the β1AR6P–βarr1–Fab30 complex containing bound formoterol (magenta). b, The density of the cryo-EM map (sharpened with a B factor of –80 Å2) is coloured according to polypeptides (β1AR6P, blue; βarr1, green) and overlaid on the density of the nanodisc (grey). Fab30 has been omitted from the structure for clarity (Extended Data Fig. 3). c, The orthosteric binding pocket of β1AR6P (pale blue) with formoterol (shown as sticks: carbon, yellow; oxygen, red; nitrogen, blue) and its density in the cryo-EM map (grey mesh). d, The finger loop of βarr1 with side chains shown as sticks (carbon, light green) and its density in the cryo-EM map (grey mesh). Helix 8 of β1AR6P has been removed for clarity. Maps were contoured at 0.02 (2 Å carve radius in b, c) and visualized in Chimera. e, Crystal structure of the β1AR–Nb80 complex. β1AR, rainbow colouration; Nb80, grey; thioredoxin, brown; formoterol, magenta spheres (carbon); water molecules, red spheres. The inset shows an omit map of formoterol in the β1AR–Nb80 complex contoured at (blue mesh).
Fig. 2
Fig. 2. Structure of βarr1 in complex with β1AR6p.
a, βarr1 (pale green) coupled to β1AR6P (surface representation) was aligned with the structures of visual arrestin (pale brown) coupled to rhodopsin (PDB ID: 5W0P) and the structure of active βarr1 (mauve) bound to the phosphopeptide V2Rpp and Fab30 (PDB ID: 4JQI). The phosphopeptide shown (carbon, magenta) is V2R6P in β1AR6P. Full alignments of the phosphopeptides are shown in Extended Data Fig. 6e. b–e, Details of coupled arrestin finger loops and G protein α5 helices after alignment of the following receptors (PDB code in parentheses) using GESAMT (CCP4 program suite): visual arrestin coupled to rhodopsin (5W0P, pale brown); transducin (Gt) coupled to rhodopsin (6OYA, pale pink); βarr1 coupled to β1AR6P (pale green); Nb80 coupled to β1AR (6IBL, grey); Gs coupled to β2AR (3SN6, blue).
Fig. 3
Fig. 3. Comparison of the receptor-coupling interfaces in the β1AR6P–βarr1 and β2AR–Gs complexes.
a, Snake plot of the intracellular region of turkey β1AR with amino acid residues colour-coded according to interactions: red, contact between β1AR6P and βarr1; blue, contact between β2AR and Gs; purple, both contacts. b, c, Cross-sections through the intracellular halves of β2AR (b) and β1AR6P (c) to highlight the different shapes of the intracellular cleft formed upon coupling of βarr1 compared with Gs. Transmembrane helices are shown for orientation, and are in front of the cross-section. d, Detail of the interface between the βarr1 finger loop (pale green) and β1AR6P (pale blue). e, Detail of the interface between the α5 helix of the Gs α-subunit (blue) and β2AR (green). Depicted in d, e are polar interactions (red dashes), van der Waals interactions (blue dashes; atoms ≤ 3.9 Å apart) and Arg3.50 (shown as sticks: carbon, grey).
Fig. 4
Fig. 4. Differences between formoterol-bound β1AR coupled to either βarr1 or Nb80.
a-c, Superposition of β1AR6P coupled to βarr1 (blue) and β1AR coupled to Nb80 (grey), with residues interacting with the ligand shown as sticks. Residues labelled in orange interact with formoterol but not isoprenaline. d, Structures of arrestin-biased ligands (formoterol, carvedilol) and a balanced agonist (isoprenaline). Regions in blue are identical to adrenaline, and the red region in carvedilol is the oxypropylene linker that is typical of β-adrenoceptor antagonists of the G-protein pathway.

Similar articles

Cited by

References

    1. Evans BA, Sato M, Sarwar M, Hutchinson DS, Summers RJ. Ligand-directed signalling at β-adrenoceptors. Br J Pharmacol. 2010;159:1022–1038. - PMC - PubMed
    1. DeWire SM, Ahn S, Lefkowitz RJ, Shenoy SK. β-arrestins and cell signaling. Annu Rev Physiol. 2007;69:483–510. - PubMed
    1. Smith JS, Lefkowitz RJ, Rajagopal S. Biased signalling: from simple switches to allosteric microprocessors. Nat Rev Drug Discov. 2018;17:243–260. - PMC - PubMed
    1. Kenakin T. Biased receptor signaling in drug discovery. Pharmacol Rev. 2019;71:267–315. - PubMed
    1. Rajagopal S, et al. Quantifying ligand bias at seven-transmembrane receptors. Mol Pharmacol. 2011;80:367–377. - PMC - PubMed

Publication types

MeSH terms