Comparative Study
. 2020 Jul;583(7817):638-643.
doi: 10.1038/s41586-020-2418-2. Epub 2020 Jun 17.

Dynamic RNA acetylation revealed by quantitative cross-evolutionary mapping

Affiliations
Comparative Study

Dynamic RNA acetylation revealed by quantitative cross-evolutionary mapping

Aldema Sas-Chen et al. Nature. 2020 Jul.

Abstract

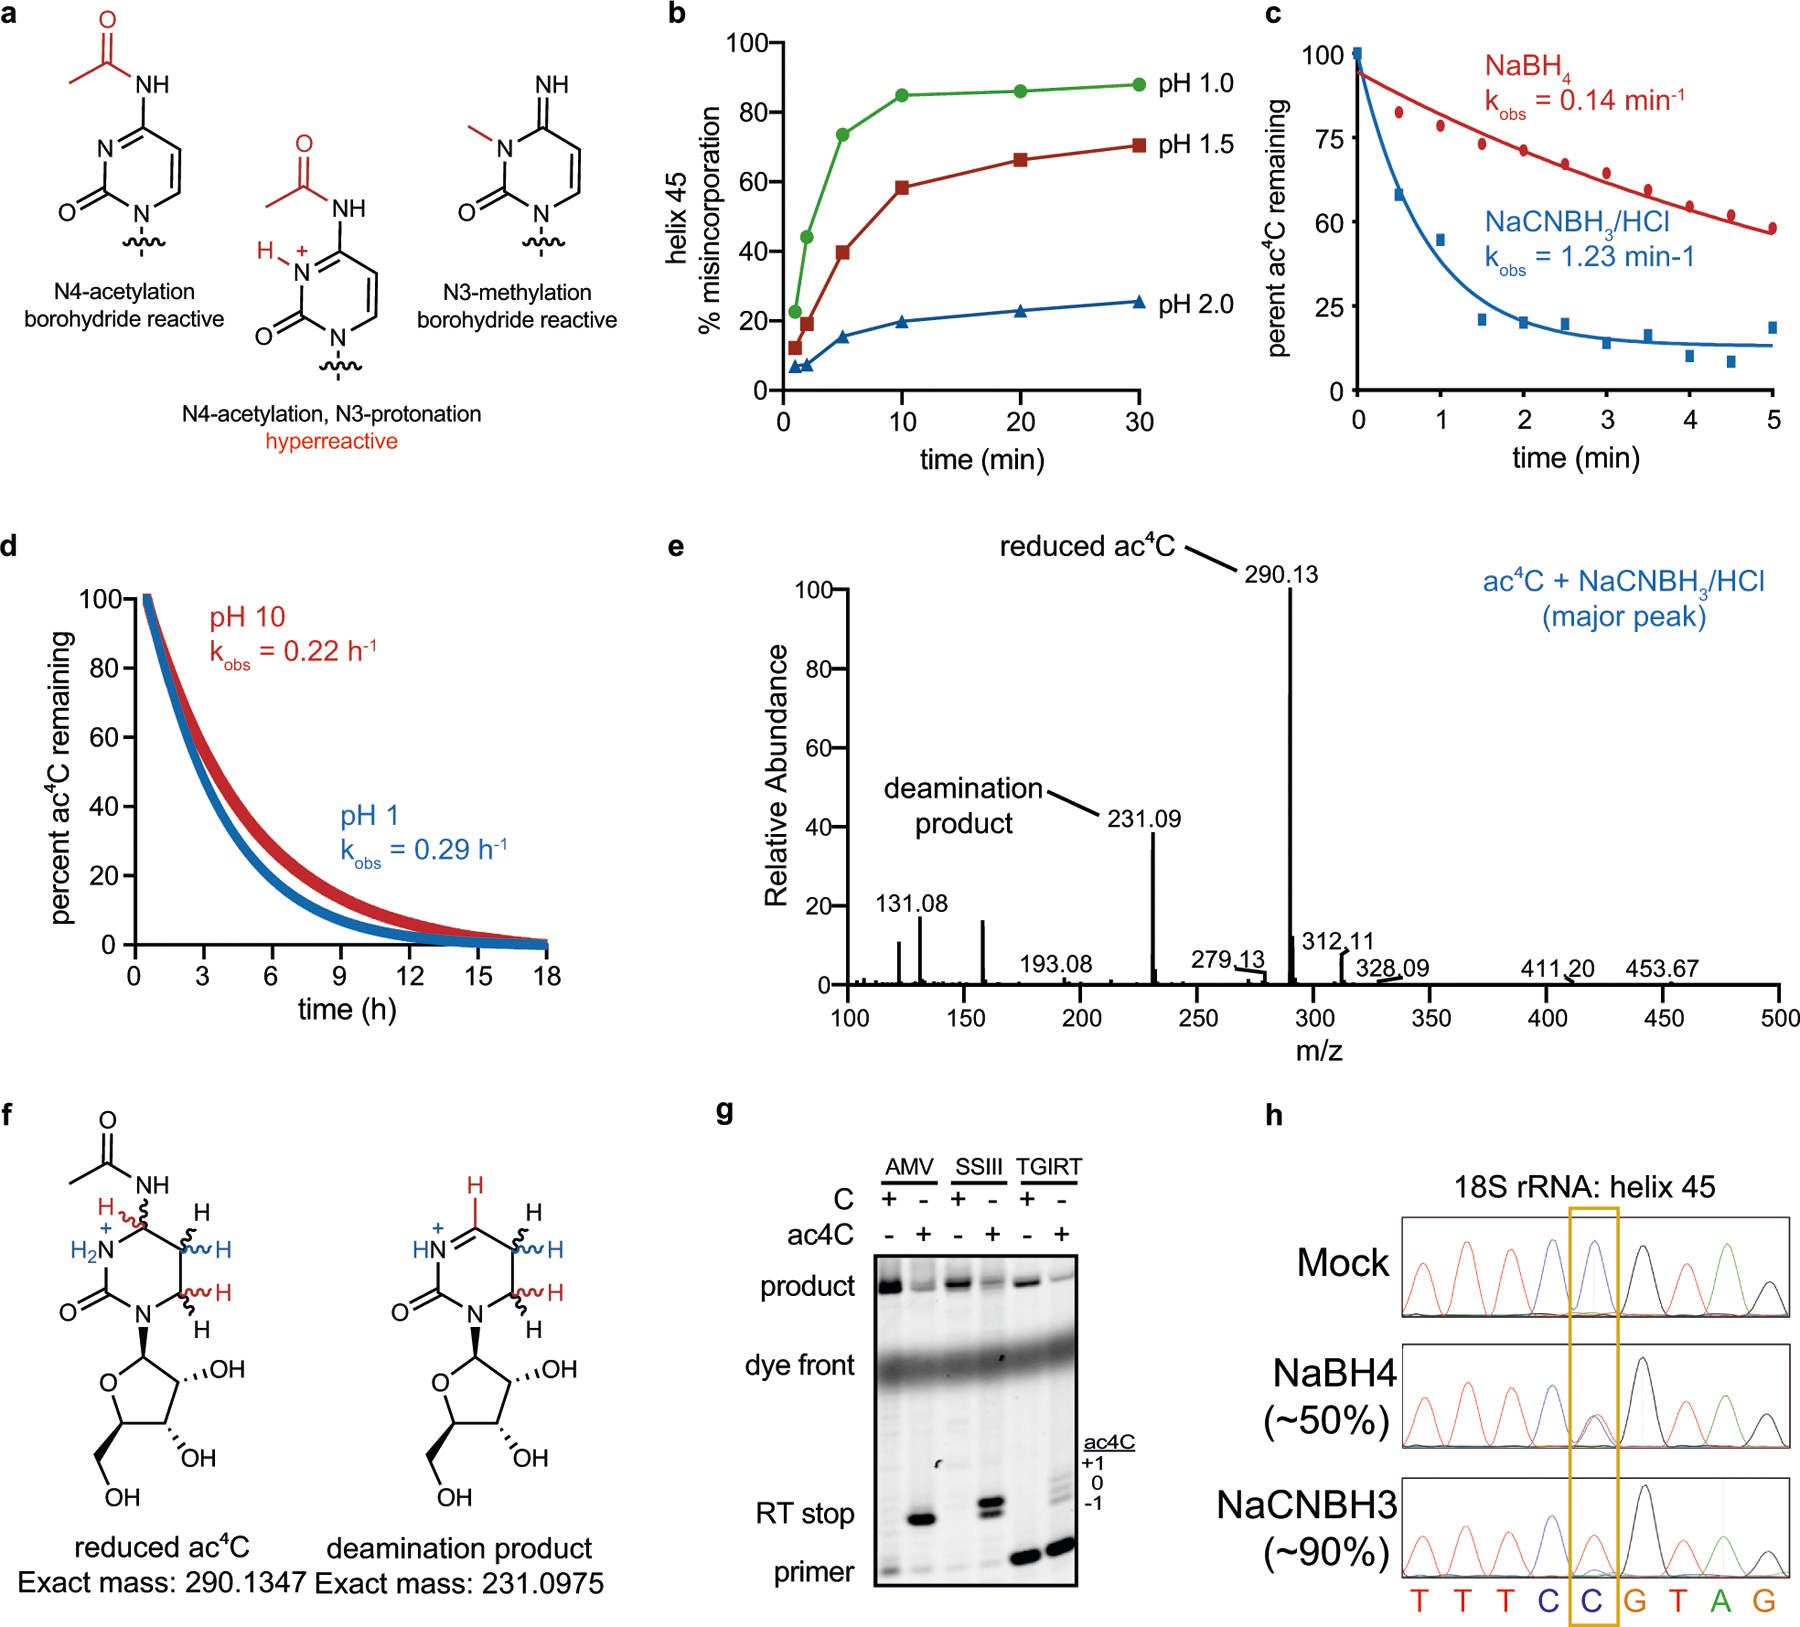
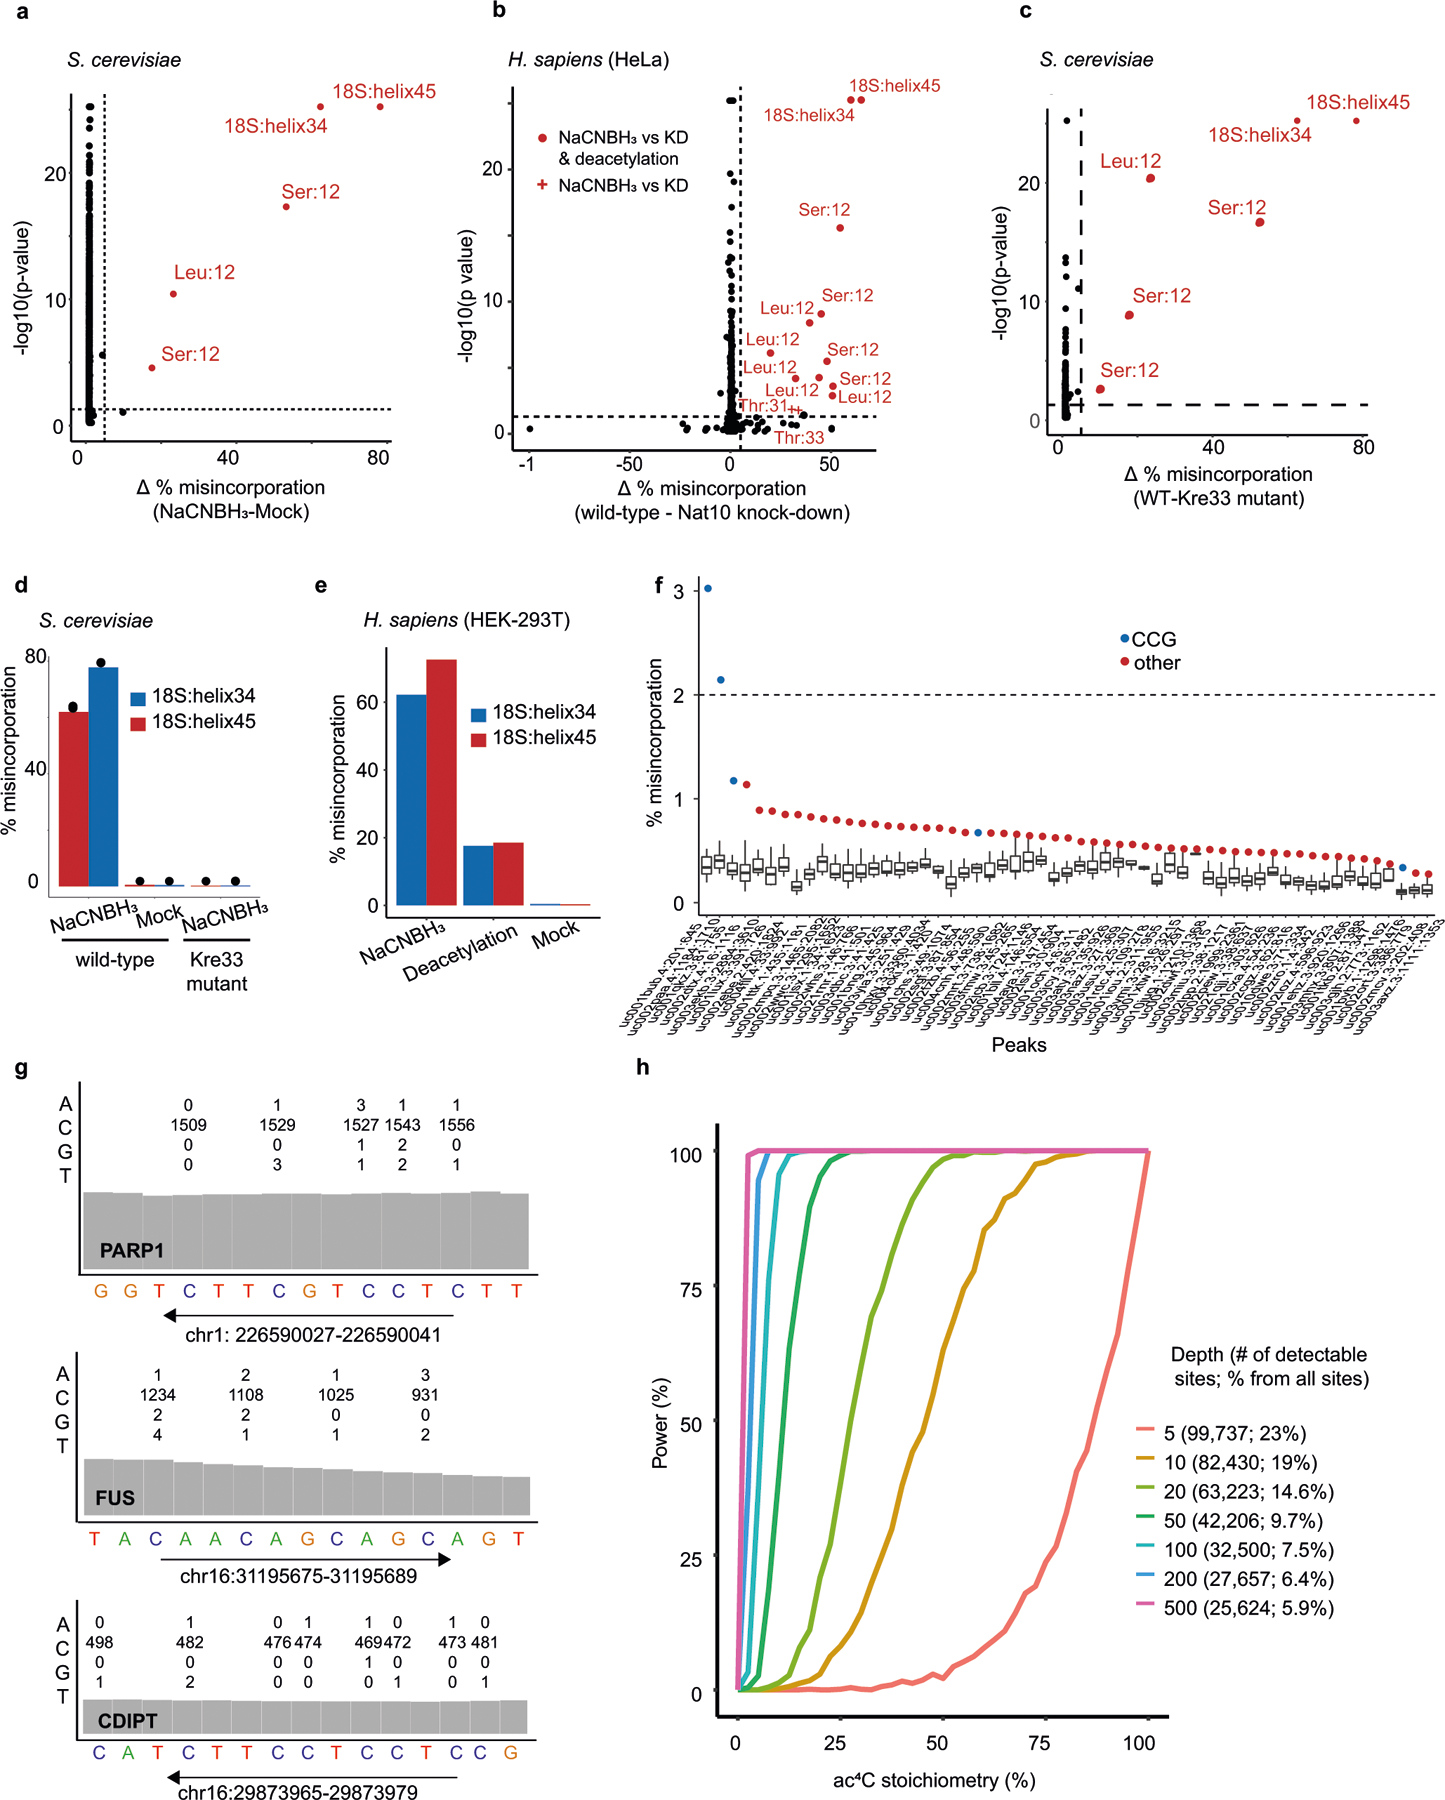
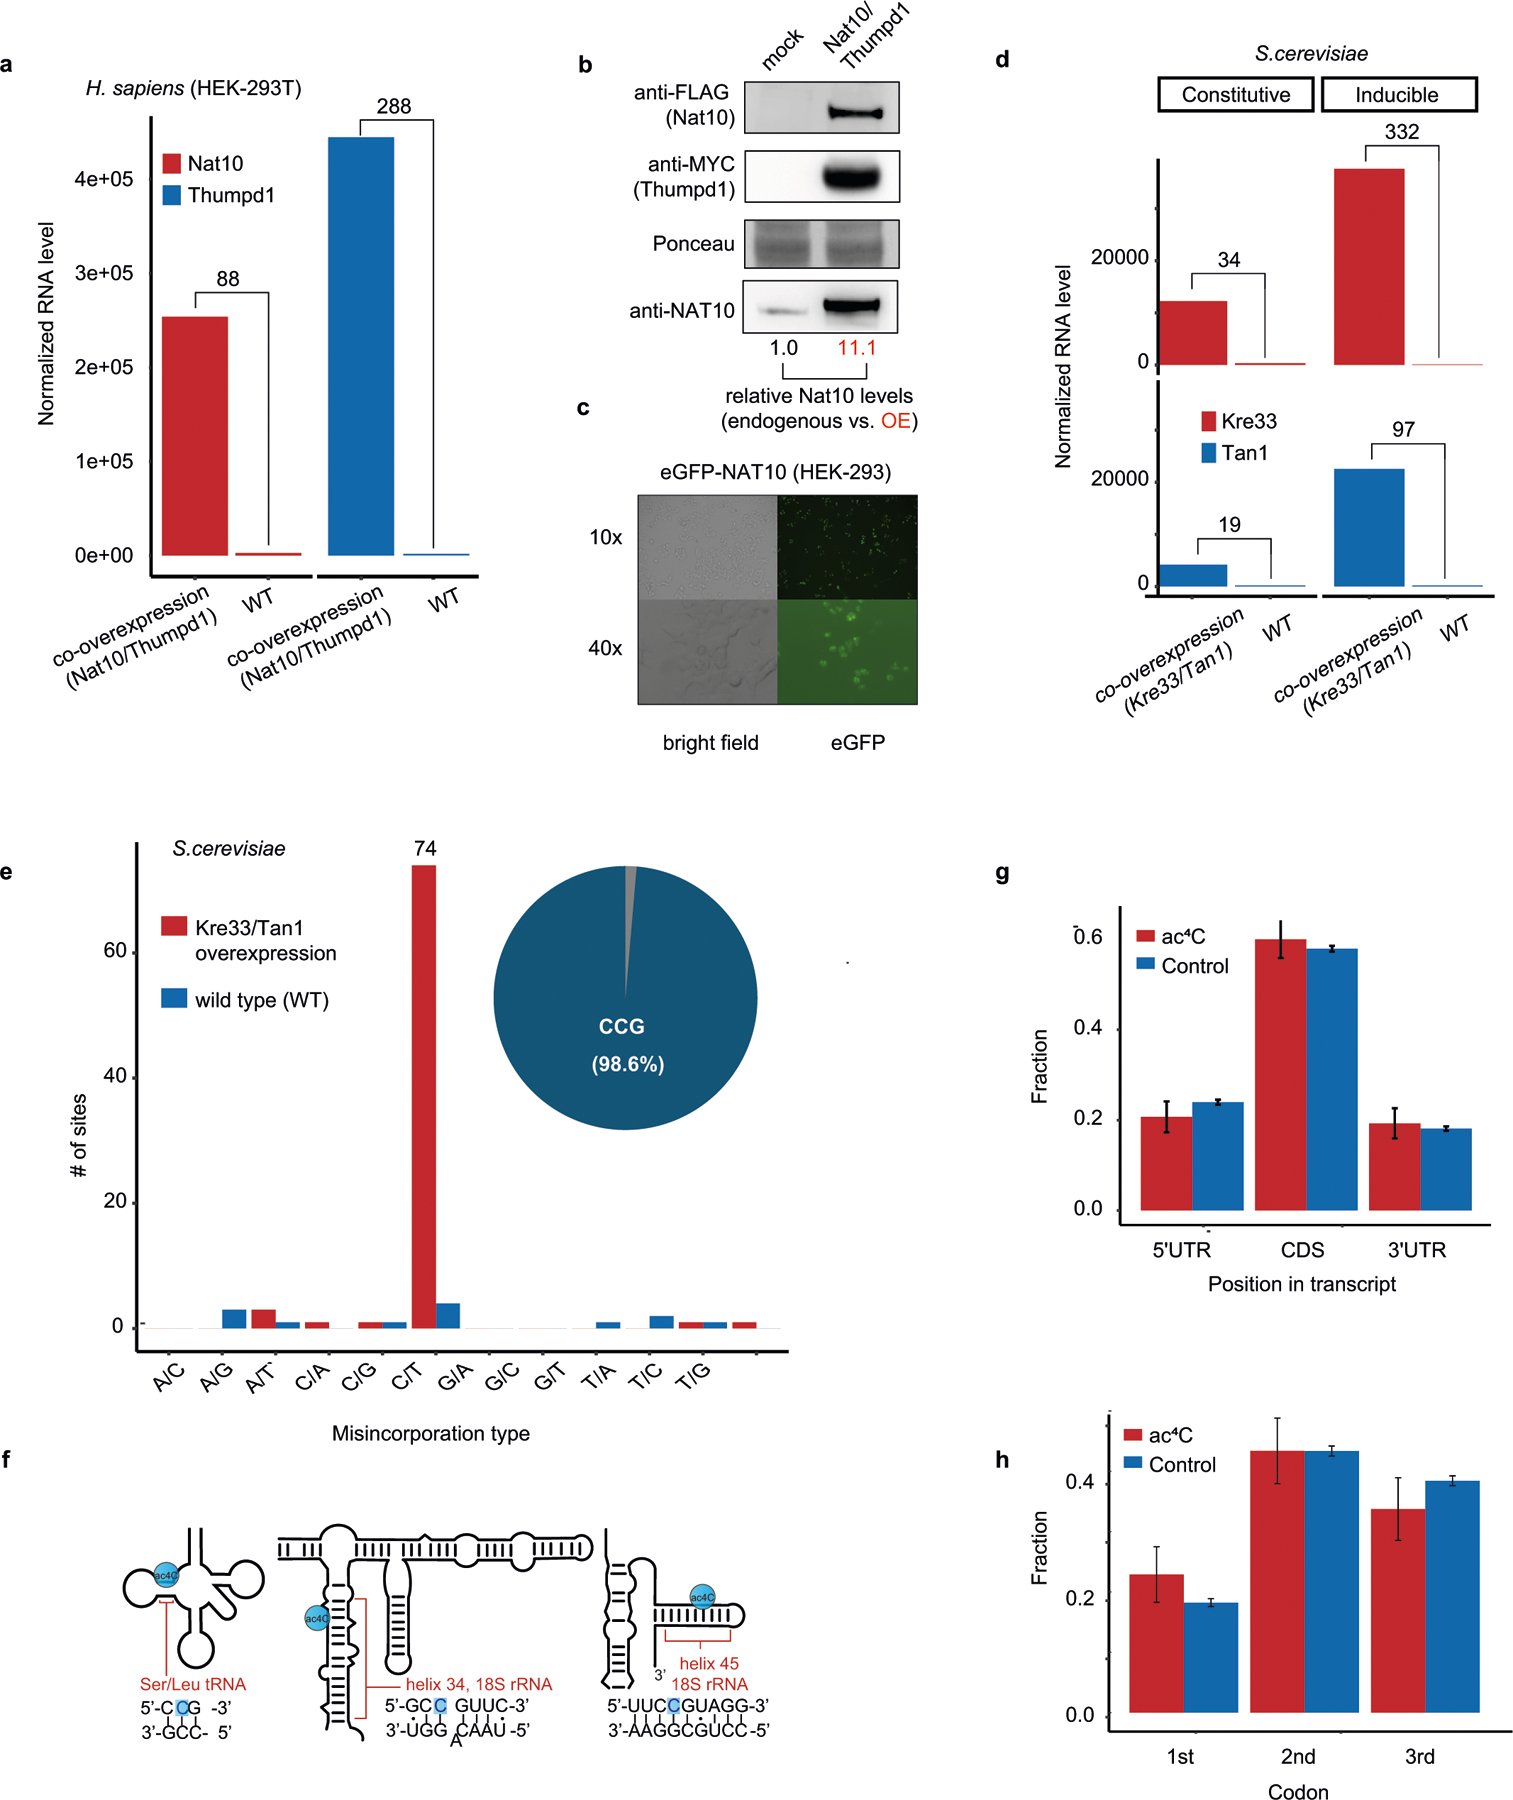
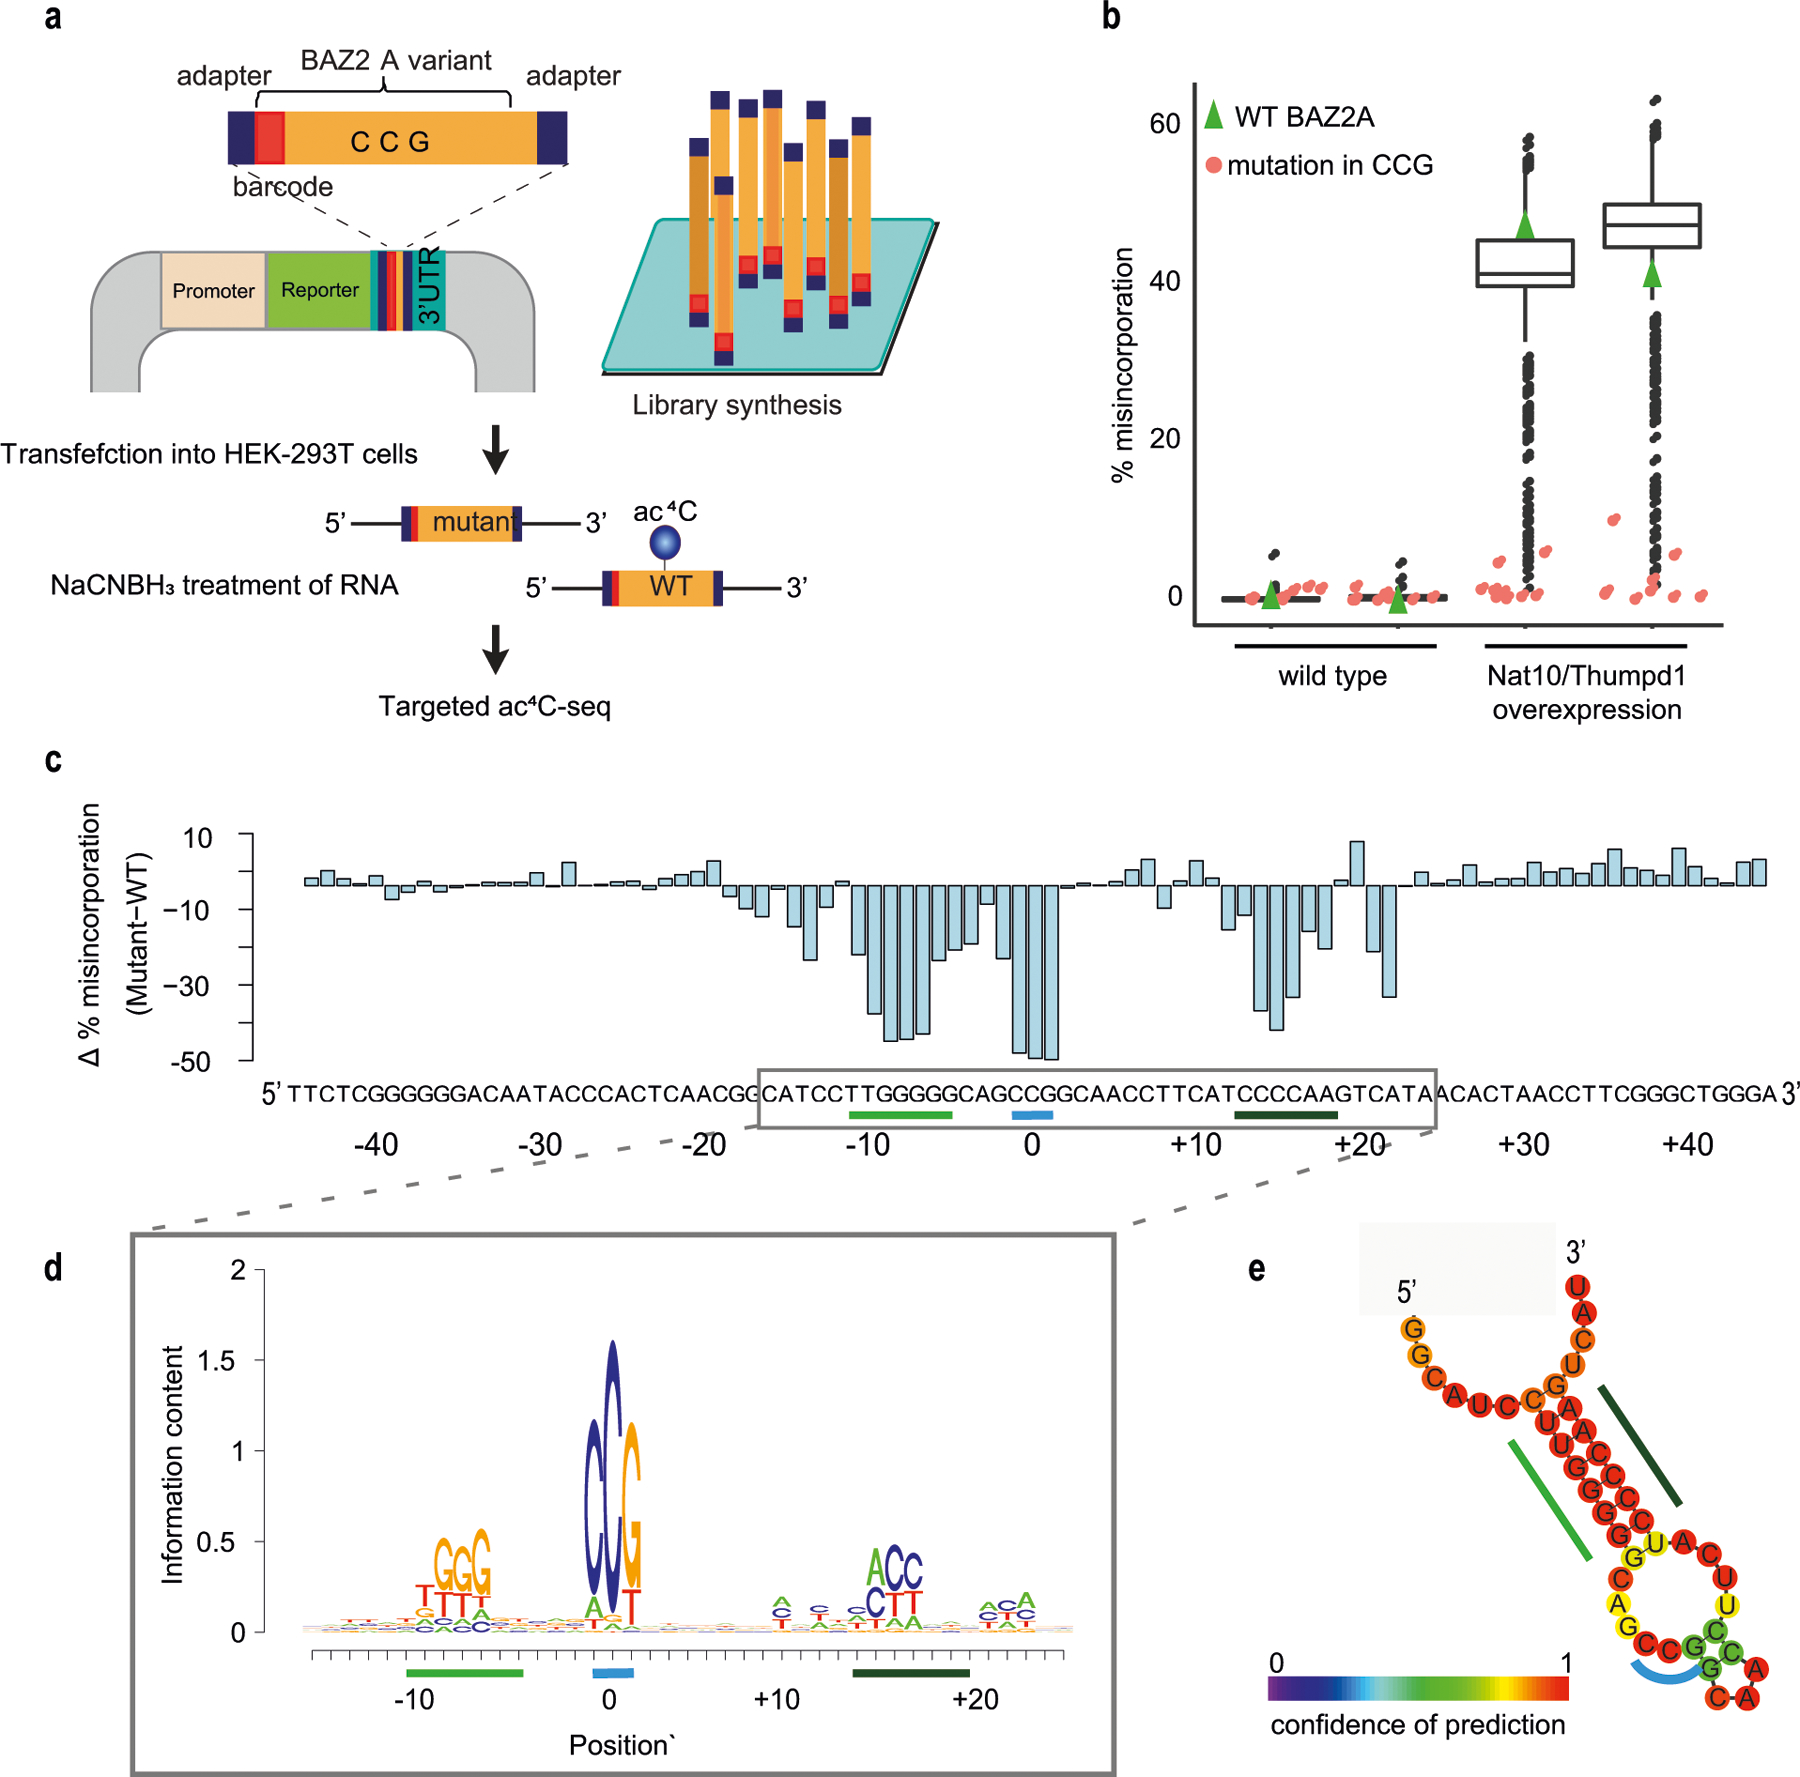
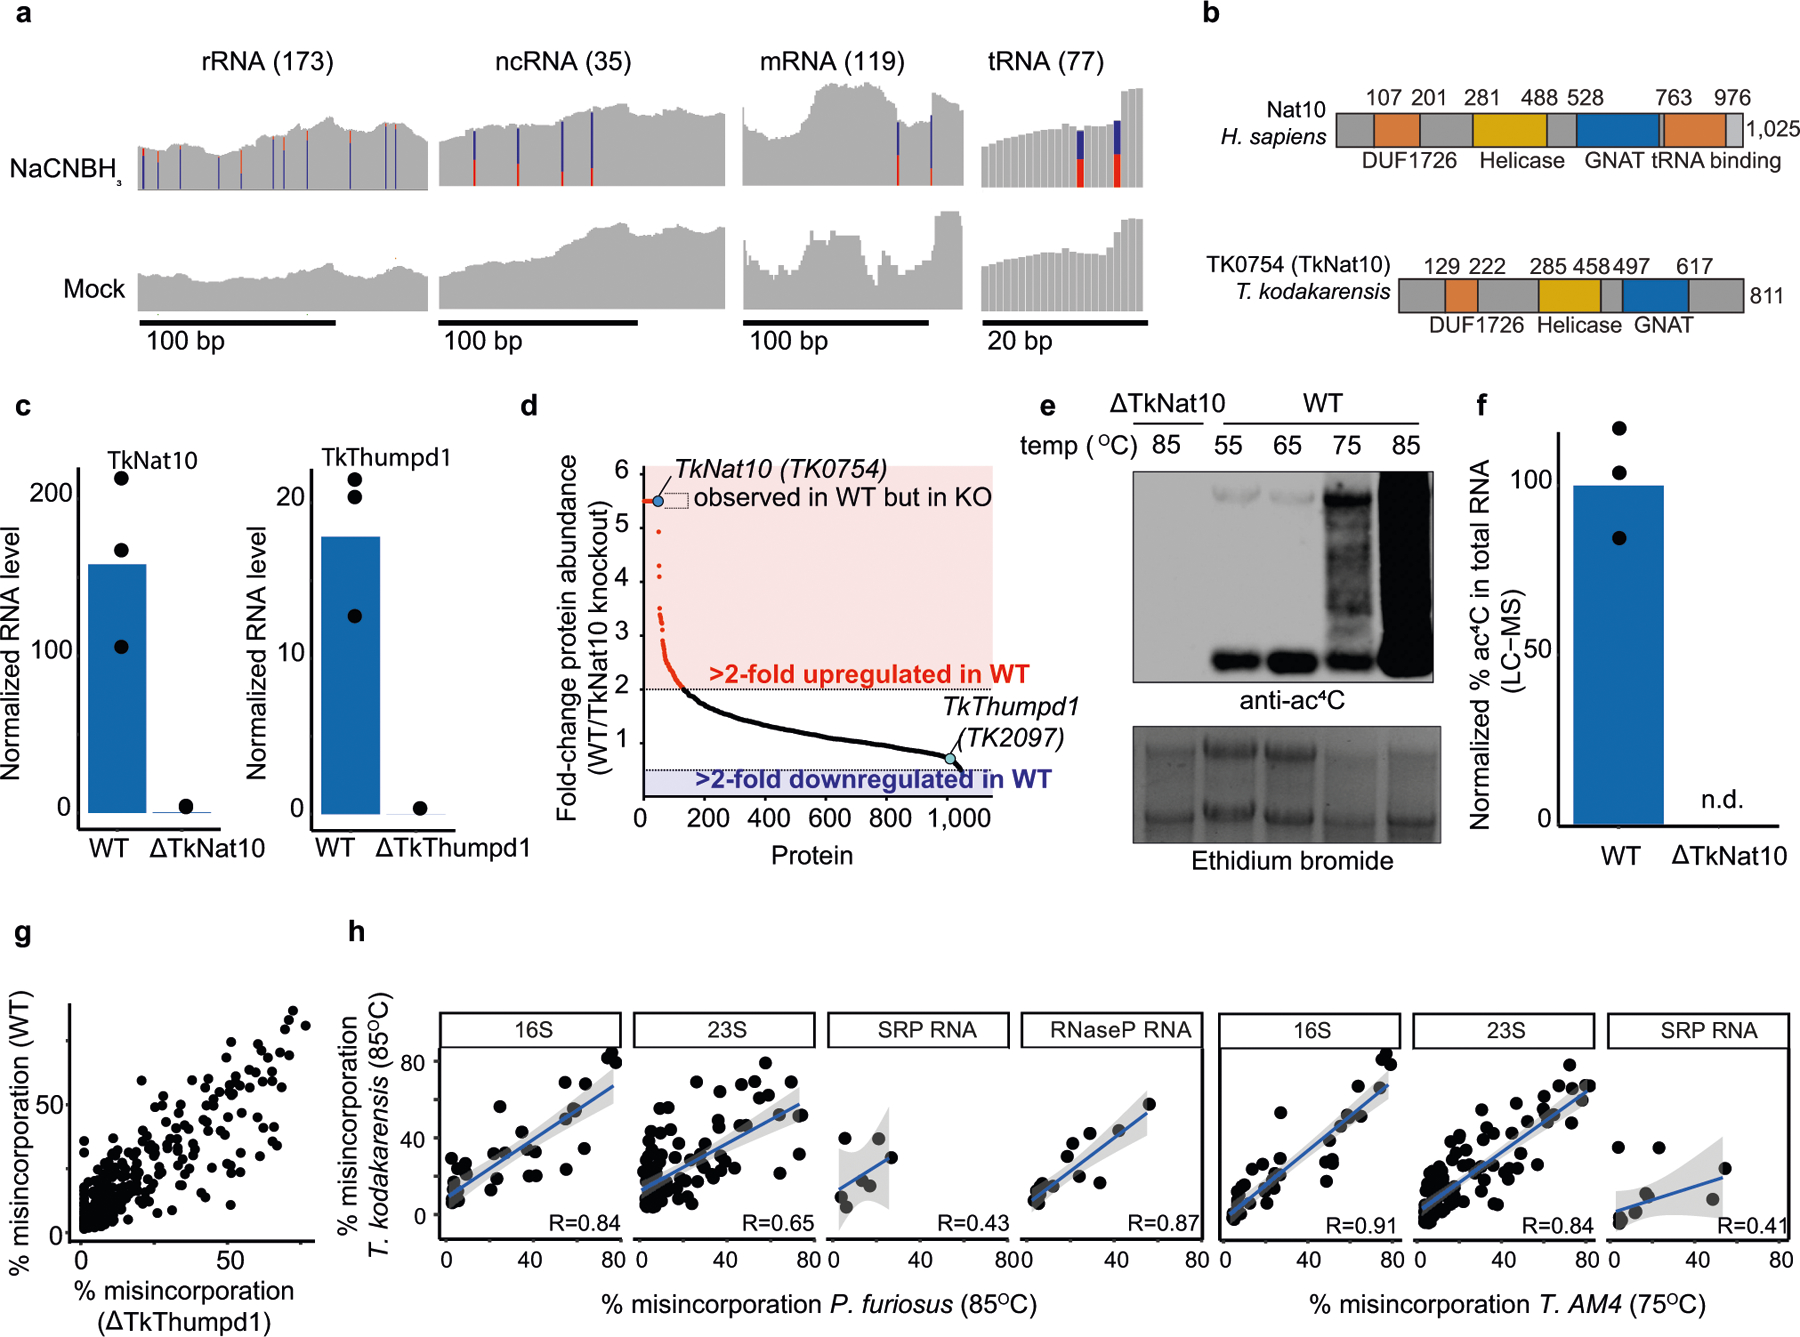
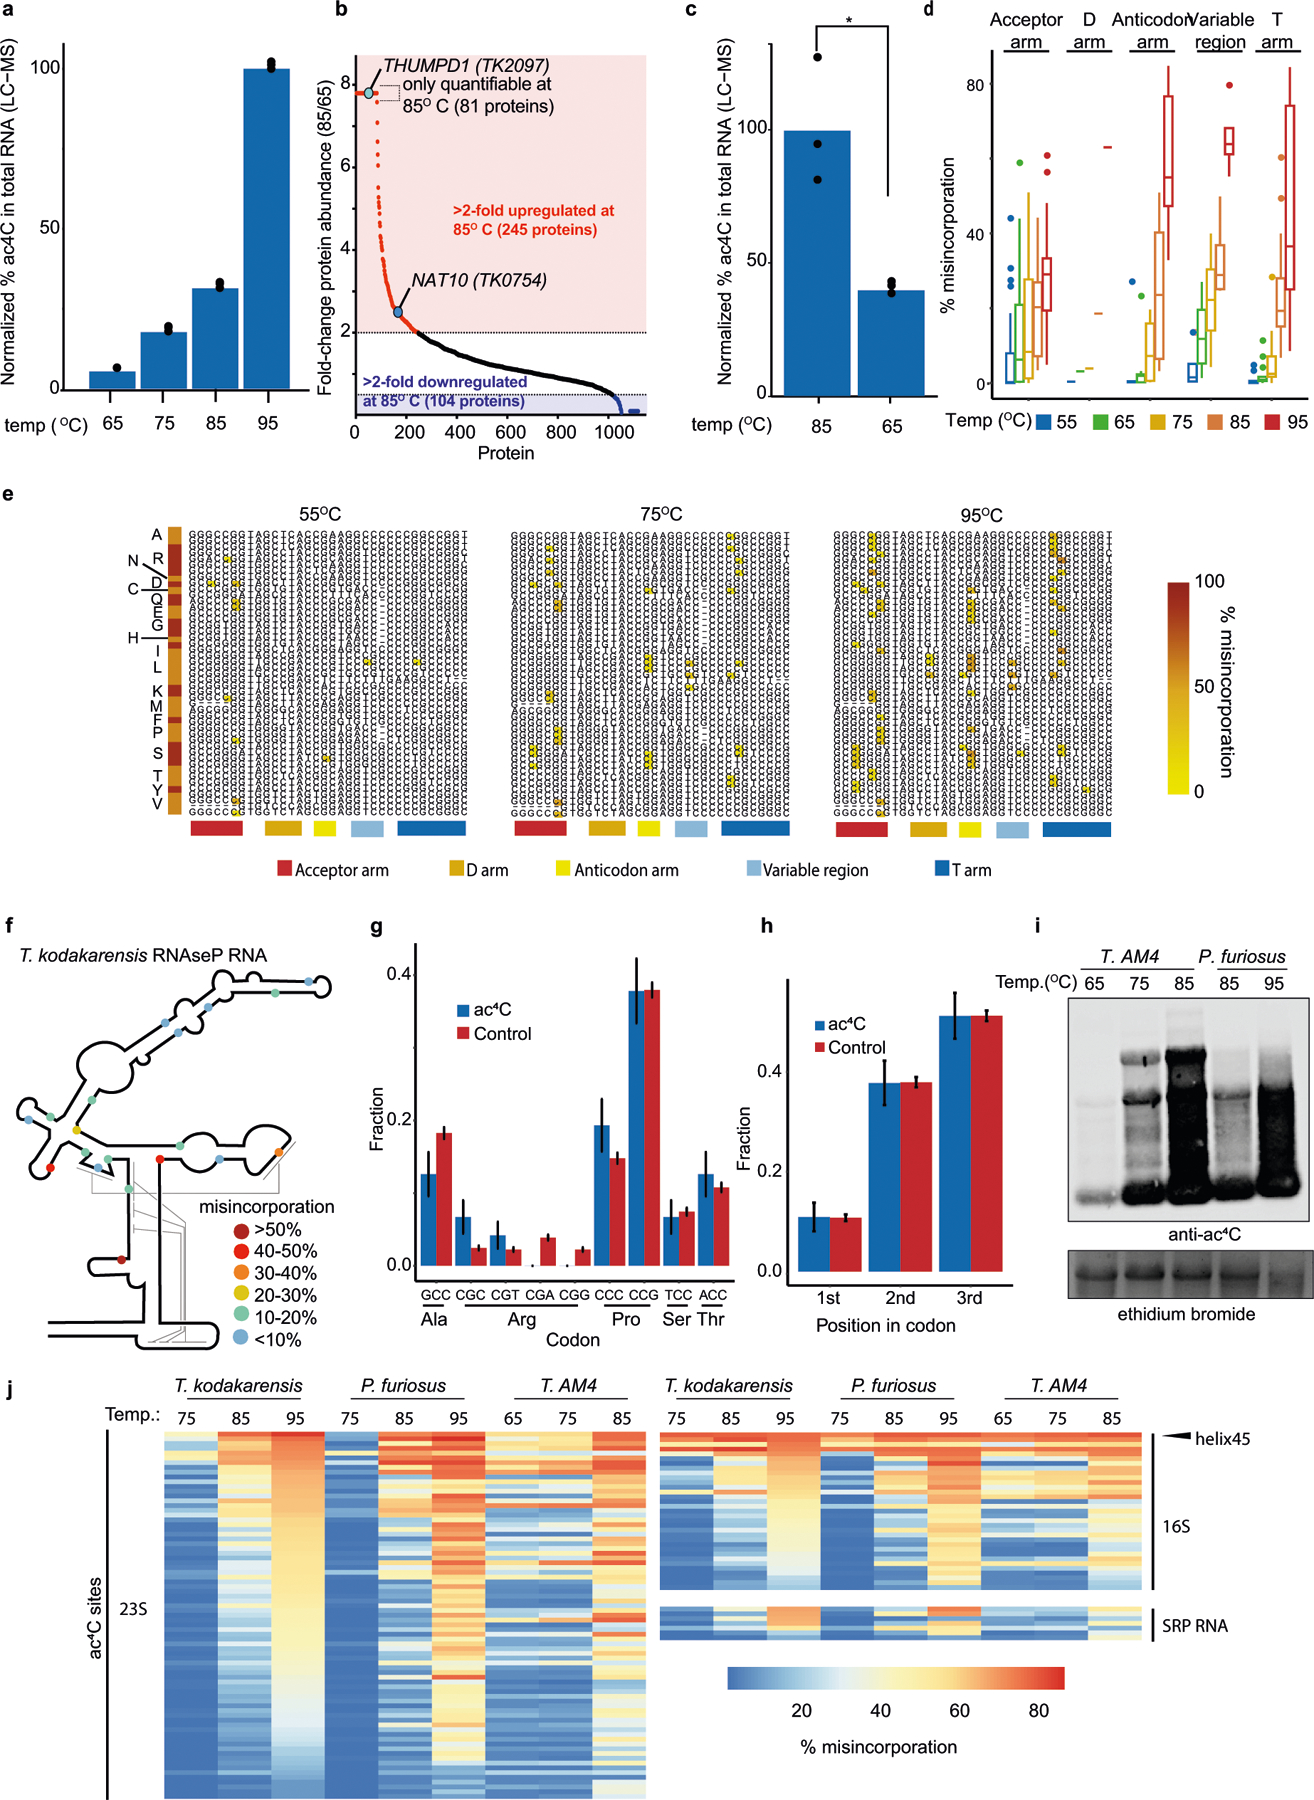
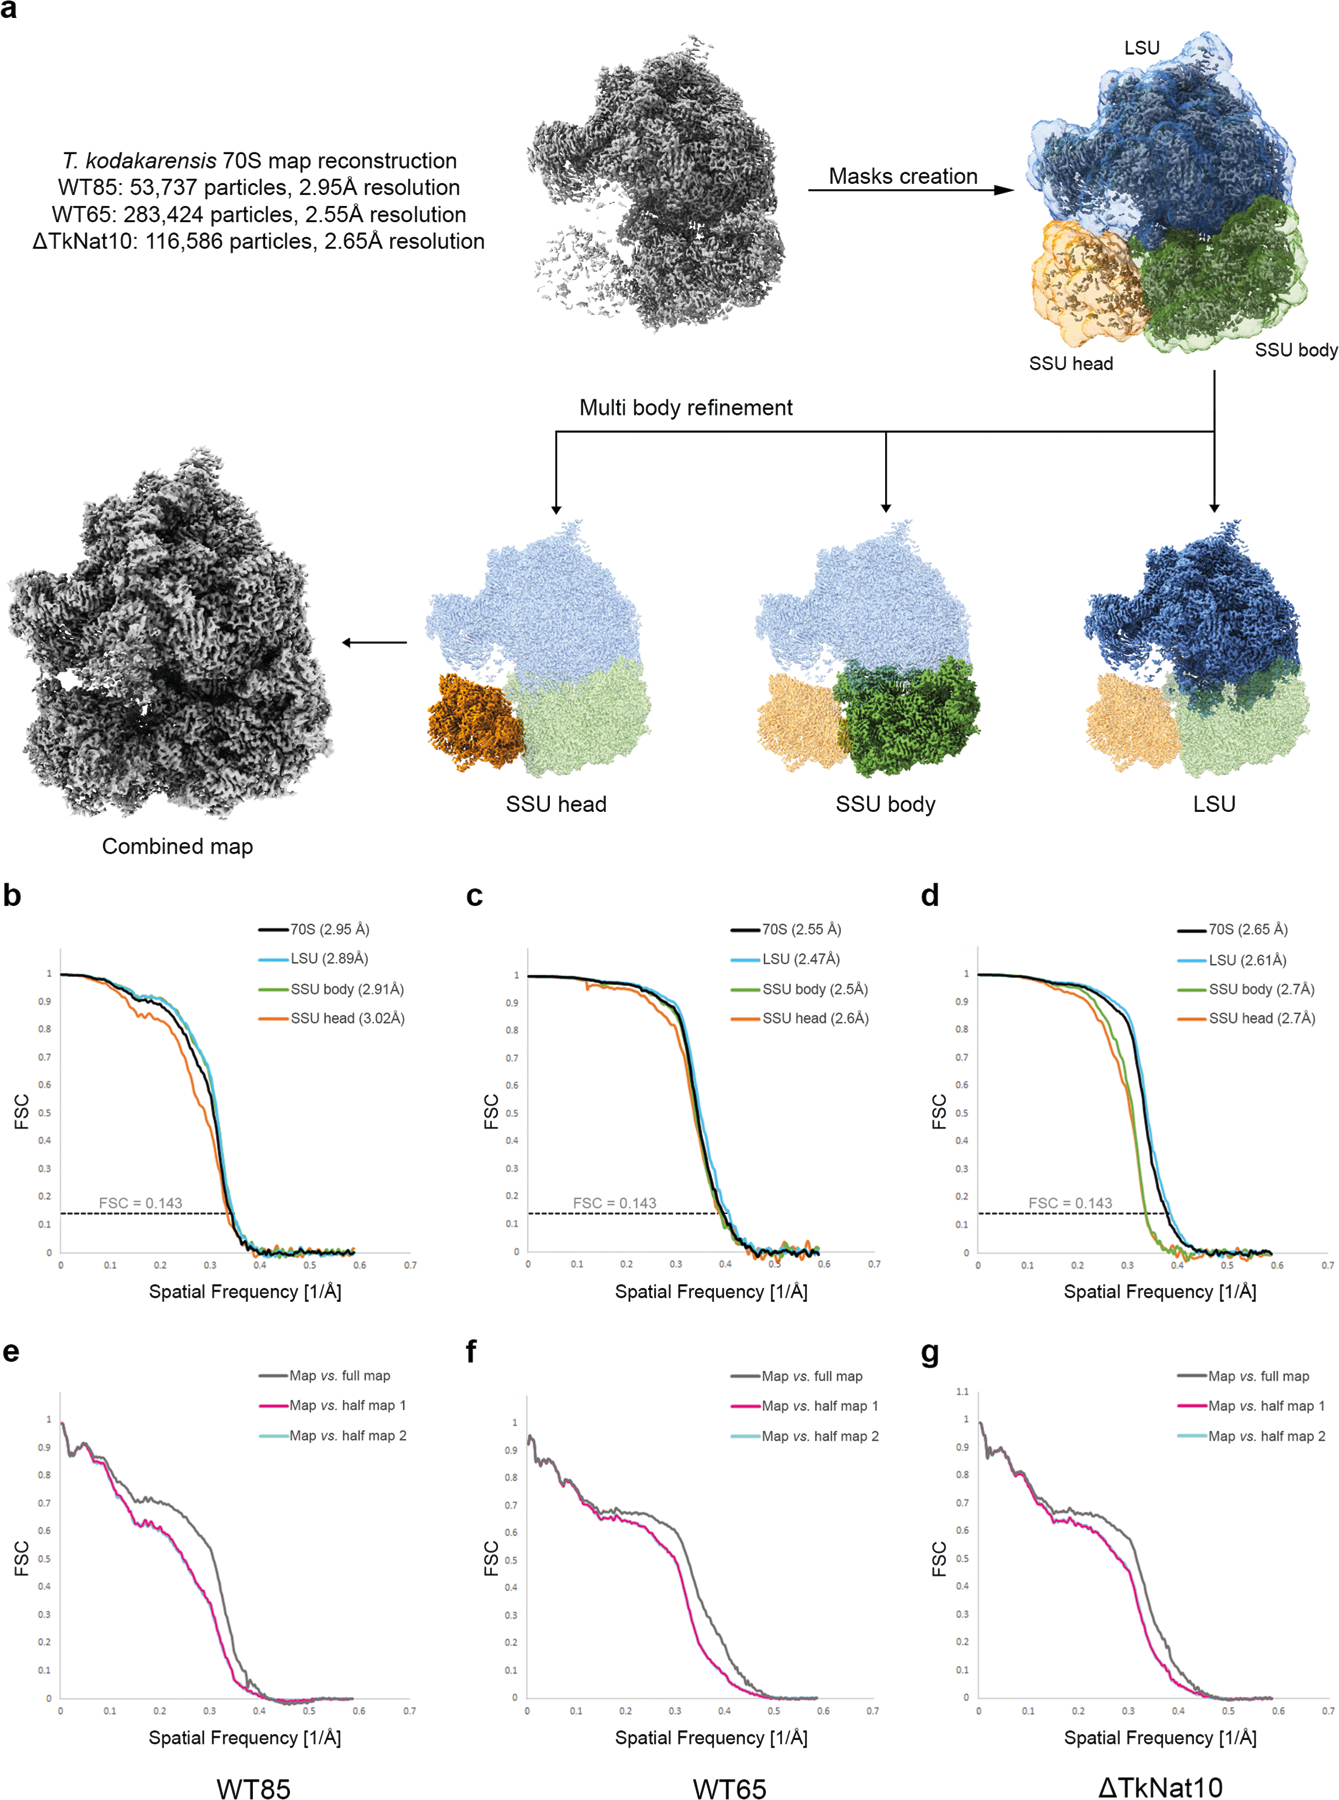
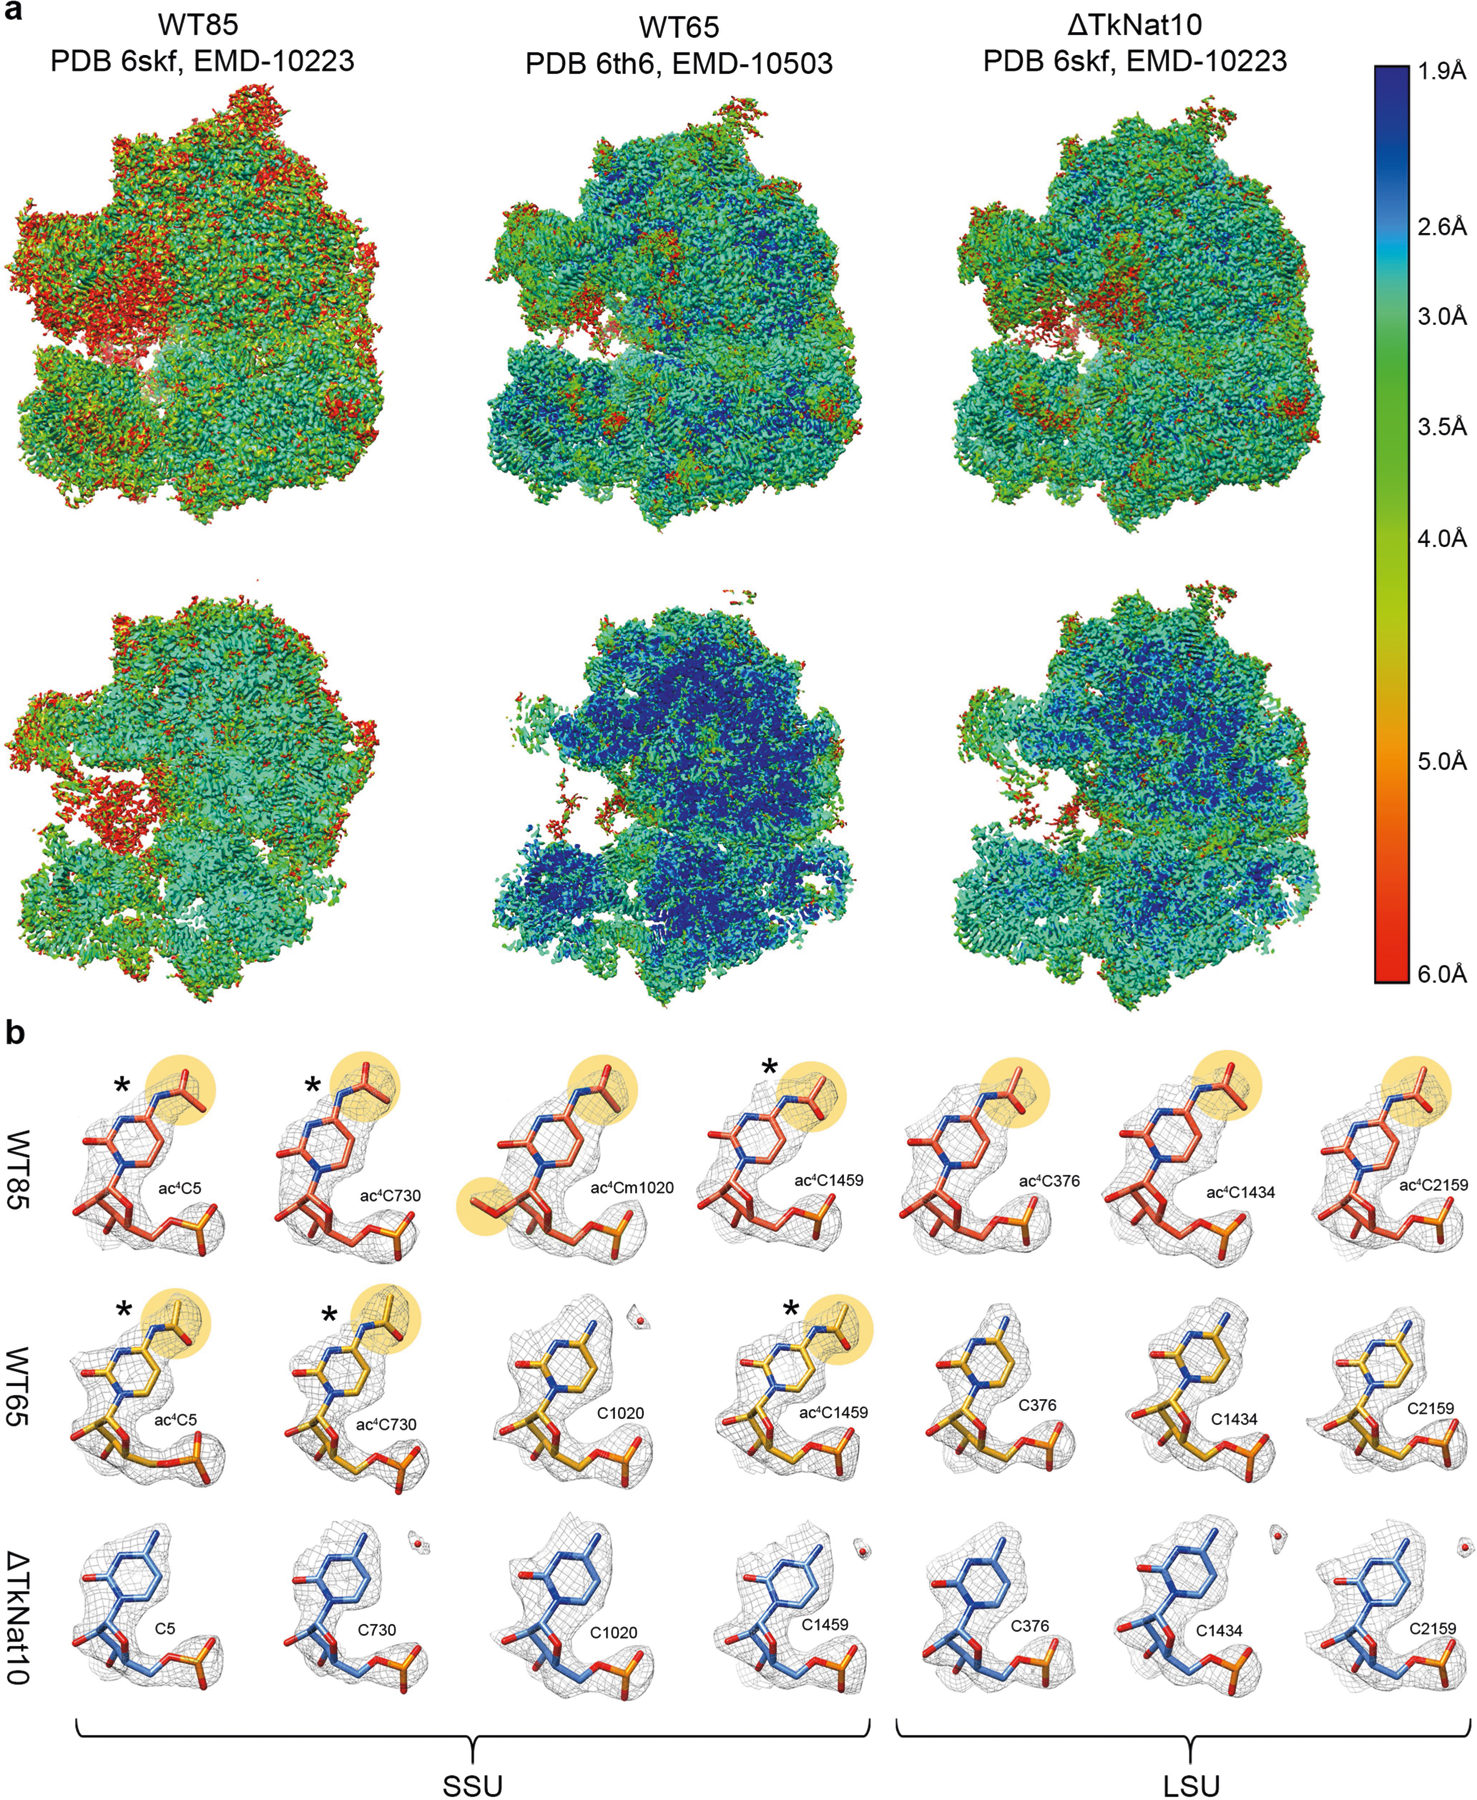
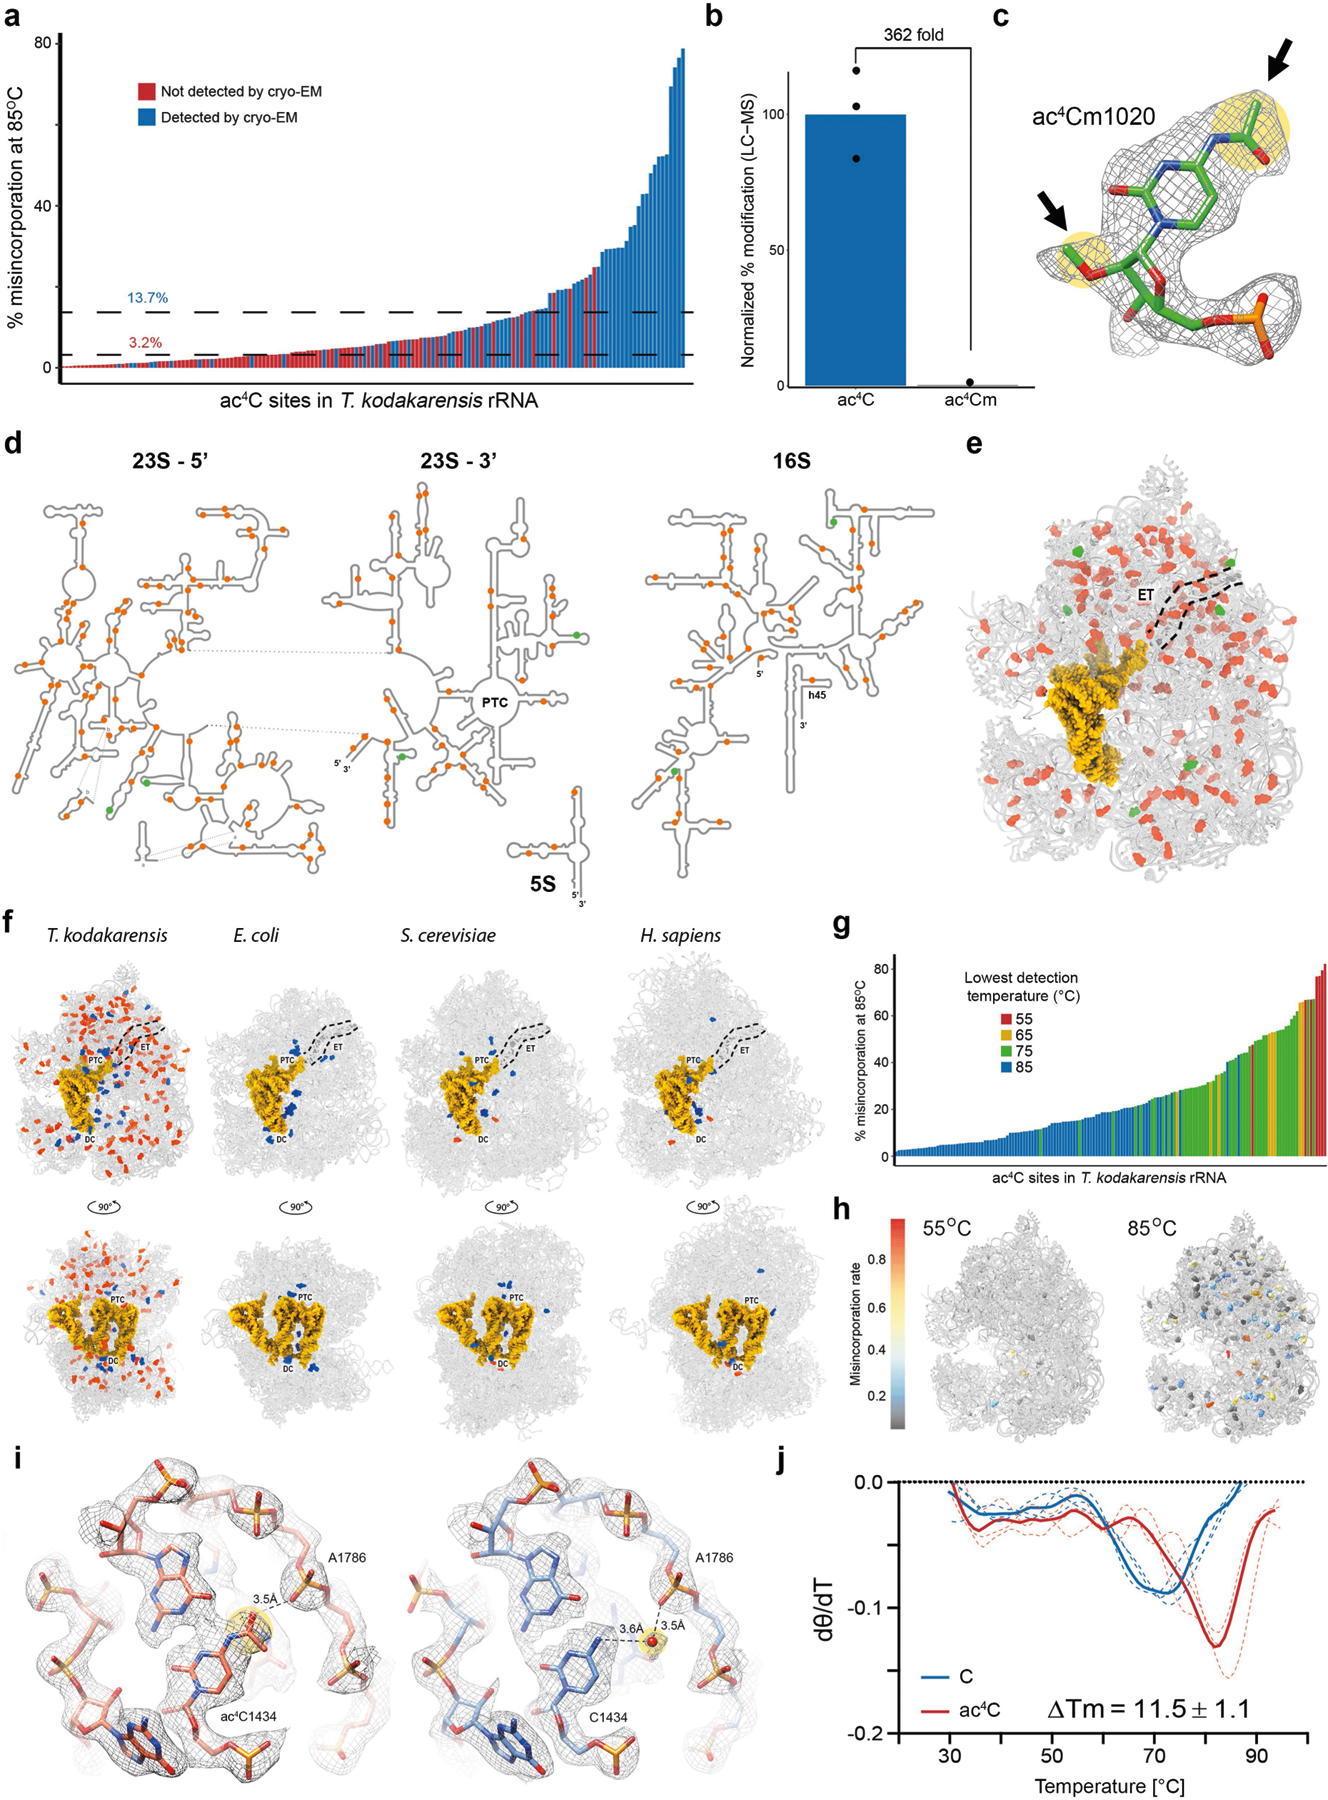
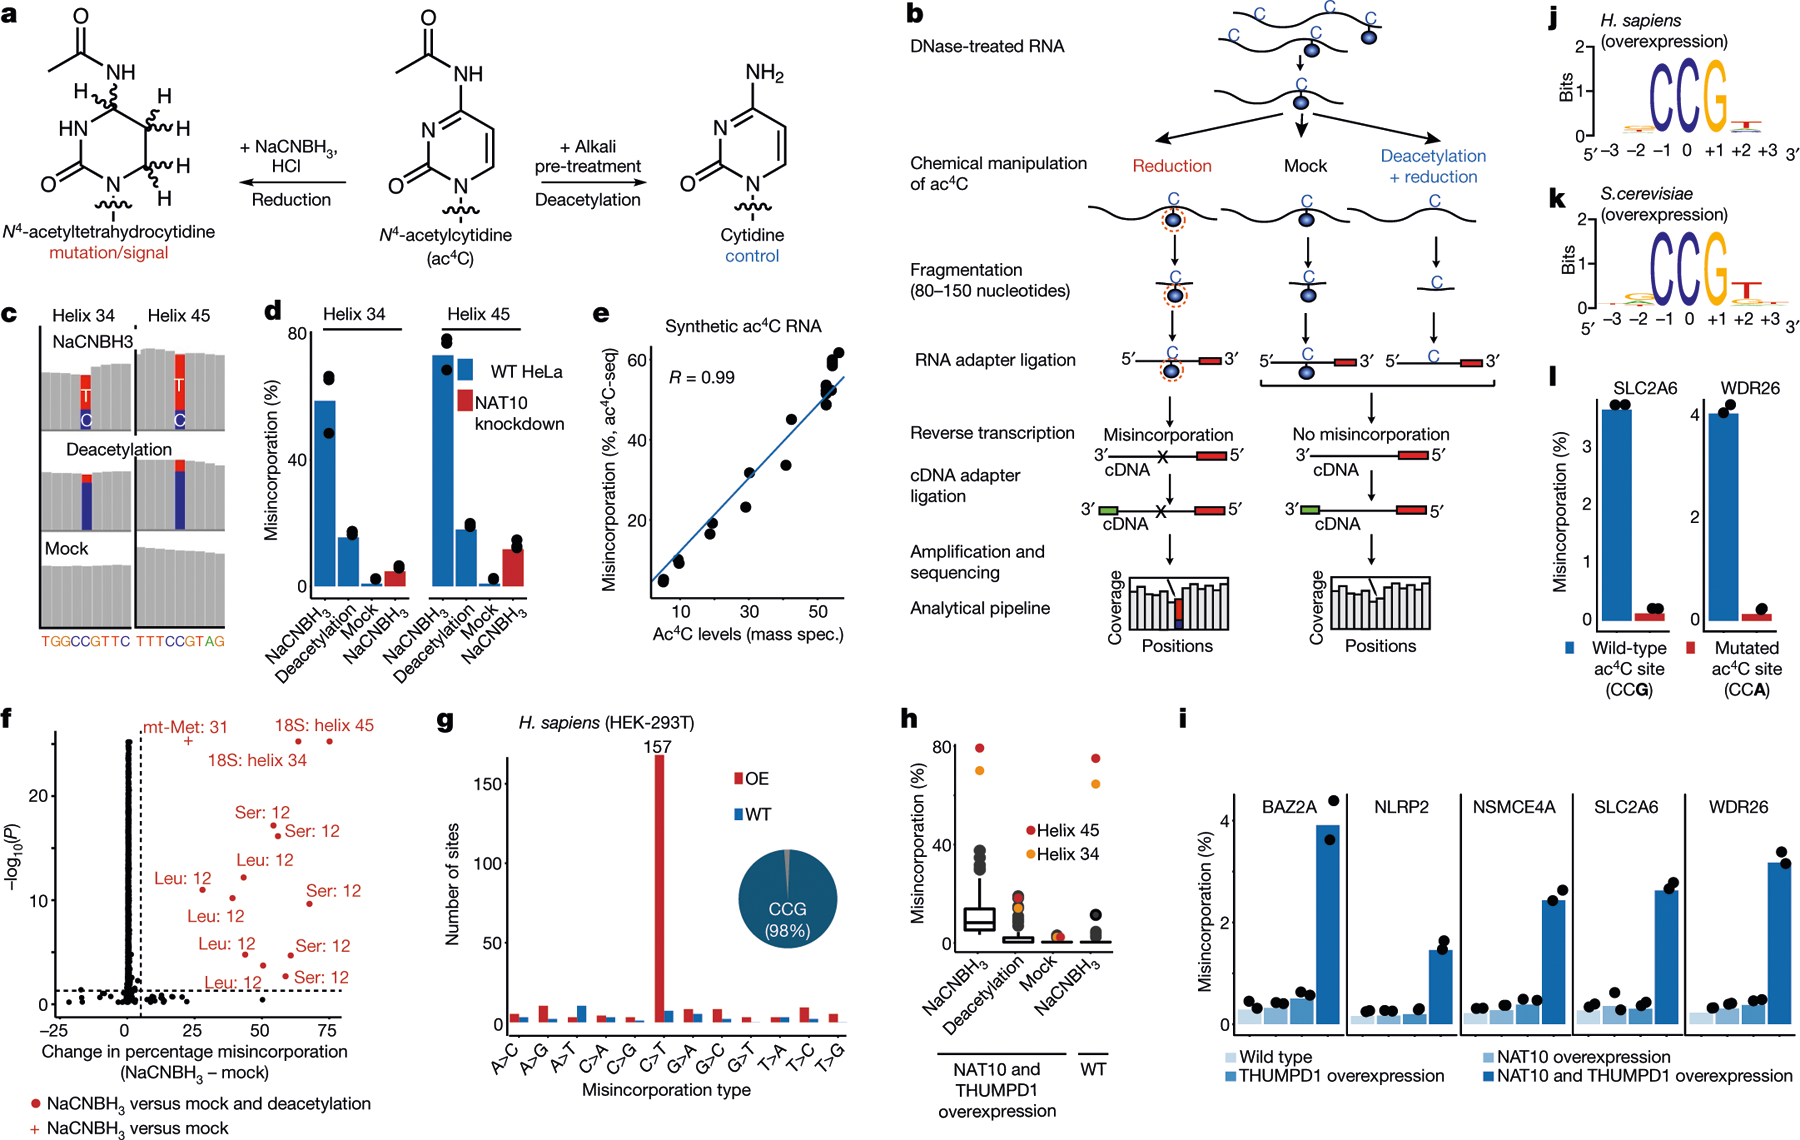
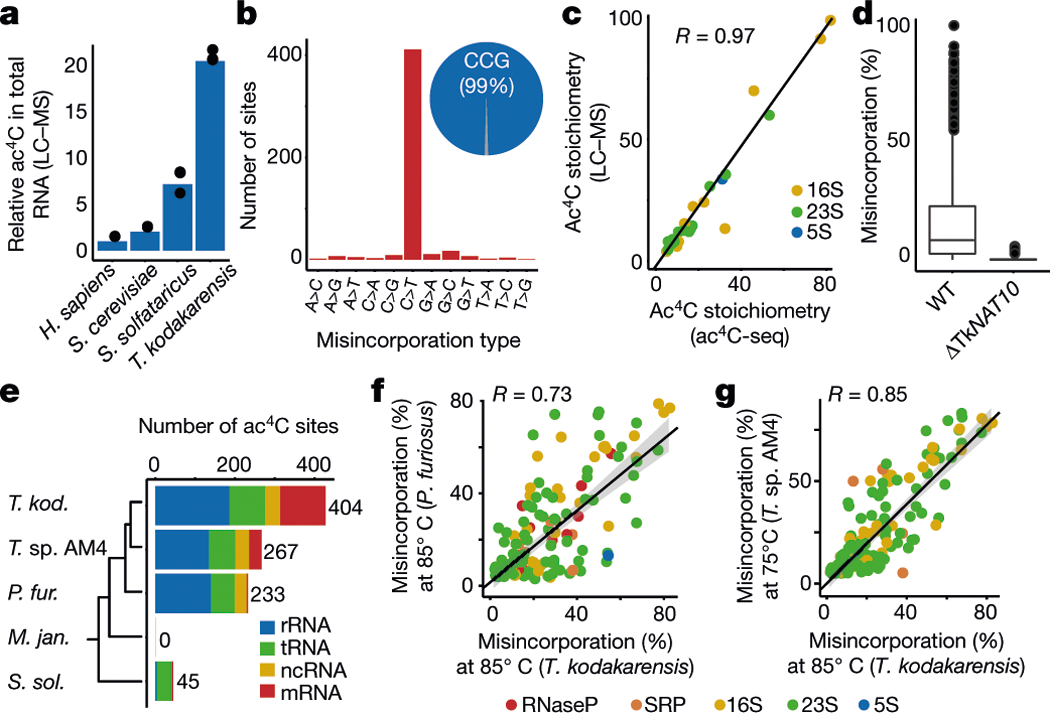
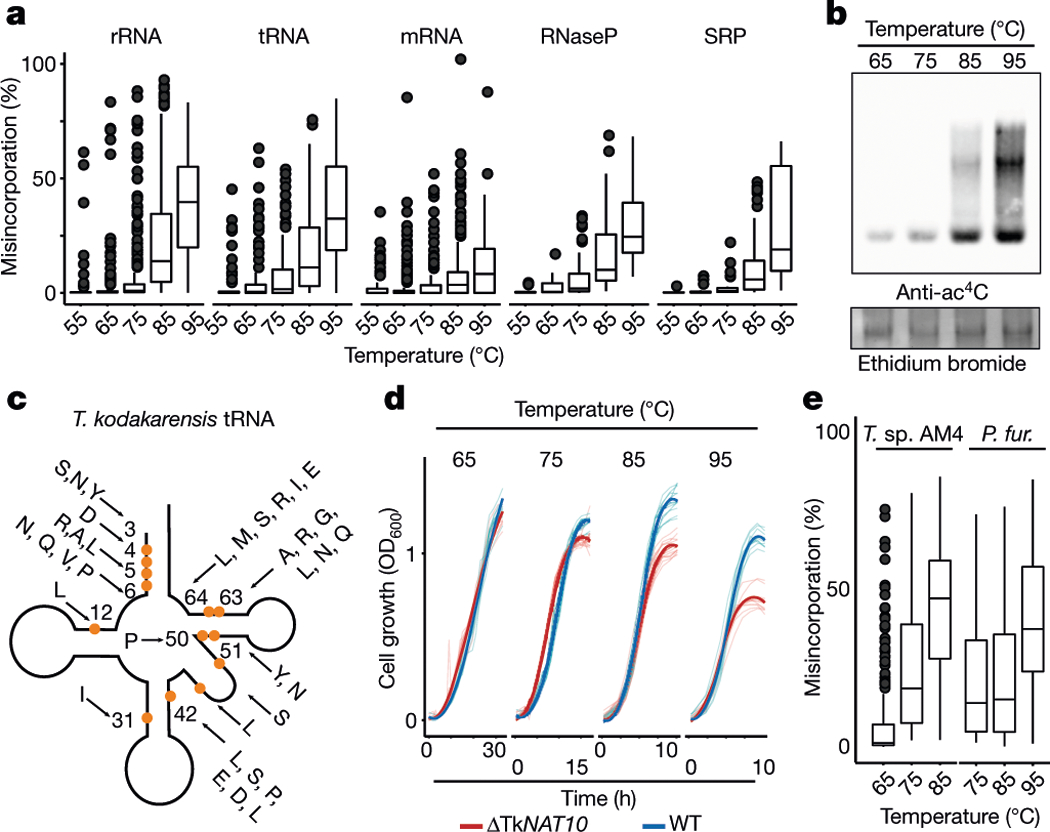
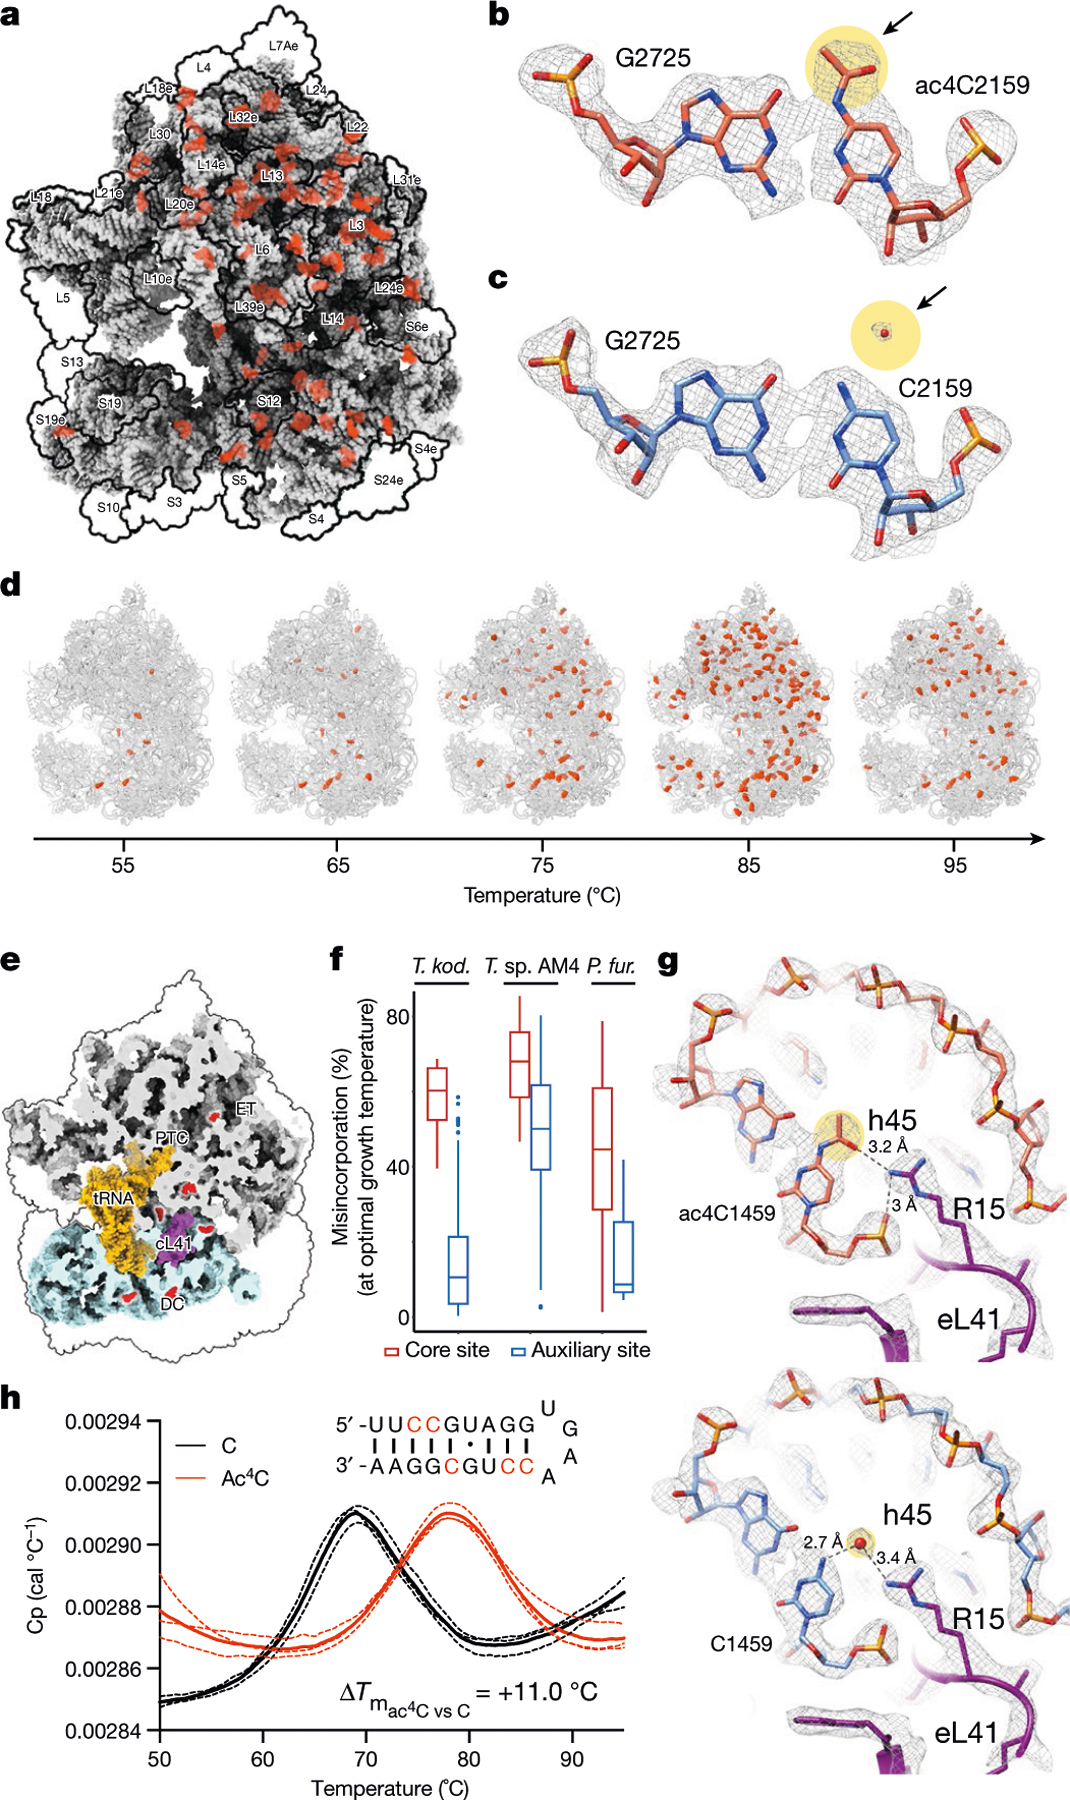
N4-acetylcytidine (ac4C) is an ancient and highly conserved RNA modification that is present on tRNA and rRNA and has recently been investigated in eukaryotic mRNA1-3. However, the distribution, dynamics and functions of cytidine acetylation have yet to be fully elucidated. Here we report ac4C-seq, a chemical genomic method for the transcriptome-wide quantitative mapping of ac4C at single-nucleotide resolution. In human and yeast mRNAs, ac4C sites are not detected but can be induced-at a conserved sequence motif-via the ectopic overexpression of eukaryotic acetyltransferase complexes. By contrast, cross-evolutionary profiling revealed unprecedented levels of ac4C across hundreds of residues in rRNA, tRNA, non-coding RNA and mRNA from hyperthermophilic archaea. Ac4C is markedly induced in response to increases in temperature, and acetyltransferase-deficient archaeal strains exhibit temperature-dependent growth defects. Visualization of wild-type and acetyltransferase-deficient archaeal ribosomes by cryo-electron microscopy provided structural insights into the temperature-dependent distribution of ac4C and its potential thermoadaptive role. Our studies quantitatively define the ac4C landscape, providing a technical and conceptual foundation for elucidating the role of this modification in biology and disease4-6.


Conflict of interest statement

Competing interests The authors declare no competing interests.

Figures

Extended Data Fig. 1 |
Extended Data Fig. 1 |. An optimized reaction for sequencing of N4-acetylcytidine in RNA.
a, Protonation under acidic conditions hyperactivates ac4C, increasing its reactivity with NaCNBH3. Efficient reduction manifests as quantitative misincorporation of deoxynucleotide triphosphates at ac4C upon reverse transcription. b, NaCNBH3-dependent misincorporation at the known ac4C site in human helix 45 is increased at more acidic pH. The percentage misincorporation at ac4C sites after chemical reduction, reverse transcription and PCR was quantified from Sanger sequencing data. One independent experiment. c, Kinetic analysis of ac4C reduction. Reaction progress was assessed by monitoring the disappearance of ac4C absorbance at 300 nm in the presence of first and second-generation hydride donors. Reaction conditions: ac4C (0.1 mM, free nucleoside), reductant (20 mM), H2O. NaBH4 reactions were carried out at pH 10, whereas NaCNBH3 reactions were adjusted to pH 1 using HCl before initiation. Representative of 3 independent experiments. d, Kinetic analysis of the hydrolysis of ac4C at pH values used in NaBH4 (pH 10) and NaCNBH3 (pH 1) reduction reactions. Reaction progress was assessed by monitoring the disappearance of ac4C absorbance at 300 nm. Acid- and base-catalysed hydrolysis occurred at similar rates, and were slow compared to ac4C reduction by NaBH4 and NaCNBH3. Representative of 3 independent experiments. e, LC–MS/MS analysis confirms reduction of ac4C to reduced ac4C in the presence of NaCNBH3. Reaction conditions: ac4C (0.1 mM, free nucleoside), NaCNBH3 (20 mM), HCl pH 1. Representative of 2 independent experiments. f, Exact mass of reduced ac4C and deamination product observed in LC–MS/MS experiments. g, Primer extension analysis of ac4C-containing RNAs after NaCNBH3 treatment (100 mM, pH 1, 37 °C, 1 h). h, Sanger sequence traces of a known ac4C site in helix 45 of human HAP1 cells. C>T misincorporation is exclusively observed at the ac4C site in reduced (NaBH4 and NaCNBH3) but not in mock-treated samples. ac4C sites are highlighted in yellow.
Extended Data Fig. 2 |
Extended Data Fig. 2 |. Ac4C in eukaryotic cells with wild-type NAT10 expression.
ac, ac4C-seq was conducted on RNA from S. cerevisiae (a, c) and HeLa cells (b). Statistical significance from the χ2 test is plotted against the difference in misincorporation rates (corresponding to ac4C levels) between NaCNBH3-treated and mock-treated RNA from S. cerevisiae (a), RNA from wild-type and NAT10-depleted cells (b) or from wild-type S. cerevisiae cells and a strain expressing a catalytic mutant of Kre33 (c), treated with NaCNBH3. Sites with a differential misincorporation level >5% and a P value <0.05 are labelled and marked in red. For HeLa cells (b) an additional comparison between NaCNBH3 and deacetylation pre-treatment was conducted. Sites that do not pass significance under these conditions are marked with a plus sign (shown only for sites found significant between NaCNBH3 and mock treatment). Significant sites are labelled with the identity of the molecule and the relative position (or helix) of ac4C. n = 3 biologically independent samples for all but NAT10-depleted HeLa cells, in which case n = 2 biologically independent samples. d, e, Misincorporation level in the two known sites in 18S (helix 34 and helix 45), compared with controls in poly(A)-enriched RNA from wild-type S. cerevisiae cells and S. cerevisiae cells expressing a catalytic mutant of Kre33 (d) and from wild-type HEK-293T cells and HEK-293T cells overexpressing NAT10 and THUMPD1 (e). f, g, ac4C-seq data from poly(A)-enriched RNA from HEK-293T cells overexpressing NAT10 and THUMPD1 on ‘ac4C peaks’ that have been identified previously as harbouring ac4C. f, Distribution of misincorporation across each of 57 ‘ac4C peaks’ that had a coverage of more than 400 reads in more than 80% of the cytosines in the peak. For each peak the cytosine harbouring the highest misincorporation rate is indicated in colour, presented in blue if it harbours a CCG motif and red otherwise. g, Traces from the Integrative Genomic Viewer (IGV) browser of three such genes, with highest coverage in the ac4C-seq data. For each gene the 15 bases motif identified in ref. is presented. The numbers above each cytidine indicate the number of bases (A, C, G and T) observed in our data at that position. h, Power analysis for ac4C detection, as a function of sequencing depths and stoichiometries. Each data point in each curve is based on 1,000 simulations. For each sampled depth, numbers in the legend indicate the sequencing depth, which was kept identical for treatment and control samples. In addition, the legend indicates the number of CCG sites found in wild-type HEK-293T samples that have such a minimal depth and the percentage of these detectable CCG sites from all CCG sites in the transcriptome.
Extended Data Fig. 3 |
Extended Data Fig. 3 |. Ac4C in eukaryotic cells with manipulated NAT10 expression.
a, RNA expression of NAT10 and THUMPD1 in HEK-293T cells overexpressing both genes compared to wild-type cells. Shown are TMM-normalized read counts. The numbers above the bars indicate fold increase compared with the wild type. b, Immunoblotting analysis of NAT10 and THUMPD1 overexpression in HEK-293T cells. Representative of 3 independent experiments with similar results. For gel source data, see Supplementary Data 3. c, Microscopy images of the eGFP–NAT10 construct, confirming nuclear and nucleolar localization of ectopically expressed N-terminally tagged protein. Representative of 3 independent experiments with similar results. d, RNA expression of Kre33 and Tan1 in wild-type yeast cells and in cells stably overexpressing Kre33 and either stably or inducibly overexpressing Tan1. The numbers above the bars indicate fold increase from the wild type. e, The number of sites displaying each of the 12 possible misincorporation patterns are displayed (bar plot, y axis) for sites found in poly(A)-enriched RNA from both wild-type S. cerevisiae cells and S. cerevisiae cells overexpressing both Kre33 and Tan1. The pie chart displays the proportion of sites harbouring C>T misincorporations that were embedded within a CCG motif (73 out of 74, 98.6%). f, Schematic of the known ac4C sites in human tRNAs (Leu and Ser) and in helix 34 (C1337) and helix 45 (C1842) of human 18S rRNA. The acetylated cytidine residue (highlighted in blue) is embedded within a CCG motif in all known sites. g, Fraction of ac4C sites found within the 5′ UTR, CDS and 3′ UTR (CDS, coding sequence; UTR, untranslated region). Results are shown for the set of ac4C sites in mRNA of HEK-293T cells overexpressing NAT10 and THUMPD1 (red bars, n = 139), and—as controls—for all CCG motifs present within all genes within which any ac4C was found (blue bars, n = 6,129). Error bars representing standard distribution of the binomial distribution. Data are based on 2 biologically independent samples. h, Fraction of ac4C sites at the first, second and third position of each codon, shown for ac4C sites and controls as in g. Data are mean ±s.d. of the binomial distribution and are based on two biologically independent samples.
Extended Data Fig. 4 |
Extended Data Fig. 4 |. Sequence and structure requirements for deposition of ac4C.
a, Oligonucleotides representing the wild-type sequence surrounding the acetylated site in BAZ2A mRNA, or variants with single mutations across the wild-type sequence, were synthesized as a pool and cloned into the 3′UTR of a reporter gene. The pool of plasmids was transfected into wild-type HEK-293T cells or cells transiently overexpressing NAT10 and THUMPD1. RNA extracted from cells was subjected to targeted ac4C-seq and ac4C levels were estimated on the basis of misincorporation rates. b, Misincorporation rate of oligonucleotides described in a, harbouring the wild-type sequence of BAZ2A (green triangles) or a sequence mutated at the CCG motif and at its surrounding bases (red and black, respectively). Box plot visualization parameters are as in Fig. 1h. n = 2 biologically independent samples. c, The difference in misincorporation rate of oligonucleotides with a single base mutation compared with the wild-type oligonucleotide is shown across all positions of the construct. d, De novo construction of the motifs surrounding the modified cytidine were built on the basis of the contribution of single-base mutations in the BAZ2A sequence to the reduction in misincorporation rate compared to wild-type BAZ2A sequence. e, Secondary structure of the BAZ2A mRNA fragment as predicted by RNAfold. Bases are colour-coded according to confidence level of the prediction. Regions highlighted by a blue and green line in ce represent the CCG motif and a stem structure surrounding the modified cytidine, respectively.
Extended Data Fig. 5 |
Extended Data Fig. 5 |. Deletion of TkNAT10 and TkTHUMPD1 in T. kodakarensis.
a, Total RNA from T. kodakarensis was analysed via ac4C-seq. IGV browser traces display representative ac4C sites in rRNA, ncRNA, mRNA and tRNA of T. kodakarensis, visualized as in Fig. 1c. The number in parentheses indicates the number of sites identified for each class of molecules. b, Conserved domain architecture of human NAT10 and its homologue in T. kodakarensis, TK0754 (referred to as TkNAT10 in the text). c, Expression of TkNAT10 and TkTHUMPD1 (TK2097) in wild-type T. kodakarensis and the indicated deletion strains was quantified from ac4C-seq data. Shown are mean TMM-normalized values (n = 3 and 2 biological replicates in wild-type and deletion strains, respectively). d, Quantitative LC–MS/MS proteomics analysis of wild-type and ΔTkNAT10 T. kodakarensis. Fold-change in protein abundance was based on comparison of distributed normalized spectral abundance factor for individual proteins. Fold-change for proteins detectable exclusively in the wild-type or the knockout (KO) condition (fold-change = ∞) are graphed at 5.5 and 0.1, respectively, which represents the maximum and minimum of measured values. n = 3 LC–MS/MS runs for each condition. e, Anti-ac4C immuno-northern blot in T. kodakarensis total RNA. Ethidium bromide staining is used to visualize total RNA. Results are representative of two biological replicates. For gel source data, see Supplementary Data 3. f, Relative quantification of ac4C in total RNA isolated from wild-type and ΔTkNAT10 T. kodakarensis strains as measured by LC–MS. Mean of n = 3 technical replicates. n.d., not detectable. g, Scatter-plot depicting misincorporation rate of ac4C sites in wild-type T. kodakarensis is compared with the TkTHUMPD1-deletion strain, showing no effect of the deletion of the gene on the ac4C status. h, Correlation between misincorporation rates in T. kodakarensis compared to P. furiosus and T. sp. AM4 for the different types of ncRNAs identified by ac4C-seq. The Pearson’s correlation coefficient is indicated at the bottom of each plot. n = 4 and 1 independent biological samples for T. kodakarensis and other archaea, respectively. Shading indicates 95% confidence intervals for predictions from a linear model.
Extended Data Fig. 6 |
Extended Data Fig. 6 |. Ac4C accumulates in a temperature-dependent manner across all RNA species in archaea.
a, Relative quantification of ac4C in total RNA isolated from wild-type T. kodakarensis as a function of temperature as measured by LC–MS. Mean is shown along with individual data points. n = 3 technical replicates. For 65, 75, 85 °C: representative of 2 independent experiments, for 95 °C: 1 experiment. b, c, Quantitative LC–MS/MS proteomics analysis of T. kodakarensis temperature-dependent protein expression. Fold-change in T. kodakarensis protein abundance between growth conditions at 85 °C and 65 °C was based on comparison of distributed normalized spectral abundance factor for individual proteins. Fold-change for proteins detectable exclusively in the 85 °C or 65 °C condition (fold-change = ∞) was set at 7.8 and 0.1, respectively, which represents the maximum and minimum of measured values. n = 3 LC–MS/MS runs for each condition. Student’s t-test, paired, two tailed P = 0.012. d, Misincorporation rates of ac4C sites at distinct regions of T. kodakarensis tRNAs as a function of growth temperature (55–95 °C), segregated into distinct regions within the tRNA molecule. Only sites with a minimal stoichiometry of 5% in any sample are shown. Box plot visualization parameters are as in Fig. 1h. n = 4 biologically independent samples for 85 °C, n = 2 for 65 °C and 75 °C and n = 1 for 55 °C and 95 °C. e, Multiple alignment of 37 tRNA molecules, representing 19 distinct tRNAs in T. kodakarensis, plotted across three distinct temperatures. ac4C sites are coloured on the basis of misincorporation rate (see colour bar). The red–orange bar on the left segregates the aligned sequences into distinct tRNA molecules, identified by the single-letter abbreviation of their amino acid. Selected regions from the multiple alignment, where ac4C is particularly abundant, are shown and colour-coded according to the bottom colour bar. f, Schematic representation of RNaseP RNA in T. kodakarensis. ac4C sites (all in CCG) are marked with circles colour-coded by misincorporation rate measured in cells grown at 85 °C. Fine grey lines indicate regions that base pair in the folded structure of the molecule, according to the model in ref. . g, h, Distribution of 119 acetylated cytidine residues (in 86 mRNAs) in T. kodakarensis across different codons (g) and at specific position within codons (h) are shown, and compared to that of 2,245 control non-acetylated cytidines, found at CCG motifs of the same mRNAs. The y axis presents the fraction of cytidines in each position. n = 1 set of sites (comprising 119 ac4Cs and 2,245 Cs) with error bars representing standard deviation of the binomial distribution. i, Anti-ac4C immuno-northern blot in P. furiosus and T. sp. AM4 total RNA as a function of temperature. Ethidium bromide staining was used to visualize total RNA. Results are representative of two biological replicates. For gel source data, see Supplementary Data 3. j, A heat map showing misincorporation rates at conserved ac4C sites in 5S, 16S, 23S, RNase P RNA and SRP RNA of T. kodakarensis, P. furiosus and T. sp. AM4 grown at various temperatures. Rows are ordered according to misincorporation rates quantified in T. kodakarensis grown at 95 °C. The arrowhead indicates the conserved ac4C site at helix 45 (top site in the heat map).
Extended Data Fig. 7 |
Extended Data Fig. 7 |. Cryo-EM data processing and map reconstruction.
a, Schematic representation of electron microscopy data processing for the T. kodakarensis ribosomes. Data processing was performed in Relion 3 and included motion correction, contrast transfer function correction, particle picking and classification. Initial map reconstruction and post processing was performed by the 3D refinement algorithm implemented in Relion on the complete 70S particle, indicating high residual mobility of the SSU head domain (top left, grey). Further implementation of multibody refinement with individual masks prepared for the LSU (blue), SSU body (green) and SSU head (orange) resulted in the complete reconstruction of the 70S particle. The final map consisting of all three ribosomal domains for the wild-type ribosome derived from cells grown at 85 °C is presented at the bottom left. Fourier shell correlation curves indicating overall (black) and per domain (colour coded according to the relevant masks) resolutions are presented in b for the wild-type strain grown at 85 °C (WT85), c for the wild-type strain grown at 65 °C (WT65) and d for the ΔTkNAT10 ribosomes (mutant). FSC comparisons of full (grey) and half-maps (pink/cyan) to the final refined model are presented in e, f and g for WT85, WT65 and mutant strains, respectively. The excellent agreement between the cyan and pink curves indicates the lack of overfitting.
Extended Data Fig. 8 |
Extended Data Fig. 8 |. Cryo-EM data quality and ac4C visualization.
a, Surface (top) and cross-section (bottom) representations of the cryo-EM density maps coloured according to local resolution distribution. Growth conditions and T. kodakarensis strains used in the study along with PDB and EMDB accession codes are indicated. Resolution values are colour-coded according to the right index and are presented in Å. b, Model in density for multiple ac4C positions in wild-type T. kodakaresis grown at 85 °C (orange) and 65 °C (yellow) compared to an ac4C ΔTkNAT10 strain (mutant, blue) indicating the absence of acetate density (highlighted in light orange) in the mutant and in multiple positions of the strain grown at 65 °C. Positions highlighted with an asterisk are also acetylated in the 65 °C strain whereas positions that are unmarked are acetylated only in the archaea grown at 85 °C. These data are in good agreement with both the genomic sequencing and MS approaches described in this manuscript, that similarly indicate that ac4C distribution is highly dependent on growth temperature. A detailed list of ac4C distribution and comparison with other methods is provided in Supplementary Table 4. For a 2D map with ac4C distribution, see Extended Data Fig. 9d.
Extended Data Fig. 9 |
Extended Data Fig. 9 |. RNA modifications of T. kodakarensis ribosome and thermostability.
a, Misincorporation level as quantified by ac4C-seq across all ac4C sites identified in ribosomes of T. kodakarensis at 85 °C. Blue and red bars indicate sites that were and were not detected by cryo-EM, respectively. Dashed lines indicate median misincorporation of cryo-EM detected (upper, 13.7%) and not-detected (lower, 3.2%) sites. Acetylation detected by ac4C-seq and also observed in the cryo-EM were generally of medium to high stoichiometry whereas the majority of acetylation sites detected by ac4C-seq but not observed in the cryo-EM map density were of relatively low stoichiometry, rendering them invisible in the ensemble cryo-EM structure, which averages thousands of individual particles for map reconstruction. be, Combined cryo-EM and mass spectrometric analysis indicated six ac4C residues that are also methylated at their 2′-O position. Relative quantification of ac4C and ac4Cm detection in T. kodakarensis RNA via LC–MS is presented in b. Mean and individual data points are shown. n = 3 technical replicates. An example of ac4Cm in density is shown in c with acetate and methyl installations indicated by black arrows. A list of ac4Cms is indicated in Supplementary Table 4. 2D (d) and 3D (e) visualization of ac4C and ac4Cm distribution in the T. kodakarensis ribosome with ac4C highlighted orange and ac4Cm green. Data are presented for the T. kodakarensis grown at optimal growth temperature (85 °C). Ac4C positions highlighted in orange include genomic, mass spectrometry and electron microscopy data. Ac4Cm positions are a combination between cryo-EM and mass spectrometry data. In e, RNA and proteins are presented as grey ribbons, modified residues are highlighted as spheres. The protein exit tunnel (ET) is highlighted with a dashed black line, and tRNA is in yellow. The tRNA and mRNA coordinates are from PDB 4V5D. f, A comparative view of RNA modification distribution in E. coli, yeast (S. cerevisiae), human (H. sapiens) and T. kodakarensis. Base modifications are coloured blue, ac4Cs in red, tRNA and mRNAs in yellow. Ribosome functional regions are designated in black with decoding centre (DC), the peptidyl transferase centre (PTC) and the protein exit tunnel (ET) highlighted by a dashed black line. PDB codes for the structures used for comparison are 5AFI, 4V88 and 4UGO, for the E. coli, S. cerevisiae and human ribosome, respectively. g, Misincorporation rate as quantified by ac4C-seq for all ac4C sites in the T. kodakarensis ribosome. The bar colour indicates the lowest growth temperature at which the site was detected. h, 3D representation of the T. kodakarensis ribosome with ac4C sites detected at 55 °C and 85 °C shown and colour-coded according to misincorporation rate in each temperature. i, Ac4Cs were shown to stabilize the T. kodakarensis ribosome via direct interactions with protein and RNA residues. An example of stabilization through RNA– protein interactions is presented in Fig. 4g. RNA–RNA interactions correspond to interactions of ac4C1434 with OP2 of A1786 of LSU. j, Temperature-dependent circular dichroism spectra of synthetic RNAs containing cytidine (blue) or ac4C (red). Solid and dashed lines represent mean and individual measurements, respectively. n = 3 independent experiments. θ, ellipticity at 260 nm.
Fig. 1 |
Fig. 1 |. Development and application of ac4C-seq in human and yeast.
a, Reaction schemes showing the reduction and the deacetylation of ac4C. b, Schematic showing the ac4C-seq procedure: RNA is deacetylated in the pre-treatment step (or mock-pretreated), followed by treatment with NaCNBH3 (or mock treatment). After library preparation as illustrated, ac4C is detected by the analysis of C>T misincorporation. c, Misincorporation rates in total RNA from HeLa cells are shown for known sites in 18S (blue, cytidine; red, thymidine). d, Misincorporation rates in 18S sites in wild-type and NAT10-depleted cells (bars, mean of 3 biological samples; dots, individual measurements). e, Misincorporation rates of 4 synthetic spikes measured by ac4C-seq (y axis) plotted against ac4C stoichiometry as measured by mass spectrometry (x axis). Pearson’s R, n = 1 experiment. f, Statistical significance plotted against the difference in misincorporation rates between NaCNBH3 and mock-treated total RNA from HeLa cells. Vertical dashed line, 5%; horizontal dashed line, P = 0.05 (χ2 test). n = 3 biological samples. g, Frequency of the 12 possible misincorporation patterns (y axis) for sites found in poly(A)-enriched RNA from wild-type (WT) HEK-293T cells and from HEK-293T cells overexpressing NAT10 and THUMPD1 (OE). The pie chart shows the proportion of sites harbouring C>T misincorporations within a CCG motif. h, Misincorporation rate at ac4C sites within CCG motifs identified in g in wild-type cells and in cells overexpressing NAT10 and THUMPD1, shown for RNA treated with NaCNBH3 and indicated controls (n = 2 biological samples for overexpression NaCNBH3- or mock-treated and 1 sample for the rest). For the box plots, the centre line indicates the median, the box boundaries mark the 25th and 75th percentiles, the whiskers indicate ±1.5× the interquartile range (IQR) and outliers are shown as individual dots. i, Misincorporation level (obtained from ac4C-seq) at amplicons spanning ac4C sites in HEK-293T cells, depicted as in d. n = 2 biological samples. j, k, Sequence motif surrounding the ac4C sites identified in indicated organisms. l, Misincorporation rate at two wild-type and mutated ac4C sites in HEK-293T cells overexpressing NAT10/THUMPD1, quantified via targeted ac4C-sequencing, depicted as in d. n = 2 biological samples.
Fig. 2 |
Fig. 2 |. Ac4C is present at unprecedented levels across diverse RNA species in archaea.
a, Relative quantification of ac4C in total RNA isolated from H. sapiens, S. cerevisiae, S. solfataricus and T. kodakarensis. Mean of n = 3 technical replicates. H. sapiens total RNA was isolated from HeLa cells. b, Distribution of misincorporations (as in Fig. 1g) across all identified sites in T. kodakarensis. Of the C>T misincorporation sites, 99% are embedded within a CCG motif. c, Correlation (Pearson’s R) between ac4C levels as measured by ac4C-seq and those measured by LC–MS, shown for 25 sites that were quantified by both methodologies. n = 2 and 1 independent samples for LC–MS and ac4C-seq experiments, respectively. d, Ac4C-seq quantification of sites identified in wild-type and ΔTkNAT10 strains. Box plot parameters are as in Fig. 1h. n = 4 and 2 independent biological samples for wild-type and ΔTk NAT10, respectively. e, The number of identified ac4C sites in the different RNA types as found in total RNA of different archaeal species. Note that for T. kodakarensis—but not for the others—ac4C-seq was applied also to rRNA-depleted RNA. Non-coding RNAs (ncRNAs) reflect sites in RNaseP RNA, signal-recognition-particle (SRP) RNA and small nucleolar RNA (snRNA), the latter being present only in P. furiosus. The phylogenetic tree represents evolutionary distance between the species. f, g, Correlation between misincorporation levels in ncRNA of T. kodakarensis and P. furiosus (f) and T. sp. AM4 (g), identified by ac4C-seq. Pearson’s R, n = 4 and 1 independent biological samples for T. kodakarensis and other archaea, respectively. Shading indicates 95% confidence interval for predictions from a linear model.
Fig. 3 |
Fig. 3 |. Ac4C accumulates in a temperature-dependent manner across all RNA species in archaea and is required for growth at higher temperatures.
a, Distributions of misincorporation level at ac4C sites across temperatures ranging from 55 to 95 °C. Box plot parameters are as in Fig. 1h. n = 4 biologically independent samples for 85 °C, n = 2 for 65 °C and 75 °C and n = 1 for 55 and 95 °C. b, Immuno-northern blot for the analysis of ac4C in T. kodakarensis total RNA as a function of temperature. Ethidium bromide staining is used to visualize total RNA. Results are representative of two biological replicates. For gel source data, see Supplementary Data 3. c, Schematic representation of a tRNA molecule. A total of 77 ac4C sites found within 19 tRNA species (indicated by the one-letter code of the relevant amino acid) were distributed across 13 distinct positions within the tRNA molecule. Each modified position is indicated by an orange circle. Numbers indicate position within the tRNA. Note that positions in the variable region are not numbered. d, Wild-type T. kodakarensis and ΔTkNAT10 cells were grown at diverse temperatures (65–95 °C), and the optical density at 600 nm (OD600) was measured hourly. The average curve of each replicate is shown by the thick line (n = 11 for 95 °C and n = 12 for each of 65–85 °C), and individual replicates are shown by thin lines. e, Quantification by ac4C-seq of total RNA collected from cells grown at a range of temperatures. Shown are misincorporation levels for ac4C sites identified in P. furiosus and T. sp. AM4. Box plot visualization parameters are as in Fig. 1h. n = 1 biological sample per condition.
Fig. 4 |
Fig. 4 |. Cryo-EM structure of wild-type and ac4C-deficient T. kodakarensis ribosomes.
a, Ac4C distribution as observed by a cryo-EM image of wild-type T. kodakarensis grown at 85 °C. Modified residues are highlighted in orange, rRNA in grey and r-proteins are contoured in black. b, c, Ac4Cs participate in Watson–Crick pairing with guanine residues. b, An example of ac4C density shown in mesh. Residues correspond to ac4C2159 and G2725 of LSU. Acetate is highlighted yellow and is indicated by an arrow. c, The same position in the ΔTkNAT10 strain indicates that, in the mutant, the acetyl moiety is replaced by a structured solvent molecule. d, Ac4C in T. kodakarensis ribosomes derived from archaea grown at different temperatures, identified by ac4C-seq and LC–MS. e, ‘Core’ ac4Cs (shown in red) present at high stoichiometries across temperatures are enriched in the intersubunit interface and are in proximity to eL41 and to the ribosomal substrates. The functional ribosome regions indicated are the decoding centre (DC), the peptidyl-transferase centre (PTC) and the protein exit tunnel (ET). tRNA and mRNA are highlighted yellow, eL41 is shown in purple. The tRNA and mRNA coordinates are from PDB structure 4V5D. f, Misincorporation at core and auxiliary sites from T. kodakarensis and their conserved counterparts in P. furiosus and T. sp. AM4, grown at optimal growth temperatures (85 °C for T. kodakarensis and T. sp. AM4 and 95 °C for P. furiosus). n = 4 and 1 independent biological samples for T. kodakarensis and other archaea, respectively. Box plot visualization parameters are as in Fig. 1h. g, A representative example of the electrostatic interaction between ac4C and ribosomal proteins is shown between O(7) of ac4C1459 at h45 of small-subunit (SSU) and R15 of eL41 (top). The same position in the ΔTkNAT10 strain (bottom) implicates a solvent molecule that serves to mediate the same interaction network in the absence of an acetyl group. h, Thermal melting curves of synthetic RNA hairpin containing C (black) or ac4C (red) obtained by differential scanning calorimetry (DSC). Cp, heat capacity; Tm, melting temperature. Data are mean ± s.d. of n = 3 independent experiments.

References

    1. Sharma S et al. Yeast Kre33 and human NAT10 are conserved 18S rRNA cytosine acetyltransferases that modify tRNAs assisted by the adaptor Tan1/THUMPD1. Nucleic Acids Res 43, 2242–2258 (2015). - PMC - PubMed
    1. Ito S et al. A single acetylation of 18S rRNA is essential for biogenesis of the small ribosomal subunit in Saccharomyces cerevisiae. J. Biol. Chem 289, 26201–26212 (2014). - PMC - PubMed
    1. Ito S et al. Human NAT10 is an ATP-dependent RNA acetyltransferase responsible for N4-acetylcytidine formation in 18 S ribosomal RNA (rRNA). J. Biol. Chem 289, 35724–35730 (2014). - PMC - PubMed
    1. Larrieu D, Britton S, Demir M, Rodriguez R & Jackson SP Chemical inhibition of NAT10 corrects defects of laminopathic cells. Science 344, 527–532 (2014). - PMC - PubMed
    1. Tschida BR et al. Sleeping Beauty insertional mutagenesis in mice identifies drivers of steatosis-associated hepatic tumors. Cancer Res 77, 6576–6588 (2017). - PMC - PubMed

Publication types

MeSH terms