Review
. 2020 Aug;44(8):1636-1652.
doi: 10.1038/s41366-020-0608-5. Epub 2020 Jun 18.

Hunger and BMI modulate neural responses to sweet stimuli: fMRI meta-analysis

Affiliations
Review

Hunger and BMI modulate neural responses to sweet stimuli: fMRI meta-analysis

Eunice Y Chen et al. Int J Obes (Lond). 2020 Aug.

Abstract

Objective: Consuming sweet foods, even when sated, can lead to unwanted weight gain. Contextual factors, such as longer time fasting, subjective hunger, and body mass index (BMI), may increase the likelihood of overeating. Nevertheless, the neural mechanisms underlying these moderating influences on energy intake are poorly understood.

Methods: We conducted both categorical meta-analysis and meta-regression of factors modulating neural responses to sweet stimuli, using data from 30 functional magnetic resonance imaging (fMRI) articles incorporating 39 experiments (N = 995) carried out between 2006 and 2019.

Results: Responses to sweet stimuli were associated with increased activity in regions associated with taste, sensory integration, and reward processing. These taste-evoked responses were modulated by context. Longer fasts were associated with higher posterior cerebellar, thalamic, and striatal activity. Greater self-reported hunger was associated with higher medial orbitofrontal cortex (OFC), dorsal striatum, and amygdala activity and lower posterior cerebellar activity. Higher BMI was associated with higher posterior cerebellar and insular activity.

Conclusions: Variations in fasting time, self-reported hunger, and BMI are contexts associated with differential sweet stimulus responses in regions associated with reward processing and homeostatic regulation. These results are broadly consistent with a hierarchical model of taste processing. Hunger, but not fasting or BMI, was associated with sweet stimulus-related OFC activity. Our findings extend existing models of taste processing to include posterior cerebellar regions that are associated with moderating effects of both state (fast length and self-reported hunger) and trait (BMI) variables.


Conflict of interest statement

Conflict of interest The authors declare that they have no conflict of interest.

Figures

Fig. 1
Fig. 1
Preferred reporting items for systematic reviews and meta-analyses flow diagram, from ref. [101].
Fig. 2
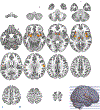
Fig. 2. Activation likelihood estimation meta-analysis of sweet stimuli relative to a basal condition.
Increased activity is in RED/YELLOW. The critical threshold was p = 0.05, Family-wise error cluster corrected, with a cluster-forming threshold of p = 0.001. Montreal Neurological Institute coordinates.
Fig. 3
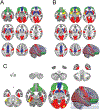
Fig. 3. Separate meta-regression results for hours fasted, hunger, and body mass index as predictors of response to sweet stimuli relative to basal conditions.
a Meta-regression of hours fasted as a predictor of response to sweet stimuli relative to basal conditions; b Meta-regression of hunger as a predictor of response to sweet stimuli relative to basal conditions; and c Meta-regression of body mass index as a predictor of response to sweet stimuli relative to a basal condition. All meta-regressions were conducted using an AES-SDM uncorrected threshold of p < 0.005, cluster extent of ten voxels, where SDM-Z ≤ ± 1.0. Increased activity is in RED/YELLOW, decreased activity in BLUE/GREEN. Montreal Neurological Institute coordinates.
Fig. 4
Fig. 4. Hierarchical model of taste processing of Rolls, 2015, 2016a, 2016b, 2019 [–42].
a Hierarchical model of taste processing. Tier 1 (RED) encodes gustatory, olfactory, visual, auditory, and somatosensory processing. Tier 2 (GREEN) involves reward evaluation in the OFC and amygdala. Tier 3 (BLUE) includes areas involved in decision-making, such as the medial prefrontal cortex, striatum, anterior cingulate cortex, lateral hypothalamus, and insula; b The meta-regression of positive self-reported hunger effects associated with taste processing (YELLOW) superimposed on the hierarchical model shows modulation of primarily Tier 2 and Tier 3 regions, including the OFC, and c the meta-regression of negative self-reported hunger effects (YELLOW) shows modulation of cerebellar regions, bilateral Crus I, not posited by the hierarchical model.

References

    1. Small DM. Flavor is in the brain. Physiol Behav. 2012;107:540–52. - PubMed
    1. Huerta CI, Sarkar PR, Duong TQ, Laird AR, Fox PT. Neural bases of food perception: coordinate-based meta-analyses of neuroimaging studies in multiple modalities. Obesity. 2014;22:1439–46. - PMC - PubMed
    1. Veldhuizen MG, Albrecht J, Zelano C, Boesveldt S, Breslin P, Lundstrom JN. Identification of human gustatory cortex by activation likelihood estimation. Hum Brain Mapp. 2011;32:2256–66. - PMC - PubMed
    1. Yeung AWK, Tanabe HC, Suen JLK, Goto TK. Taste intensity modulates effective connectivity from the insular cortex to the thalamus in humans. Neuroimage. 2016;135:214–22. - PubMed
    1. Yeung AndyWaiKan, Goto Tazuko K, Keung LW. Basic taste processing recruits bilateral anteroventral and middle dorsal insulae: an activation likelihood estimation meta‐analysis of fMRI studies. Brain Behav. 2017;7:e00655. - PMC - PubMed

Substances