

Spatio-temporal dynamics of arbuscular mycorrhizal fungi and soil organic carbon in coastal saline soil of China
- PMID: 32555531
- PMCID: PMC7300096
- DOI: 10.1038/s41598-020-66976-w
Spatio-temporal dynamics of arbuscular mycorrhizal fungi and soil organic carbon in coastal saline soil of China
Abstract
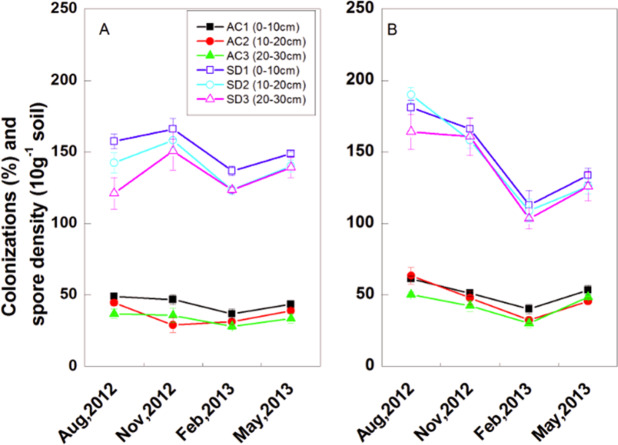
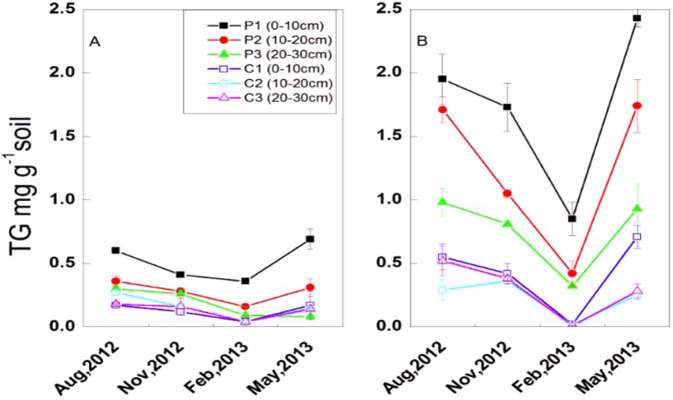
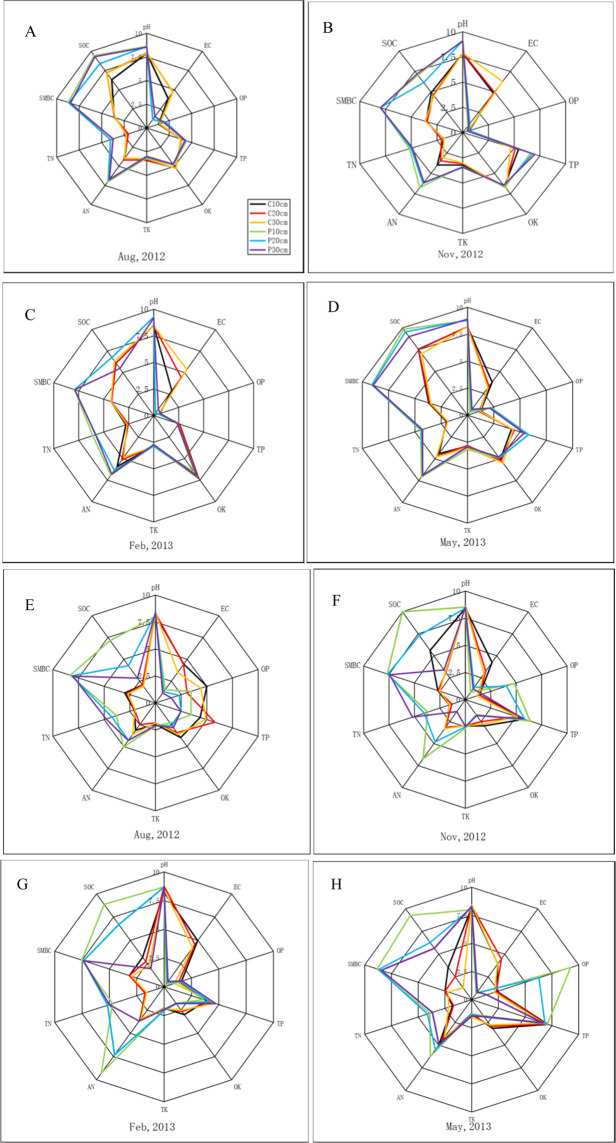
A comprehensive understanding of the relationship between arbuscular mycorrhizal (AM) fungi and coastal saline soil organic carbon (SOC) is crucial for analysis of the function of coastal wetlands in soil carbon sequestration. In a field experiment, the temporal and spatial dynamics of AM fungi, glomalin-related soil protein (GRSP) - which is described as a N-linked glycoprotein and the putative gene product of AM fungi, SOC, and soil aggregates were investigated in halophyte Kosteletzkya virginica rhizosphere soil of coastal saline areas of North Jiangsu, China. Soil samples were collected from a depth of up to 30 cm in two plantation regions from August 2012 to May 2013. Results showed K. virginica formed a strong symbiotic relationship to AM fungi. AM colonization and spore density were the highest in the 10-20 cm soil layer of Jinhai farm in August 2012, because of the presence of numerous fibrous roots in this soil layer. The total GRSP and SOC were the highest in the 0-10 cm soil layer in May 2013 and November 2012, respectively. Correlation coefficient analysis revealed that AM colonization and spore density were positively correlated with total GRSP. Meanwhile, total GRSP was significantly positively correlated with large macroaggregates (>3 mm), SOC, total P, Olsen P, and soil microbial biomass carbon (SMBC), but negatively correlated with microaggregates (<0.25 mm), soil EC, total N, and pH. SOC was positively correlated with spore density, large macroaggregates, small macroaggregates (2-0.25 mm), alkaline N, and SMBC and negatively correlated with microaggregates, EC, pH, and total K. Although it may be a statistical artifact, we found an interesting phenomenon that there was no significant correlation between soil aggregates and AM colonization or spore density. Hence, total GRSP is a vital source of saline soil C pool and an important biological indicator for evaluating coastal saline SOC pool and soil fertility, while AM colonization or spore density may not be.
Conflict of interest statement
The authors declare no competing interests.
Figures

References
-
- Zhao F, et al. Spatiotemporal features of the hydro-biogeochemical cycles in a typical loess gully watershed. Ecol. Indic. 2018;91:542–554.
-
- Sun P, et al. Remote sensing and modeling fusion for investigating the ecosystem water-carbon coupling processes. Sci. Total Environ. 2019;697:134064. - PubMed
-
- Osland MJ, et al. Climate and plant controls on soil organic matter in coastal wetlands. Global Change Biol. 2018;24(11):5361–5371. - PubMed
-
- Blanco-Canqui H, Lal R. Mechanisms of carbon sequestration in soil aggregates. Crit. Rev. Plant Sci. 2004;23:481–504.
-
- Jiménez J, Lal R. Mechanisms of C sequestration in soils of Latin America. Crit. Rev. Plant Sci. 2006;25:337–365.
Publication types
MeSH terms
Substances
LinkOut - more resources
Full Text Sources
