. 2020 Jun 18;15(6):e0234645.
doi: 10.1371/journal.pone.0234645. eCollection 2020.

Preparation of a phosphotyrosine-protein standard for use in semiquantitative western blotting with enhanced chemiluminescence

Affiliations

Preparation of a phosphotyrosine-protein standard for use in semiquantitative western blotting with enhanced chemiluminescence

Nancy Kendrick et al. PLoS One. .

Abstract

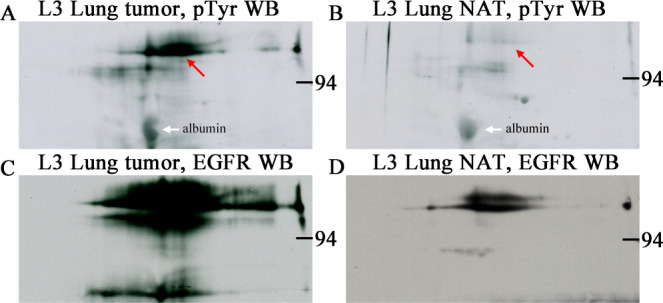
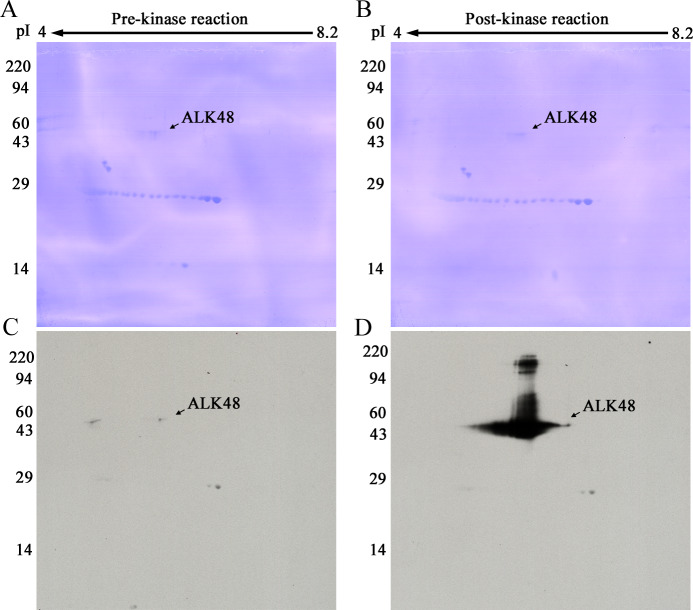
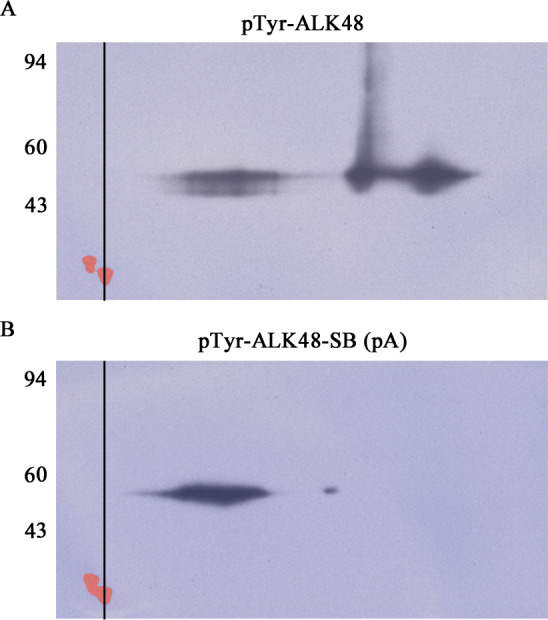
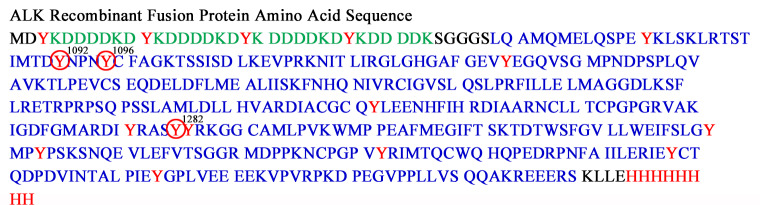
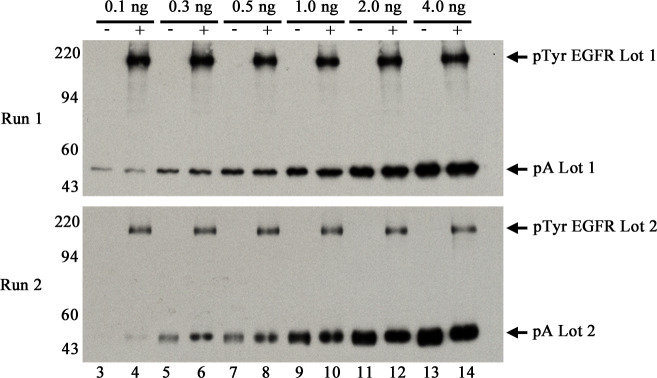
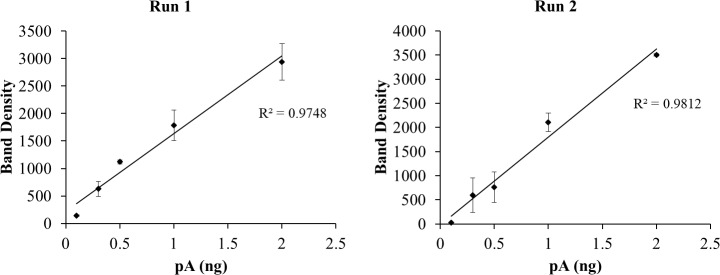
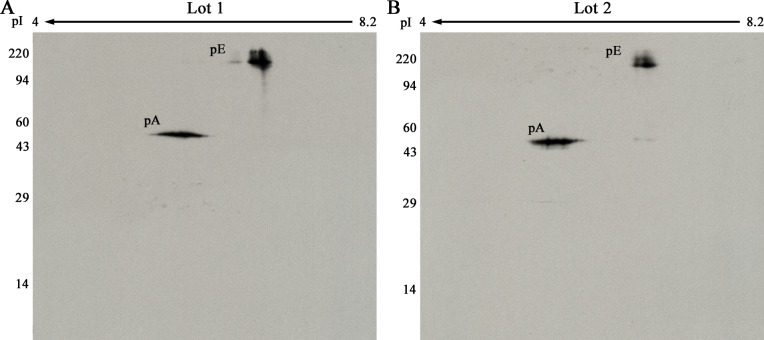
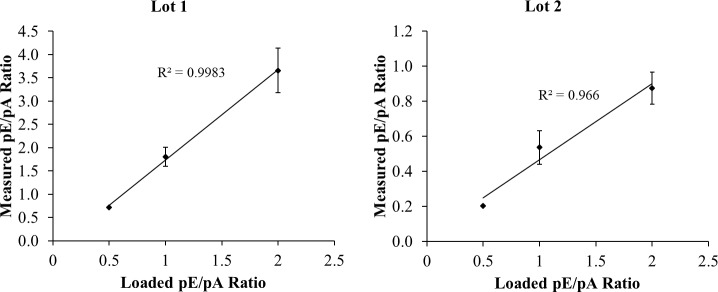
Protein tyrosine phosphorylation is key to activation of receptor tyrosine kinases (RTK) that drive development of some cancers. One challenge of RTK-targeted therapy is identification of those tumors that express non-mutated but activated RTKs. Phosphotyrosine (pTyr) RTK levels should be more predictive of the latter than expressed total protein. Western blotting (WB) with a pTyr antibody and enhanced chemiluminescence (ECL) detection is sufficiently sensitive to detect pTyr-RTKs in human tumor homogenates. Presentation of results by comparing WB images, however, is wanting. Here we describe the preparation of a new pTyr-protein standard, pTyr-ALK48-SB (pA), derived from a commercial anaplastic lymphoma kinase (ALK) recombinant fragment, and its use to quantify pTyr-epidermal growth factor receptor (pTyr-EGFR) in commercial A431 cell lysates. Linearity of one-dimensional (1D) WB plots of pA band density versus load as well as its lower level of detection (0.1 ng, 2 fmole) were determined for standardized conditions. Adding pA to two lots of A431 cell lysates with high and low pTyr-EGFR allowed normalization and quantification of the latter by expressing results as density ratios for both 1D and 2D WB. This approach is semi-quantitative because unknown RTKs may be outside the linear range of detection. Semiquantitative ratios are an improvement over comparisons of images without a reference standard and facilitate comparisons between samples.


Conflict of interest statement

The authors have read the journal's policy and the authors of this manuscript have the following competing interests: NK, JJ, GP, MH, AD, and SC are paid employees of Kendrick Labs, Inc. A US Patent has been applied for by Kendrick Labs, Inc. entitled “Protein Standard Compositions and Methods of Making and Using The Same” [U.S. Patent Application No. is: 15/808,006]. However, this does not alter our adherence to all PLOS ONE policies on sharing data and materials.

Figures

Fig 1
Fig 1. Phosphotyrosine 2D WB signal detected in human lung tumor and normal adjacent tissue samples comigrates with EGFR signal.
Phosphotyrosine (A and B) and EGFR (C and D) 2D western blots from human lung tumor (squamous cell carcinoma, A and C) and normal adjacent tissue (NAT, B and D) samples purchased from a tissue bank, Bio-IVT. Sample load was 200 μg total protein for each of the four 2D gels. The pTyr-protein signal (red arrows) was strong in the tumor tissue and faint in NAT and co-migrated with the EGFR signal in both. The heavily glycosylated EGFR protein gives a large blurry spot profile due to glycan microheterogeneity. Samples were identically prepared by homogenization in SDS buffer with heating. White arrows indicate nonspecific binding to albumin, an abundant protein that serves as a 2D pI/MW marker.
Fig 2
Fig 2
2D PVDFs (A, B) and pTyr WBs (C, D). ALK48 protein pre- (A, C) and post- (B, D) kinase reaction. A and C are from a 2D gel loaded with 1 μg ALK48. B and D are from an identically run second gel loaded with 1 μg of the same protein after the kinase reaction. Western blots are both from 3-min Kodak MR film exposures. Carbamylated carbonic anhydrase pI markers were added. Molecular weight markers are shown on the left.
Fig 3
Fig 3
2D SDS PAGE WBs of pTyr-ALK48 before (A) and after (B) sulfhydryl blocking by alkylation with IAA. Each WB film image has been superimposed over its corresponding Coomassie blue stained PVDF blot image so that the tropomyosin standard spots, pI 5.2, MW 33 kDa, visible only by Coomassie staining, can be aligned via the vertical line. The Coomassie tropomyosin spots were colored red in Adobe Elements. The alkylation reaction caused the multiple charge forms observed in 2A to condense into a major and minor 2D spot with reduced streaking in 2B. Each 2D gel was loaded with 20 ng of pTyr-ALK48.
Fig 4
Fig 4. Tyrosine residues Y1096 and Y1282, and to a lesser extent Y1092 are phosphorylated on the pA fragment during the kinase reaction.
A red circle indicates a phosphorylated tyrosine residue. Green indicates the Flag tag residues. Red indicates HIS6 tag and tyrosine residues (Y). Blue indicates the ALK fragment residues. Three μg of protein was run on the 1D gels used for pA band cutting.
Fig 5
Fig 5. Representative images of 1D pTyr WBs run on separate days in triplicate (Runs 1 and 2).
Both sets were loaded with increasing amounts of pA (Lot 1 for Run 1 and Lot 2 for Run 2) as follows: lane 3–4, 0.1 ng; lanes 5–6, 0.3 ng; 7–8, 0.5 ng; 9–10, 1.0 ng; 11–12, 2.0 ng, and 13–14, 4.0 ng. Run 1 gels were loaded with 5 μl pE Lot 1 in even lanes; Run 2 gels were loaded with 5 μl pE Lot 2 in even lanes. Proteins in the 1D gels were transblotted onto PVDF followed by pTyr WB as described in methods. Three and 10-min films were obtained for each WB; 10-min films from the second gel for each run are shown.
Fig 6
Fig 6. Plots of pTyr band density versus ng pA loaded for WBs shown in Fig 5.
The 4-ng point, in the saturated region of the curve, was omitted. All points are n = 2 lanes except the 0.1 ng point in Run 2 for which n = 1.
Fig 7
Fig 7
2D pTyr WB with 20 μl of pE Lot 1 (A) or Lot 2 (B) plus 2 ng of pA. The molecular weight range is shown on the left, direction of isoelectric focusing on the top. The pE spot is fuzzy because of charge and molecular weight heterogeniety due to glycosylation [15].
Fig 8
Fig 8. Plots of average measured pE/pA density ratios vs. loaded density ratio.
Measured ratios are taken from 3-min and 10-min WBs of eight 2D gels each for pE lots 1 and 2. N = 4 for the 0.5 and 2.0 points, and 8 for the 1.0 point (X and Xd). Error bars show ± 1 SD.

References

    1. Du Z, Lovly CM. Mechanisms of receptor tyrosine kinase activation in cancer. Mol Cancer. 2018;17(1):58 10.1186/s12943-018-0782-4 - DOI - PMC - PubMed
    1. Weinberg RA. The biology of cancer. Second edition ed. New York: Garland Science, Taylor & Francis Group; 2014. xx, 876, A 6, G 30, I 28 pages p.
    1. Rodrigues JG, Balmana M, Macedo JA, Pocas J, Fernandes A, de-Freitas-Junior JCM, et al. Glycosylation in cancer: Selected roles in tumour progression, immune modulation and metastasis. Cell Immunol. 2018;333:46–57. 10.1016/j.cellimm.2018.03.007 - DOI - PubMed
    1. Schultz MJ, Swindall AF, Bellis SL. Regulation of the metastatic cell phenotype by sialylated glycans. Cancer Metastasis Rev. 2012;31(3–4):501–18. 10.1007/s10555-012-9359-7 - DOI - PMC - PubMed
    1. Genova C, Hirsch FR. Clinical potential of necitumumab in non-small cell lung carcinoma. Onco Targets Ther. 2016;9:5427–37. 10.2147/OTT.S114039 - DOI - PMC - PubMed

Publication types