. 2020 Jun 17;15(6):e0233296.
doi: 10.1371/journal.pone.0233296. eCollection 2020.

Identifying and predicting Parkinson's disease subtypes through trajectory clustering via bipartite networks

Affiliations

Identifying and predicting Parkinson's disease subtypes through trajectory clustering via bipartite networks

Sanjukta Krishnagopal et al. PLoS One. .

Abstract

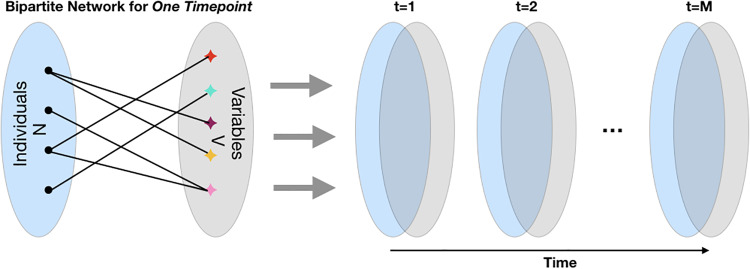
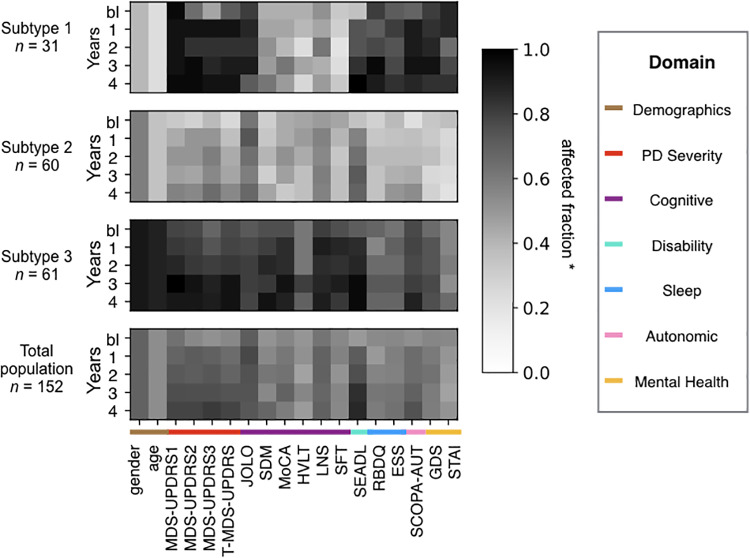
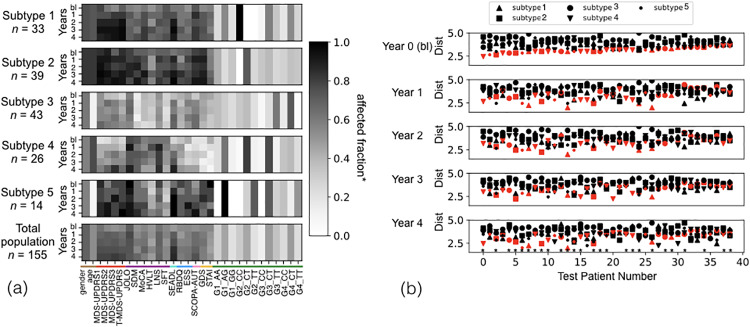
Chronic medical conditions show substantial heterogeneity in their clinical features and progression. We develop the novel data-driven, network-based Trajectory Profile Clustering (TPC) algorithm for 1) identification of disease subtypes and 2) early prediction of subtype/disease progression patterns. TPC is an easily generalizable method that identifies subtypes by clustering patients with similar disease trajectory profiles, based not only on Parkinson's Disease (PD) variable severity, but also on their complex patterns of evolution. TPC is derived from bipartite networks that connect patients to disease variables. Applying our TPC algorithm to a PD clinical dataset, we identify 3 distinct subtypes/patient clusters, each with a characteristic progression profile. We show that TPC predicts the patient's disease subtype 4 years in advance with 72% accuracy for a longitudinal test cohort. Furthermore, we demonstrate that other types of data such as genetic data can be integrated seamlessly in the TPC algorithm. In summary, using PD as an example, we present an effective method for subtype identification in multidimensional longitudinal datasets, and early prediction of subtypes in individual patients.


Conflict of interest statement

Data was obtained from the Parkinson’s Progression Markers Initiative (PPMI). PPMI, a public-private partnership, is funded by the Michael J. Fox Foundation for Parkinson’s Research and funding partners, including Abbvie, Allergan, Avid Radiopharmaceuticals, Biogen, Biolegend, Bristol-Myers Squibb, Celgene, Denali, GE Healthcare, Genentech, gsk, Lilly, Pfizer, Merck, MSD, Lundbeck, Piramal, Prevail Therapeutics, Roche, Sanofi Genzyme, Servier, Takeda, Teva, Ucb, Verily, Voyager Therapeutics and Golub Capital. There are no patents, products in development or marketed products to declare. This does not alter our adherence to PLOS ONE policies on sharing data and materials.

Figures

Fig 1
Fig 1. Description of PPMI Data.
Data includes two demographic variables, outcome variables from six clinical domains, and four genetic single nucleotide polymorphisms.
Fig 2
Fig 2. Stacking bipartite networks across time.
An illustration of an individual-variable bipartite graph at one timestep (left). Set of bipartite graphs across time (right).
Fig 3
Fig 3. Variable profiles of the Parkinson’s subtypes identified by the TPC algorithm.
Subtypes/communities identified by our algorithm: top three panels show three subtype/community profiles (average profile of all patients in the subtype). Subtypes identified by the algorithm containing fewer than 10 patients are not shown (3 patients fall under this category). The bottom panel shows the total population profile. The shade of grey indicates the affected fraction, i.e, fraction above baseline median in the direction of disease progression for the continuous variables, and fraction that is male for gender. n is the number of patients in the subtype. The variable names are listed below the panels (See Fig 1 for description).
Fig 4
Fig 4. Prediction of test patients into the subtypes.
The ith panel (row) shows the distance between the test patient ith year profile and the ith year subtype profile (shape coded). The predicted subtype for each individual (subtype with minimum baseline-year distance) is colored red to allow for tracking across the years (panels). Prediction accuracy in year 4 is 72%. Patients whose year 4 subtype is correctly predicted from their baseline data are designed by a star. Data includes 39 test patients and 18 clinical variables across 5 time points: baseline (bl) or year 0 + years 1,2,3,4).
Fig 5
Fig 5. Variable profiles and test patient subtype prediction using clinical and genetic data.
(a) Top five panels show five average community (subtype) profiles, identified by our TPC algorithm. The bottom panel shows the total population profile. The legend is a measure of the affected fraction, i.e, fraction above baseline median in the direction of disease progression for the continuous variables, and fraction that is male and fraction containing the genetic SNP for gender and genetic variables respectively. n is the number of patients in the community. (b) The mth panel shows the distance between the test patient mth year profile and the mth year profile of the subtypes (shape coded). The predicted subtype for each individual (subtype with minimum baseline distance) is colored red to allow for tracking across the years (panels). Prediction accuracy in year 4 is 67%. Patients whose year 4 subtype is correctly predicted from their baseline data are designed by a star. Data includes 39 test patients and 18 clinical variables across 5 time points: baseline (bl) or year 0 + years 1,2,3,4.
Fig 6
Fig 6. Statistical analysis.
Statistical analysis comparing the 3 subtypes described in the main text: mixed, mild, and severe. Features of the total population are also listed. Medians are calculated from the raw data. Variables with negative directions are denoted by an asterisk (*). Comparisons meeting our criteria for statistical significance are shown in bold blue text. The top box (A) provides statistics for the baseline clinical variables, the middle box (B) for the year 4 clinical variables, and the bottom box (C) for demographics.

References

    1. Pringsheim T, Jette N, Frolkis A, Steeves TD. The prevalence of Parkinson’s disease: A systematic review and meta-analysis. Movement disorders. 2014;29(13):1583–1590. 10.1002/mds.25945 - DOI - PubMed
    1. Lees AJ, Hardy J, Revesz T. Parkinson’s Disease. Lancet. 2009;374 (9691).
    1. Foltynie T, Brayne C, Barker RA. The heterogeneity of idiopathic Parkinson’s disease. Journal of neurology. 2002;249(2):138–145. 10.1007/PL00007856 - DOI - PubMed
    1. von Coelln R, Shulman LM. Clinical subtypes and genetic heterogeneity: of lumping and splitting in Parkinson disease. Current opinion in neurology. 2016;29(6):727–734. 10.1097/WCO.0000000000000384 - DOI - PubMed
    1. Marras C, and Lang A. Parkinson’s disease subtypes: lost in translation? J Neurol Neurosurg Psychiatry. 2013;84(4):209–415. 10.1136/jnnp-2012-303455 - DOI - PubMed

Publication types