. 2020 Jul 28;324(4):390-392.
doi: 10.1001/jama.2020.11370.

Associations Between Built Environment, Neighborhood Socioeconomic Status, and SARS-CoV-2 Infection Among Pregnant Women in New York City

Affiliations

Associations Between Built Environment, Neighborhood Socioeconomic Status, and SARS-CoV-2 Infection Among Pregnant Women in New York City

Ukachi N Emeruwa et al. JAMA. .

Abstract

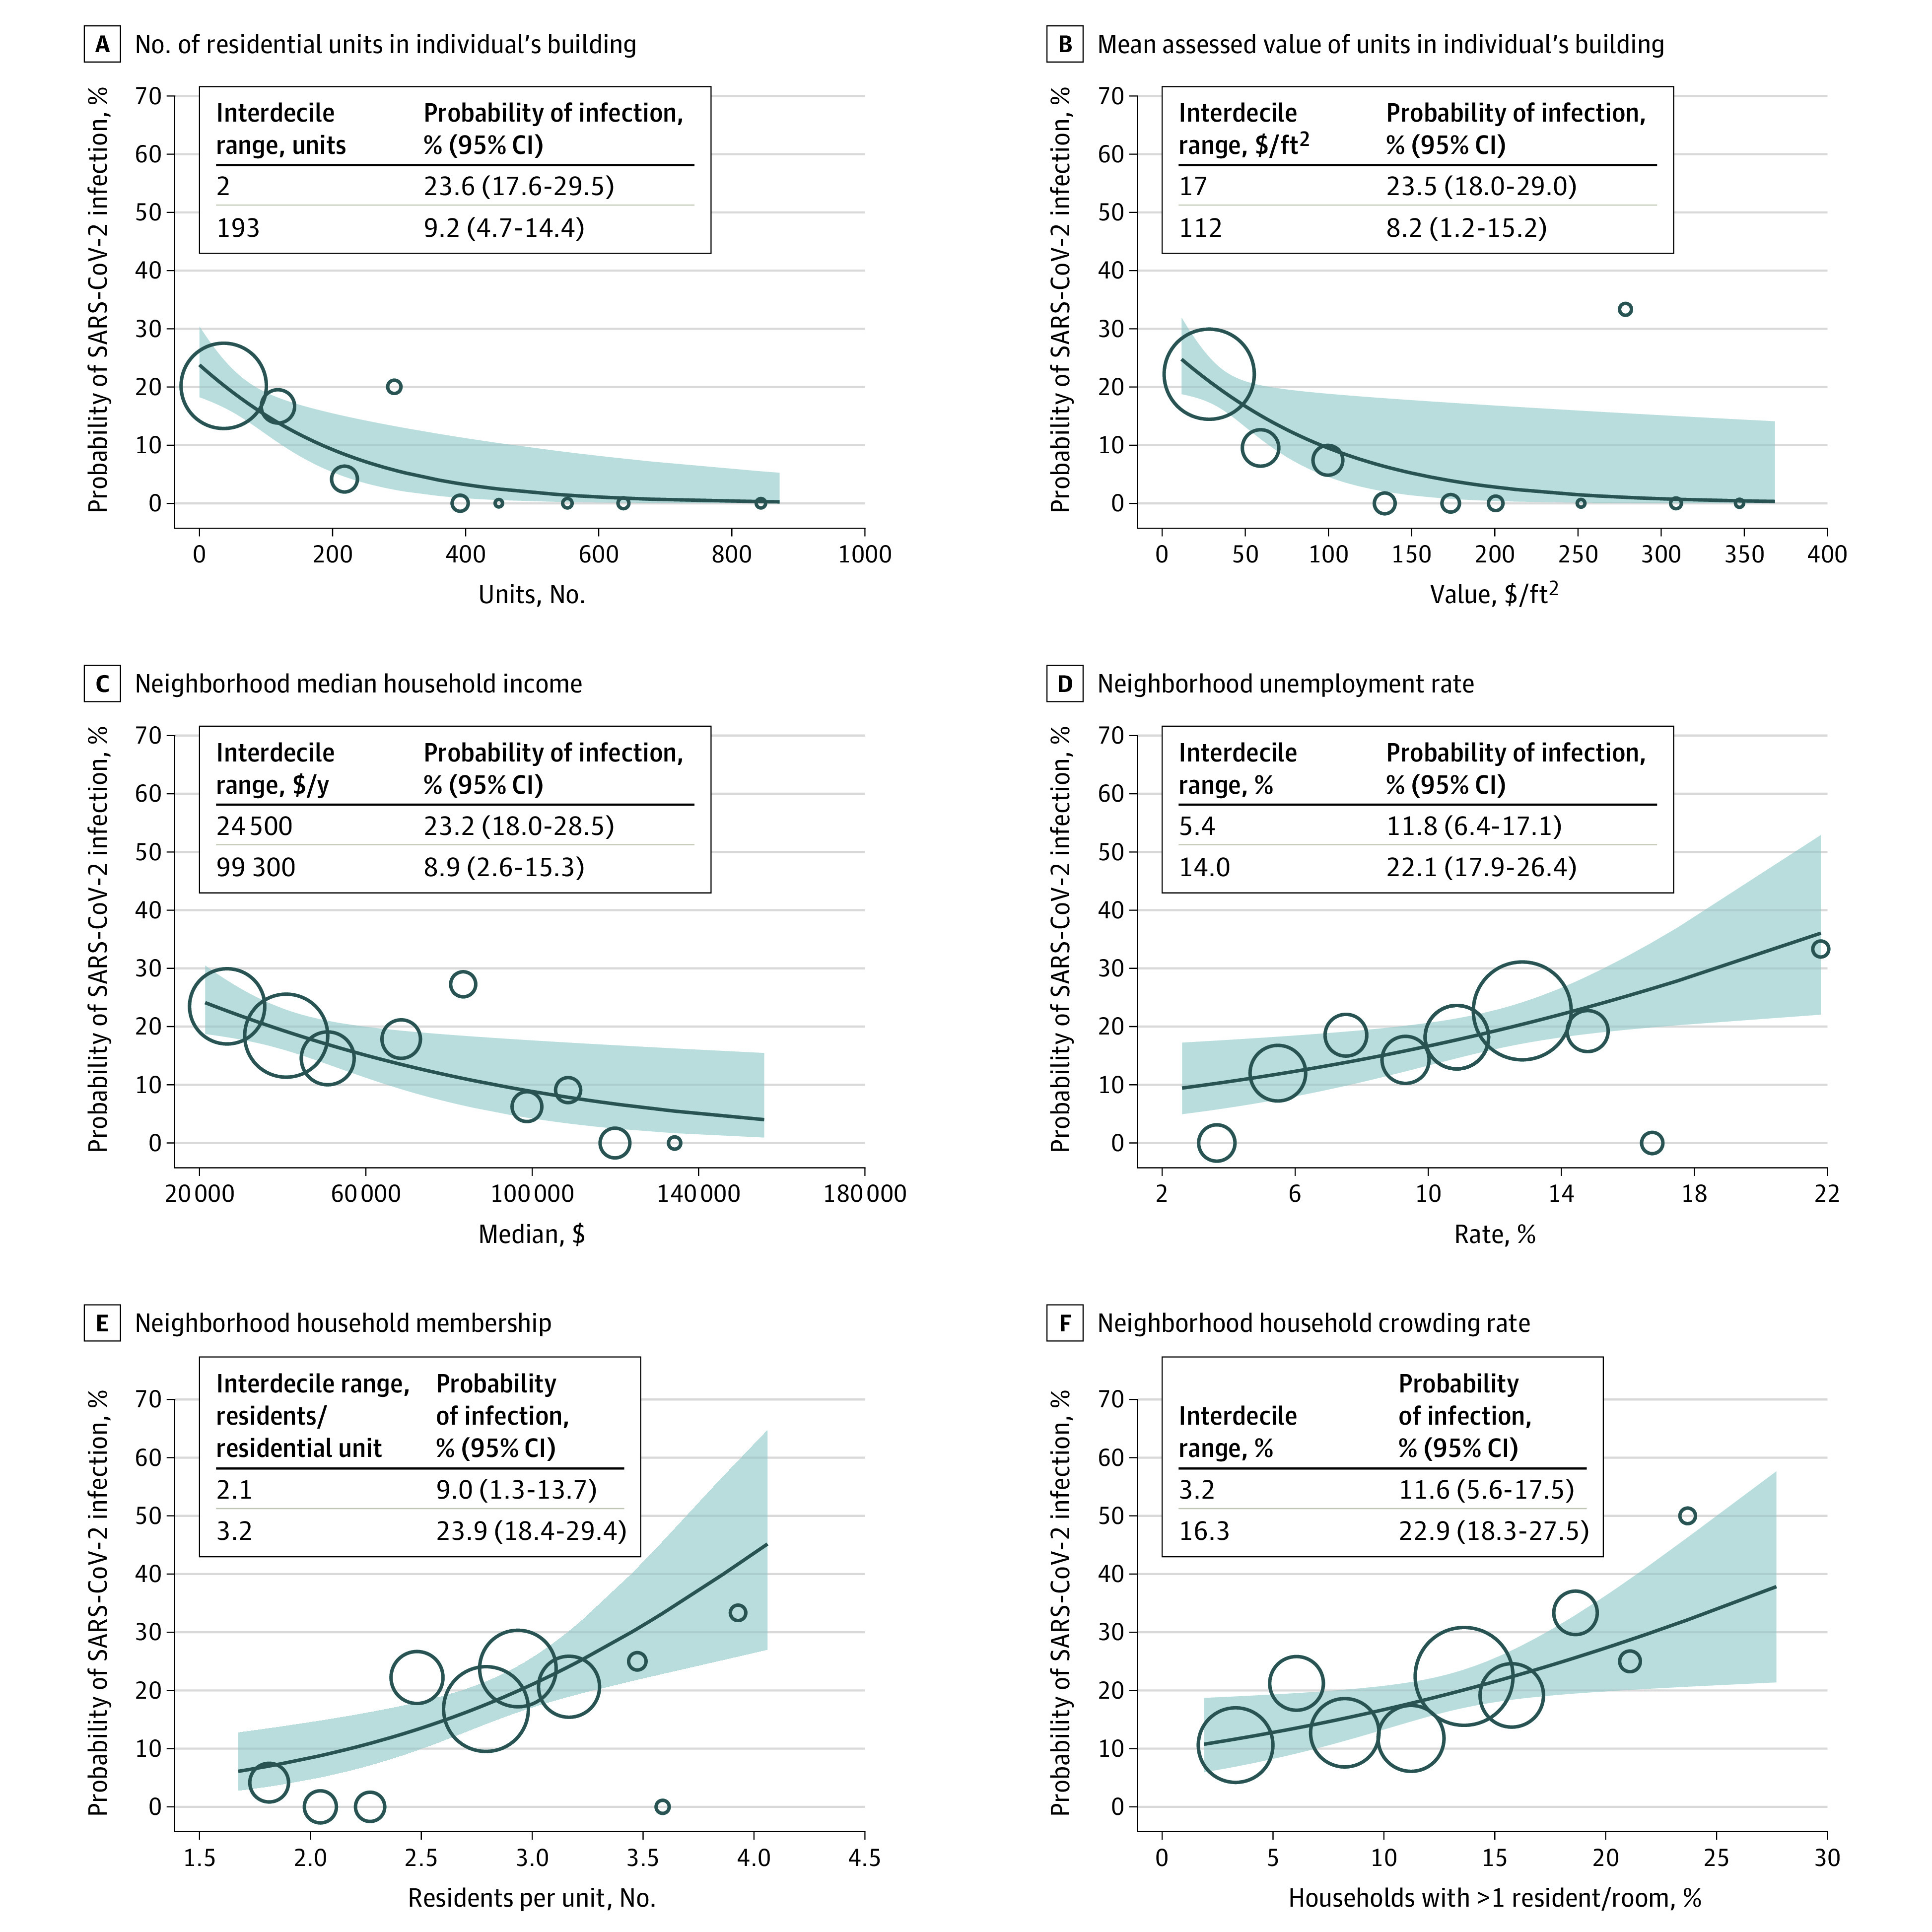
This cross-sectional study investigates associations of residential building characteristics and markers of neighborhood socioeconomic status (SES) with screen-detected SARS-CoV-2 prevalence among pregnant women delivering in 2 New York City hospitals.


Conflict of interest statement

Conflict of Interest Disclosures: Dr Shaman and Columbia University reported partial ownership of SK Analytics. Dr Shaman reported receiving personal fees from Business Networking International and Merck. Dr Gyamfi-Bannerman reported receiving grants from Eunice Kennedy Shriver National Institute of Child Health and Human Development, the National Heart, Lung, and Blood Institute, and AMAG/Society for Maternal-Fetal Medicine and receiving personal fees from Sera. Dr Wright reported receiving grants from Merck and receiving personal fees from Clovis Oncology. No other disclosures were reported.

Figures

Figure.
Figure.. Built Environment and Neighborhood Socioeconomic Factors Associated With SARS-CoV-2 Infection Among Pregnant Women
Values plotted against the probability of identifying severe acute respiratory syndrome coronavirus 2 (SARS-CoV-2) infection at universal testing. Solid lines indicate the predicted probability of infection from bivariable logistic regression models; shaded areas, 95% confidence bands. For each independent variable, circles are plotted at the mean values of the women residing in 10 equal-width bins. The circle size is proportionate to the number of women within each bin. Since bins may contain no patients, there are fewer than 10 circles in some panels. Interdecile range indicates 10th and 90th percentiles. The probability (and 95% CI) of SARS-CoV-2 infection for women at the 10th and 90th percentile of each independent variable was predicted from the regressions shown in each panel.

Similar articles

Cited by

References

    1. Pinter-Wollman N, Jelić A, Wells NM. The impact of the built environment on health behaviours and disease transmission in social systems. Philos Trans R Soc Lond B Biol Sci. 2018;373(1753):20170245. doi:10.1098/rstb.2017.0245 - DOI - PMC - PubMed
    1. Virtanen M, Terho K, Oksanen T, et al. . Patients with infectious diseases, overcrowding, and health in hospital staff. Arch Intern Med. 2011;171(14):1296-1298. doi:10.1001/archinternmed.2011.313 - DOI - PubMed
    1. Wadhera RK, Wadhera P, Gaba P, Figueroa JF, Joynt Maddox KE, Yeh RW, Shen C. Variation in COVID-19 hospitalizations and deaths across New York City boroughs. JAMA. 2020;323(21):2192-2195. doi:10.1001/jama.2020.7197 - DOI - PMC - PubMed
    1. American Community Survey by neighborhood tabulation area. New York City Department of City Planning. Accessed May 6, 2020. https://www1.nyc.gov/site/planning/data-maps/open-data/dwn-acs-nta.page
    1. PLUTO database. New York City Department of City Planning. Accessed May 6, 2020. https://www1.nyc.gov/site/planning/data-maps/open-data.page

Publication types

MeSH terms