

A clinician's guide for developing a prediction model: a case study using real-world data of patients with castration-resistant prostate cancer
- PMID: 32556680
- PMCID: PMC7324416
- DOI: 10.1007/s00432-020-03286-8
A clinician's guide for developing a prediction model: a case study using real-world data of patients with castration-resistant prostate cancer
Abstract
Purpose: With the increasing interest in treatment decision-making based on risk prediction models, it is essential for clinicians to understand the steps in developing and interpreting such models.
Methods: A retrospective registry of 20 Dutch hospitals with data on patients treated for castration-resistant prostate cancer was used to guide clinicians through the steps of developing a prediction model. The model of choice was the Cox proportional hazard model.
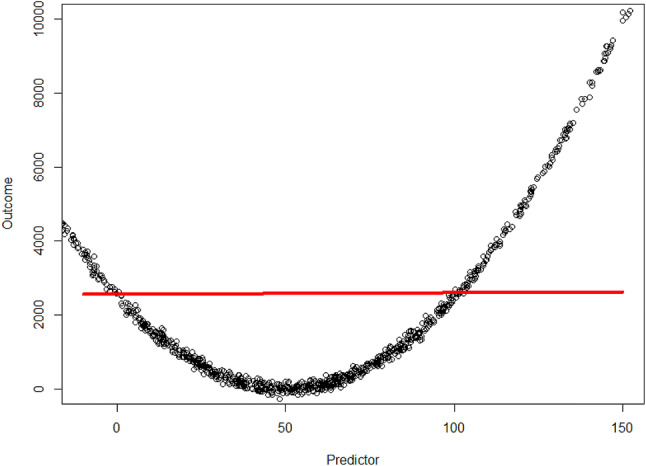
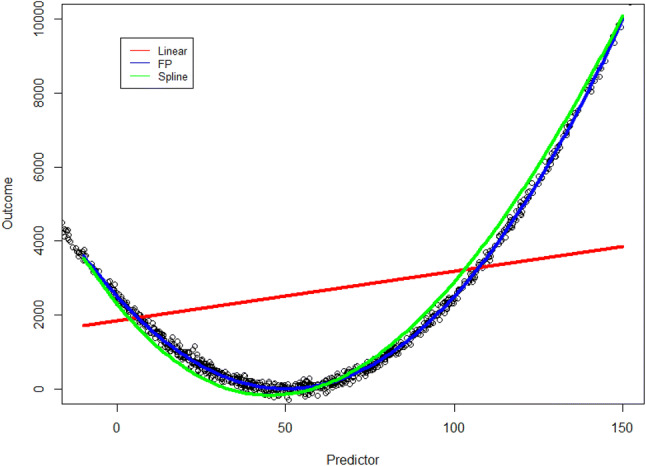
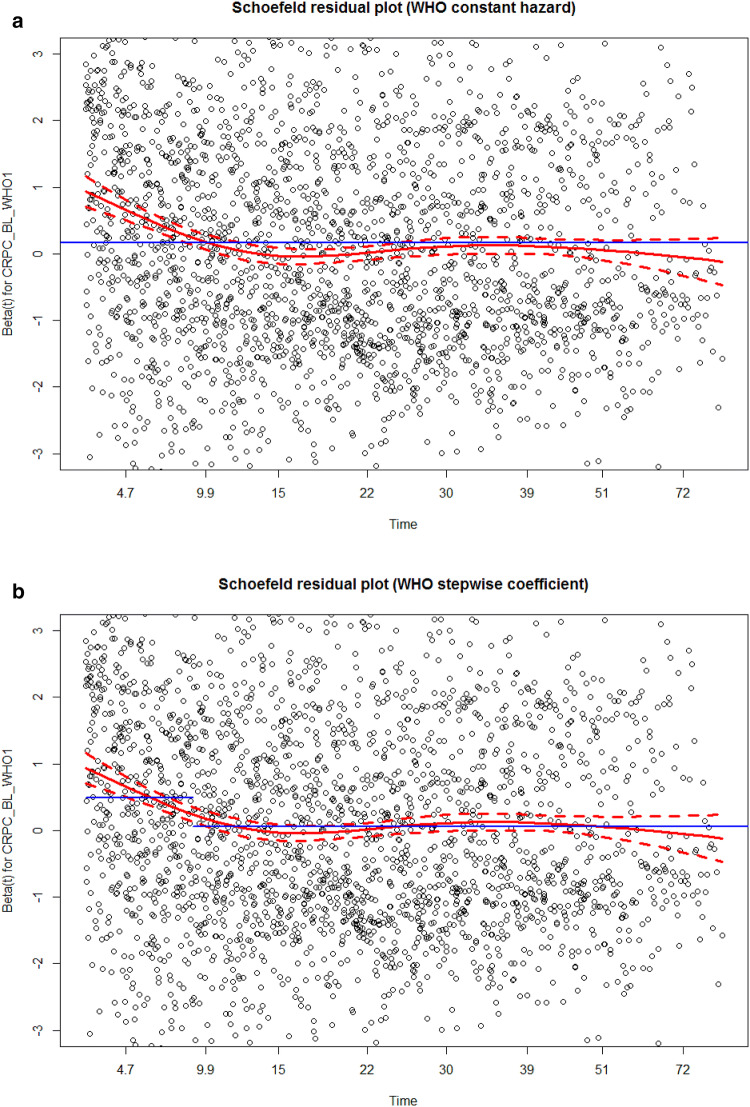
Results: Using the exemplary dataset several essential steps in prediction modelling are discussed including: coding of predictors, missing values, interaction, model specification and performance. An advanced method for appropriate selection of main effects, e.g. Least Absolute Shrinkage and Selection Operator (LASSO) regression, is described. Furthermore, the assumptions of Cox proportional hazard model are discussed, and how to handle violations of the proportional hazard assumption using time-varying coefficients.
Conclusion: This study provides a comprehensive detailed guide to bridge the gap between the statistician and clinician, based on a large dataset of real-world patients treated for castration-resistant prostate cancer.
Keywords: Castration-resistant prostate cancer; Cox proportional hazard model; Decision-making; Prediction modeling.
Conflict of interest statement
The authors declare that they have no conflict of interest related to this paper.
Figures
References
-
- Babyak MA (2004) What you see may not be what you get: a brief, nontechnical introduction to overfitting in regression-type models. Psychosom Med 66(3):411–421 - PubMed
Publication types
MeSH terms
LinkOut - more resources
Full Text Sources
Miscellaneous
