. 2020 Nov;92(11):2623-2630.
doi: 10.1002/jmv.26098. Epub 2020 Jun 19.

SARS-CoV-2 coinfections: Could influenza and the common cold be beneficial?

Affiliations

SARS-CoV-2 coinfections: Could influenza and the common cold be beneficial?

Lubna Pinky et al. J Med Virol. 2020 Nov.

Abstract

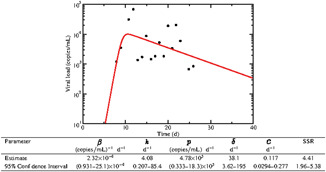
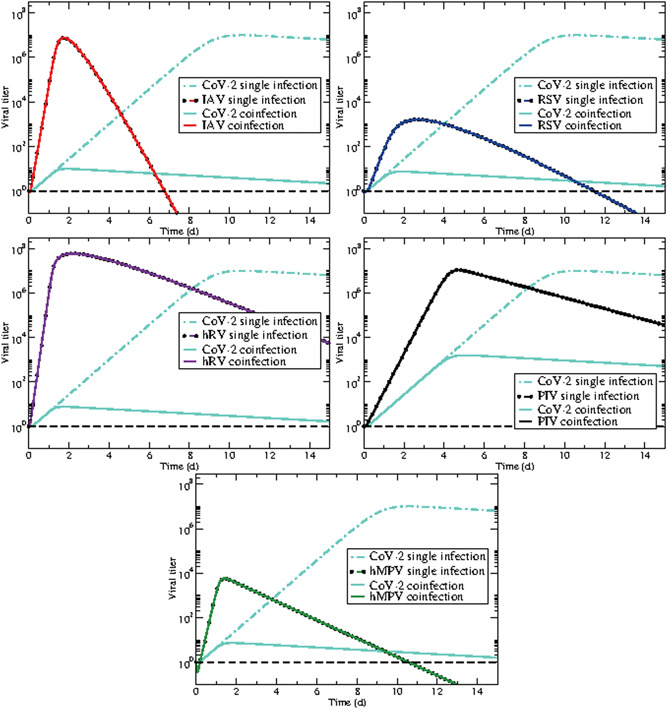
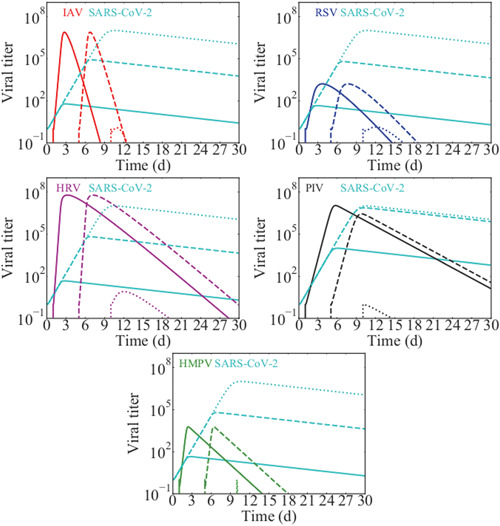
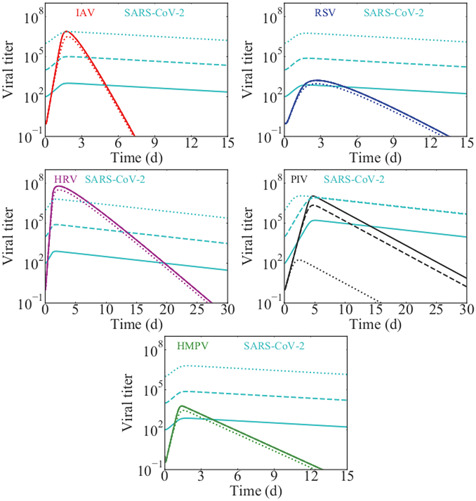
The novel coronavirus severe acute respiratory syndrome coronavirus 2 (SARS-CoV-2) has rapidly spread around the world, causing serious illness and death and creating a heavy burden on the healthcare systems of many countries. Since the virus first emerged in late November 2019, its spread has coincided with peak circulation of several seasonal respiratory viruses, yet some studies have noted limited coinfections between SARS-CoV-2 and other viruses. We use a mathematical model of viral coinfection to study SARS-CoV-2 coinfections, finding that SARS-CoV-2 replication is easily suppressed by many common respiratory viruses. According to our model, this suppression is because SARS-CoV-2 has a lower growth rate (1.8/d) than the other viruses examined in this study. The suppression of SARS-CoV-2 by other pathogens could have implications for the timing and severity of a second wave.

Keywords: SARS coronavirus; computer modeling; human metapneumovirus; human rhinovirus; influenza virus; respiratory syncytial virus.


Figures

Figure 1
Figure 1
Experimental data and single virus model best fits for a patient infected with severe acute respiratory syndrome coronavirus 2 (SARS‐CoV‐2). Best fit parameters are given in the table
Figure 2
Figure 2
SARS‐CoV‐2 coinfections with other respiratory viruses: (top left) influenza, (top right) respiratory syncytial virus (RSV), (center left) rhinovirus, (center right) parainfluenza virus (PIV), (bottom) human metapneumovirus (hMPV). Dash‐dot lines are each of the viruses in a single infection while solid lines predict the dynamics of the coinfection. The dashed black line indicates a typical threshold of detection
Figure 3
Figure 3
Delayed SARS‐CoV‐2 coinfections with other respiratory viruses: (top left) influenza, (top right) RSV, (center left) rhinovirus, (center right) PIV, (bottom) hMPV. Solid lines show the viral time courses when the second virus is introduced 1 day after SARS‐CoV‐2 infection. Dashed lines show the time courses when the second virus is introduced 5 days after SARS‐CoV‐2 infection and dotted lines show the time courses when the second virus is introduced 10 days after SARS‐CoV‐2 infection. hMPV, human metapneumovirus; PIV, parainfluenza virus; RSV, respiratory syncytial virus; SARS‐CoV‐2, severe acute respiratory syndrome coronavirus 2
Figure 4
Figure 4
The effect of an increased SARS‐CoV‐2 initial inoculum during coinfection with other viruses: (top left) influenza, (top right) RSV, (center left) rhinovirus, (center right) PIV, (bottom) hMPV. Solid lines show the viral time courses when SARS‐CoV‐2 has an initial dose 100 times larger than the second virus; dashed lines show the time courses when SARS‐CoV‐2 has an initial inocolum 104 times larger than the second virus; and dotted lines show the time courses when SARS‐CoV‐2 has an initial inoculum 106 times larger than the second virus. hMPV, human metapneumovirus; PIV, parainfluenza virus; RSV, respiratory syncytial virus; SARS‐CoV‐2, severe acute respiratory syndrome coronavirus 2

References

    1. Lippi G, Sanchis‐Gomar F, Henry BM. Coronavirus disease 2019 (COVID‐19): the portrait of a perfect storm. Ann Trans Med. 2020;8(7):497. 10.21037/atm.2020.03.157 - DOI - PMC - PubMed
    1. Govorkova EA, Ilyushina NA, Marathe BM, McClaren JL, Webster RG. Clinical characteristics of covid‐19 in New York City. N Engl J Med. 2020;84:8042‐8050. 10.1128/JVI.00689-10 - DOI
    1. Jiang F, Deng L, Zhang L, Cai Y, Cheung CW, Xia Z. Review of the clinical characteristics of coronavirus disease 2019 (COVID‐19). J Gen Intern Med. 2020;35:1545‐1549. 10.1007/s11606-020-05762-w - DOI - PMC - PubMed
    1. Chinazzi M, Davis JT, Ajelli M, et al. The effect of travel restrictions on the spread of the 2019 novel coronavirus (COVID‐19) outbreak. Science. 2020;368(6489):395‐400. 10.1126/science.aba9757 - DOI - PMC - PubMed
    1. Lai CC, Wang CY, Wang YH, Hsueh SC, Ko WC, Hsueh PR. Global epidemiology of coronavirus disease 2019 (COVID‐19): disease incidence, daily cumulative index, mortality, and their association with country healthcare resources and economic status. Int J Antimicrob Agents. 2020;55(4):105946. 10.1016/j.ijantimicag.2020.105946 - DOI - PMC - PubMed