

Observation of Reduced Homeostatic Metabolic Activity and/or Coupling in White Matter Aging
- PMID: 32558031
- PMCID: PMC7529981
- DOI: 10.1111/jon.12744
Observation of Reduced Homeostatic Metabolic Activity and/or Coupling in White Matter Aging
Abstract
Background and purpose: Transvascular water exchange plays a key role in the functional integrity of the blood-brain barrier (BBB). In white matter (WM), a variety of imaging modalities have demonstrated age-related changes in structure and metabolism, but the extent to which water exchange is altered remains unclear. Here, we investigated the cumulative effects of healthy aging on WM capillary water exchange.
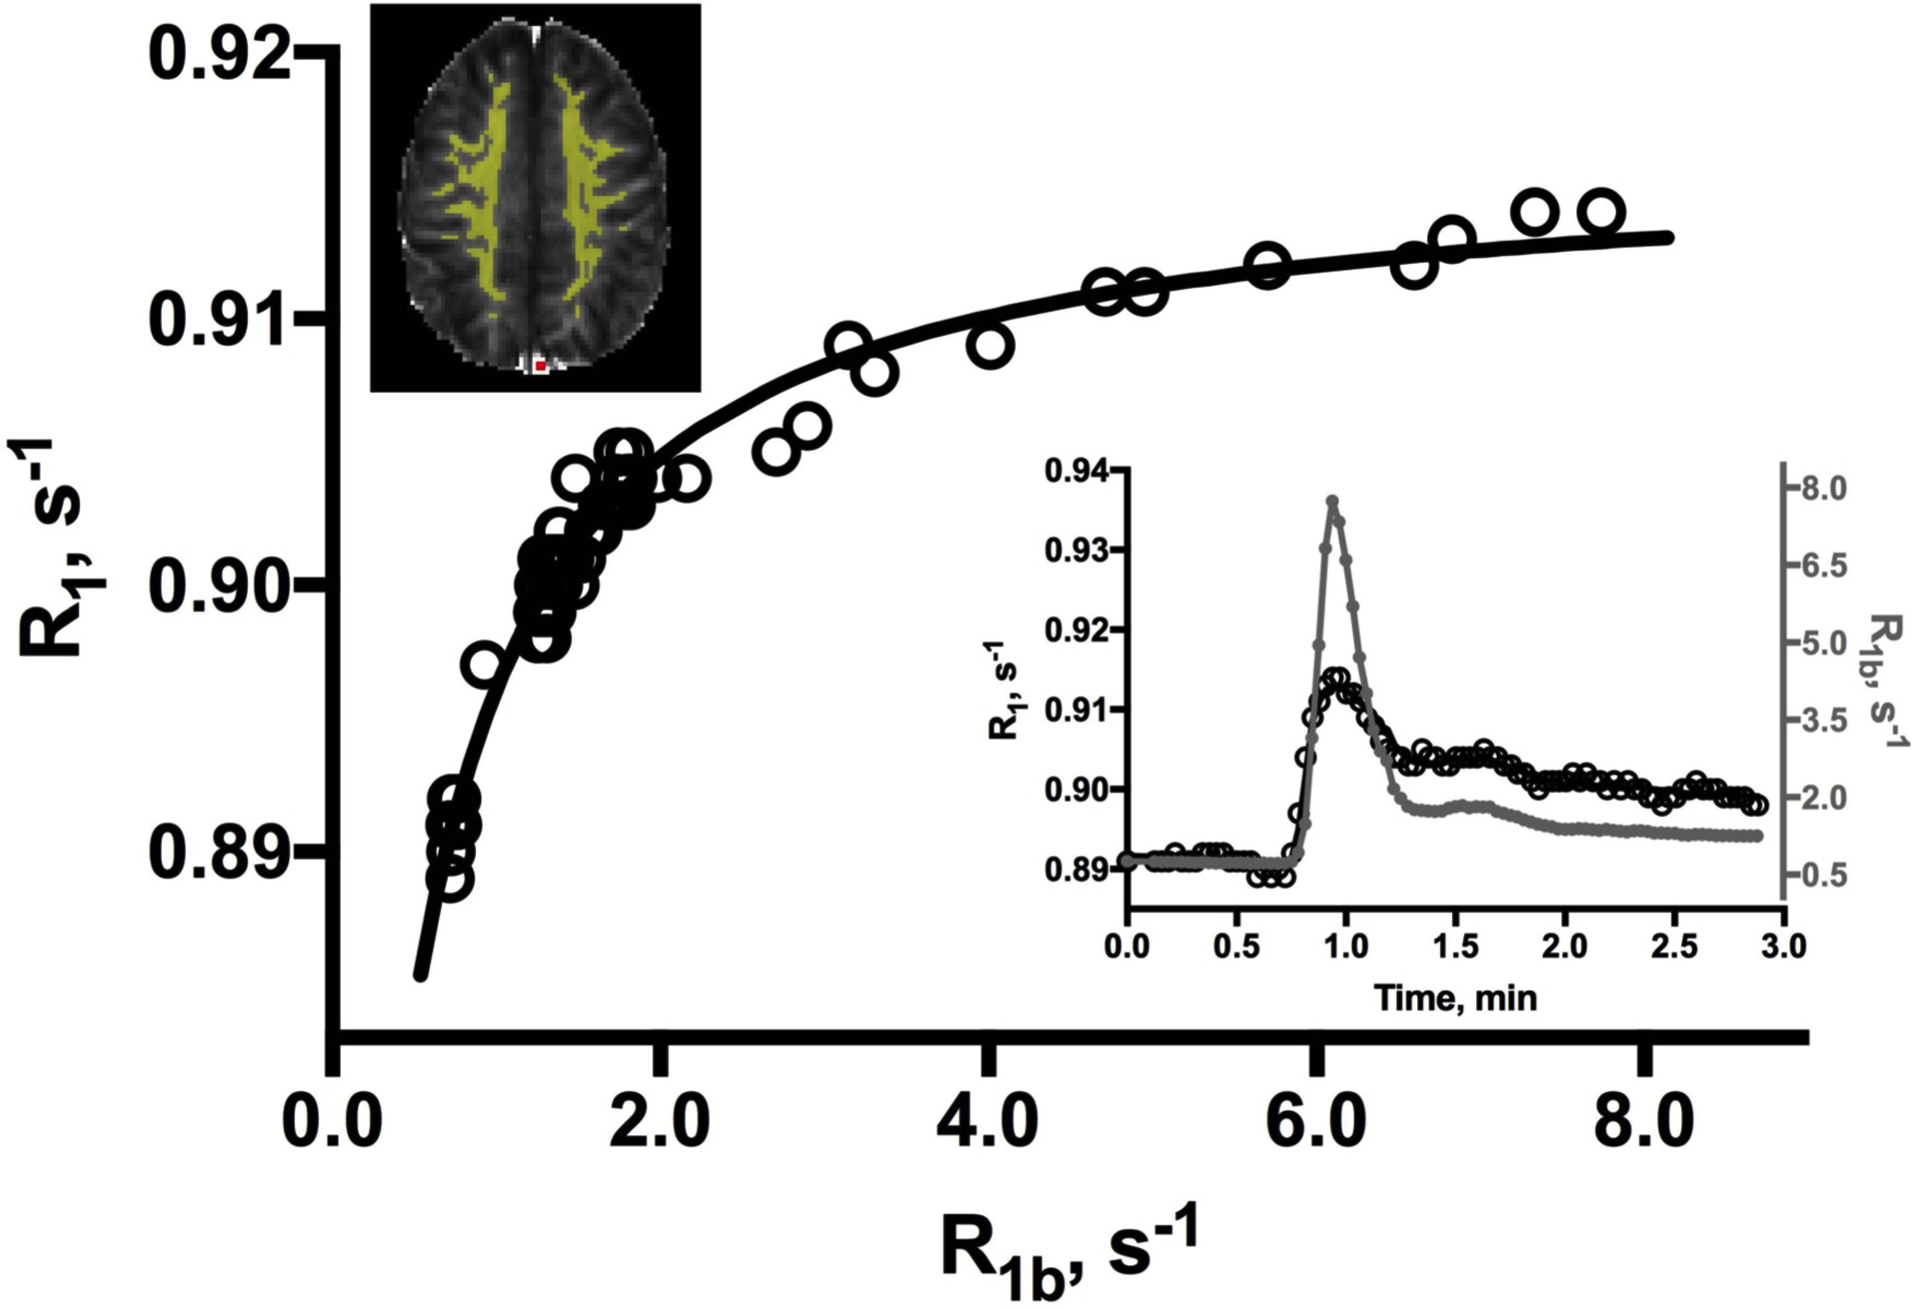
Methods: A total of 38 healthy adults (aged 36-80 years) were studied using 7T dynamic contrast enhanced MRI. Blood volume fraction (vb ) and capillary water efflux rate constant (kpo ) were determined by fitting changes in the 1 H2 O longitudinal relaxation rate constant (R1 ) during contrast agent bolus passage to a two-compartment exchange model. WM volume was determined by morphometric analysis of structural images.
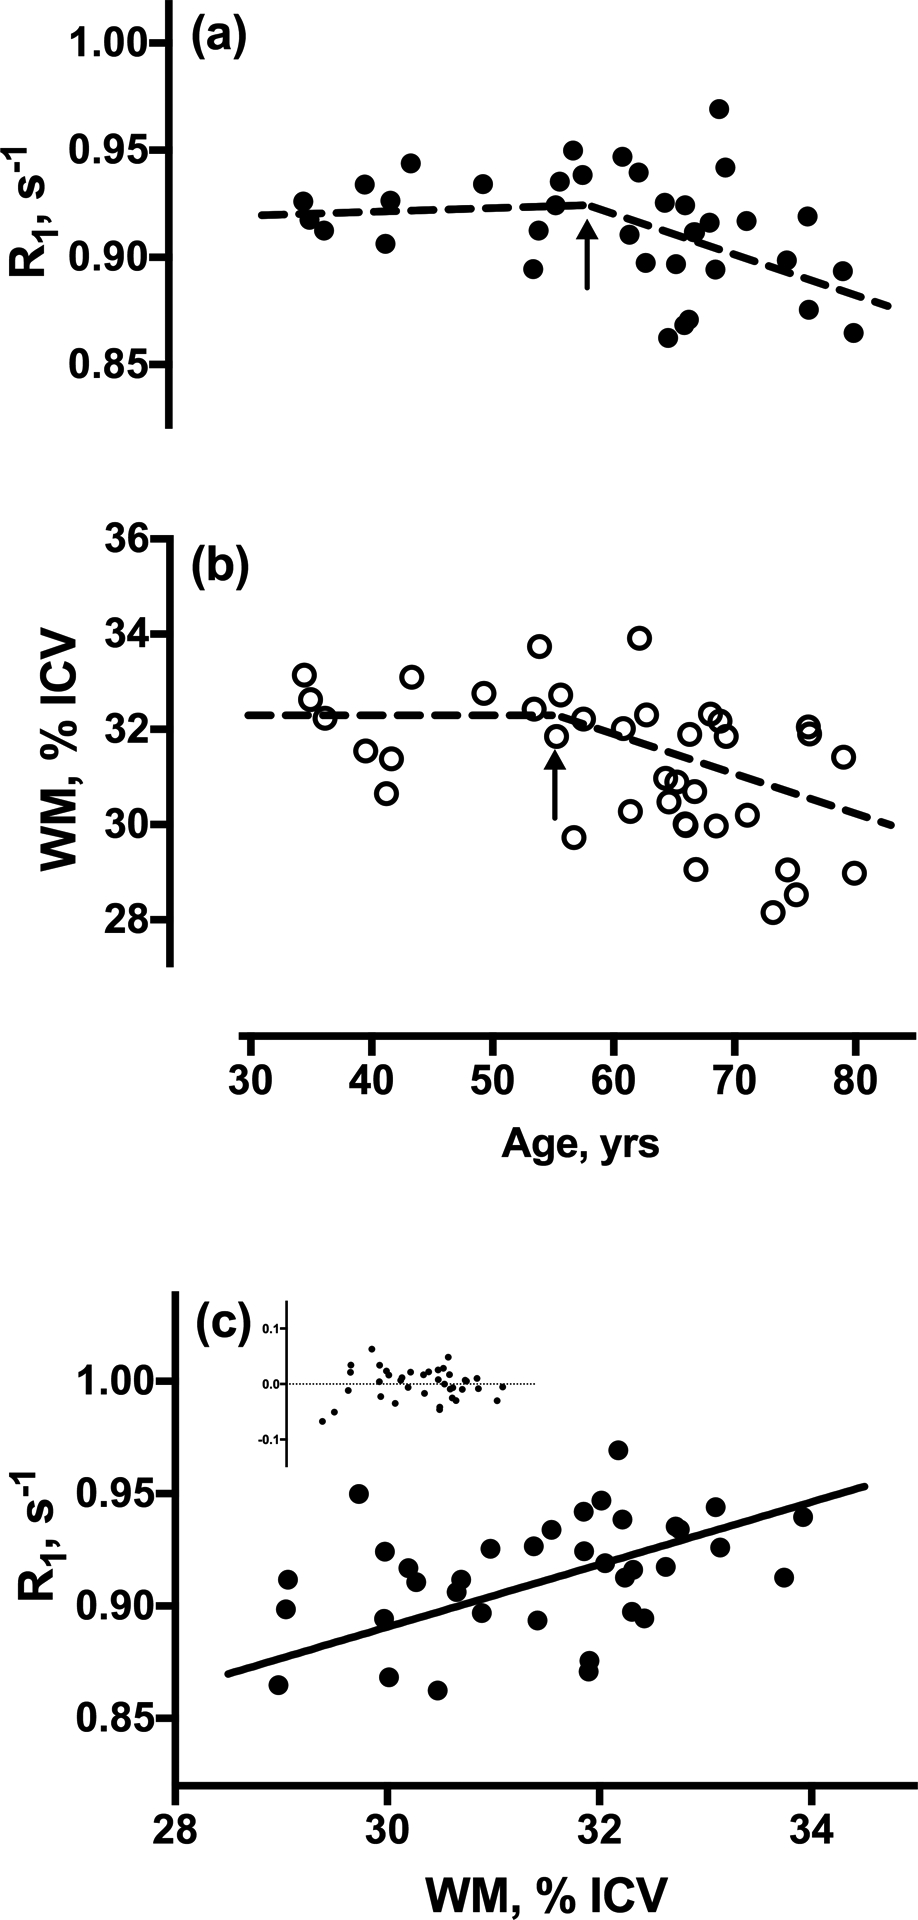
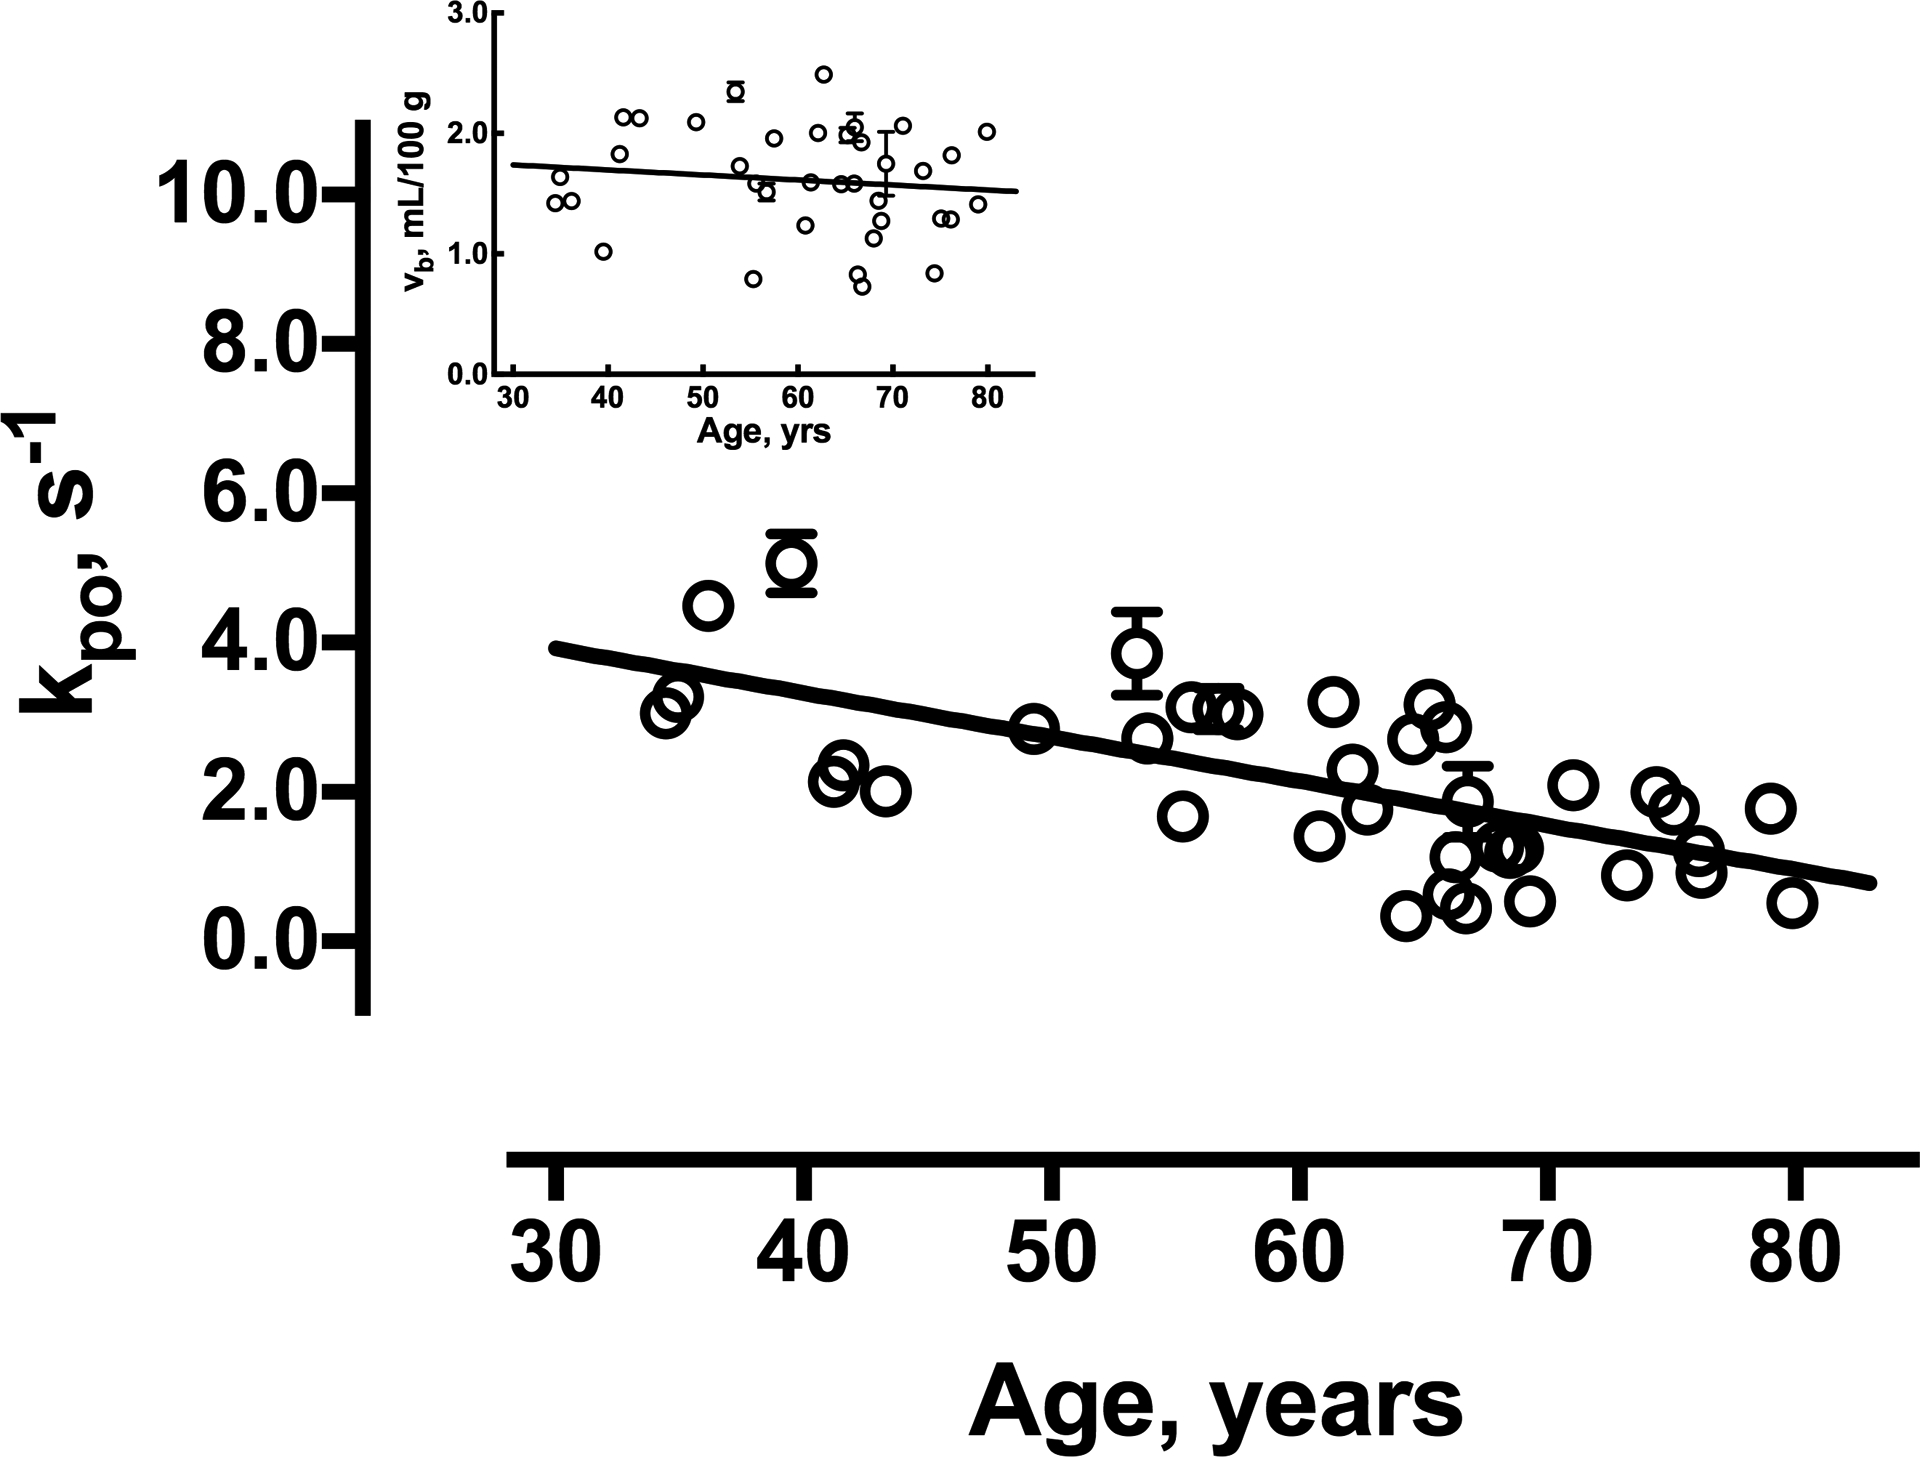
Results: R1 values and WM volume showed similar trajectories of age-related decline. Among all subjects, vb and kpo averaged 1.7 (±0.5) mL/100 g of tissue and 2.1 (±1.1) s-1 , respectively. While vb showed minimal changes over the 40-year-age span of participants, kpo declined 0.06 s-1 (ca. 3%) per year (r = -.66; P < .0005), from near 4 s-1 at age 30 to ca. 2 s-1 at age 70. The association remained significant after controlling for WM volume.
Conclusions: Previous studies have shown that kpo tracks Na+ , K+ -ATPase activity-dependent water exchange at the BBB and likely reflects neurogliovascular unit (NGVU) coupled metabolic activity. The age-related decline in kpo observed here is consistent with compromised NGVU metabolism in older individuals and the dysregulated cellular bioenergetics that accompany normal brain aging.
Keywords: Aging; blood brain barrier, DCE-MRI, water cycling; white matter.
© 2020 American Society of Neuroimaging.
Figures

References
-
- Farkas E, Luiten PG. Cerebral microvascular pathology in aging and Alzheimer’s disease. Prog Neurobiol 2001;64:575–611. - PubMed
-
- Stewart PA, Magliocco M, Hayakawa K, et al. A quantitative analysis of blood-brain barrier ultrastructure in the aging human. Microvasc Res 1987;33:270–82. - PubMed
-
- Tuma RF. The cerebral microcirculation In: Tuma R, Duran W, Ley K, eds. Microcirculation. San Diego, CA: Academic Press, 2008:485–520.
Publication types
MeSH terms
Grants and funding
LinkOut - more resources
Full Text Sources
Medical
