. 2021 Jan;21(1):186-197.
doi: 10.1111/ajt.16150. Epub 2020 Jul 15.

Economic analysis of screening for subclinical rejection in kidney transplantation using protocol biopsies and noninvasive biomarkers

Affiliations

Economic analysis of screening for subclinical rejection in kidney transplantation using protocol biopsies and noninvasive biomarkers

Chethan M Puttarajappa et al. Am J Transplant. 2021 Jan.

Abstract

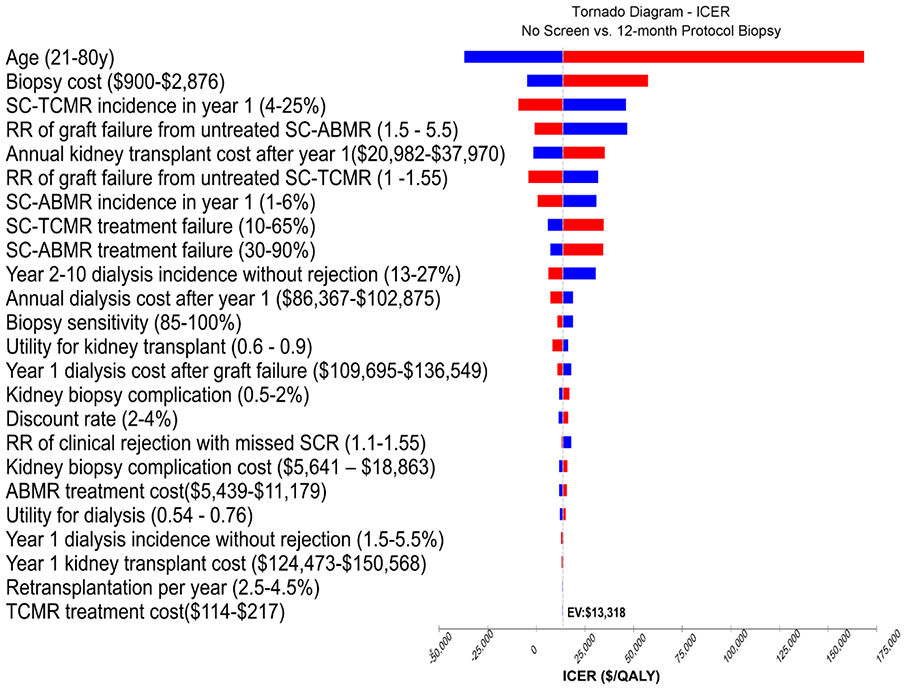
Subclinical rejection (SCR) screening in kidney transplantation (KT) using protocol biopsies and noninvasive biomarkers has not been evaluated from an economic perspective. We assessed cost-effectiveness from the health sector perspective of SCR screening in the first year after KT using a Markov model that compared no screening with screening using protocol biopsy or biomarker at 3 months, 12 months, 3 and 12 months, or 3, 6, and 12 months. We used 12% subclinical cellular rejection and 3% subclinical antibody-mediated rejection (SC-ABMR) for the base-case cohort. Results favored 1-time screening at peak SCR incidence rather than repeated screening. Screening 2 or 3 times was favored only with age <35 years and with high SC-ABMR incidence. Compared to biomarkers, protocol biopsy yielded more quality-adjusted life years (QALYs) at lower cost. A 12-month biopsy cost $13 318/QALY for the base-case cohort. Screening for cellular rejection in the absence of SC-ABMR was less cost effective with 12-month biopsy costing $46 370/QALY. Screening was less cost effective in patients >60 years. Using biomarker twice or thrice was cost effective only if biomarker cost was <$700. In conclusion, in KT, screening for SCR more than once during the first year is not economically reasonable. Screening with protocol biopsy was favored over biomarkers.

Keywords: biomarker; clinical research/practice; economics; health services and outcomes research; kidney transplantation/nephrology; mathematical model; protocol biopsy; rejection: subclinical.


Conflict of interest statement

Disclosure

The authors of this manuscript have no conflicts to disclose as described by the American Journal of Transplantation.

Figures

Figure 1.
Figure 1.
Markov state transition diagram depicting the health states and transitions in the model. All patients start the model in the ‘Well KT’ state which denotes a functioning transplant without rejection. Patients then either remain in the well state or transition to different states of clinical or sub-clinical rejection states as shown in the diagram based on the transition probabilities. Model also included SCR states that went unrecognized due to either not being screened or due to a false negative test. These ‘missed SC-TCMR’ or ‘missed SC-ABMR’ are not shown in the diagram. Model did allow for re-transplantation after graft failure. SC-ABMR: Sub-clinical antibody mediated rejection; SC-TCMR: Sub-clinical T-cell mediated rejection; KT: kidney transplant
Figure 2.
Figure 2.
Costs in US $ and effectiveness (QALYs) for each subclinical rejection screening strategy. Protocol biopsy at 12 months was less costly and yielded more QALYs than protocol biopsy at 3 months. Protocol biopsies and biomarkers both yielded increasing QALYs as the number of screening tests increased; however, incremental gains in QALY were smaller and came at higher costs. Undominated strategies are represented on connecting line whereas those strategies that were dominated are shaded and represented to the left of the line. Biomarkers at all timepoints were dominated by protocol biopsy-based strategies; they yielded lower QALYs and cost more than a protocol biopsy performed at the same timepoint. QALY: Quality adjusted life year
Figure 3.
Figure 3.
Tornado diagram showing one-way sensitivity analysis for subclinical rejection screening with a 12-month protocol biopsy compared to no screening. Incremental cost-effectiveness ratio (ICER) is shown on the X-axis with the vertical dashed line indicating the expected value (EV) of $13,318 per QALY saved for the base case cohort. Horizontal colored bars represent the range of ICERs as variables are varied from low (blue) to high (red) values. Variables are arranged in a descending order of their influence on cost-effectiveness. Results were most sensitive to patient age, biopsy cost, risk of graft failure from untreated subclinical rejection (either SC-ABMR or SC-TCMR), effectiveness of subclinical rejection treatment, and annual transplant cost. All costs are in US dollars. EV: Expected value; RR: Relative risk; QALY: Quality adjusted life year; SC-ABMR: Sub-clinical antibody mediated rejection; SC-TCMR: Sub-clinical T-cell mediated rejection
Figure 4.
Figure 4.
Sensitivity analysis for effect of patient age on the cost-effectiveness. A & B. 1-way sensitivity analysis for effect of age on ICER values. Panel A shows 1-way sensitivity analysis for age and cost-effectiveness of 12-month biopsy over no screening. Screening was most cost-effective in younger patients shown by decreasing ICERs as patient age decreases. At age<45 years, 12-month biopsy had higher QALYs at lower cost compared to no screening, resulting in negative ICERs. Panel B shows changes in ICERs for different protocol biopsy strategies with age. Screening with biopsy more than once during first year was favored only when age was <35 years. C & D. 2-way sensitivity by varying risk of sub-clinical T-cell mediated rejection (C) and risk of death censored graft failure (D) with age. Net benefits were calculated at a willingness to pay threshold of $50,000 /QALY. For each point in the XY plane, strategy that yielded the maximum net benefit by costing less than $50,000 to save one QALY is indicated. As age increased, screening was favored only at higher SC-TCMR incidence and/or with higher death censored graft failure risk. ICER: Incremental cost-effectiveness ratio; QALY: Quality adjusted life year; SC-TCMR: Sub-clinical T-cell mediated rejection
Figure 5.
Figure 5.
Sensitivity analysis for effect of biomarker cost on cost-effectiveness. A. 1-way sensitivity analysis for biomarker cost when only biomarker strategies were compared. ICERs decreased as biomarker cost decreased, with screening more than once with a biomarker favored when cost was <$700. B. 2-way sensitivity analysis of biomarker sensitivity and specificity at willingness-to-pay threshold of $50,000/QALY. Analysis was done by keeping biopsy and biomarker cost equal. Biomarker sensitivity needs to be close to 90% for it to be favored over a biopsy. Specificity had only a mild impact. ICER: Incremental cost-effectiveness ratio; QALY: Quality adjusted life year

Comment in

References

    1. Hoffman W, Mehta R, Jorgensen DR, et al. The Impact of Early Clinical and Subclinical T Cell-mediated Rejection After Kidney Transplantation. Transplantation. 2019;103(7):1457–1467. - PubMed
    1. Nankivell BJ, Borrows RJ, Fung CL, O’Connell PJ, Allen RD, Chapman JR. Natural history, risk factors, and impact of subclinical rejection in kidney transplantation. Transplantation. 2004;78(2):242–249. - PubMed
    1. Gloor JM, DeGoey SR, Pineda AA, et al. Overcoming a positive crossmatch in living-donor kidney transplantation. American journal of transplantation : official journal of the American Society of Transplantation and the American Society of Transplant Surgeons. 2003;3(8):1017–1023. - PubMed
    1. Rush D, Nickerson P, Gough J, et al. Beneficial effects of treatment of early subclinical rejection: a randomized study. Journal of the American Society of Nephrology : JASN. 1998;9(11):2129–2134. - PubMed
    1. Mehta R, Sood P, Hariharan S. Subclinical Rejection in Renal Transplantation: Reappraised. Transplantation. 2016;100(8):1610–1618. - PubMed

Publication types