

Boosting radiotherapy dose calculation accuracy with deep learning
- PMID: 32559018
- PMCID: PMC7484829
- DOI: 10.1002/acm2.12937
Boosting radiotherapy dose calculation accuracy with deep learning
Abstract
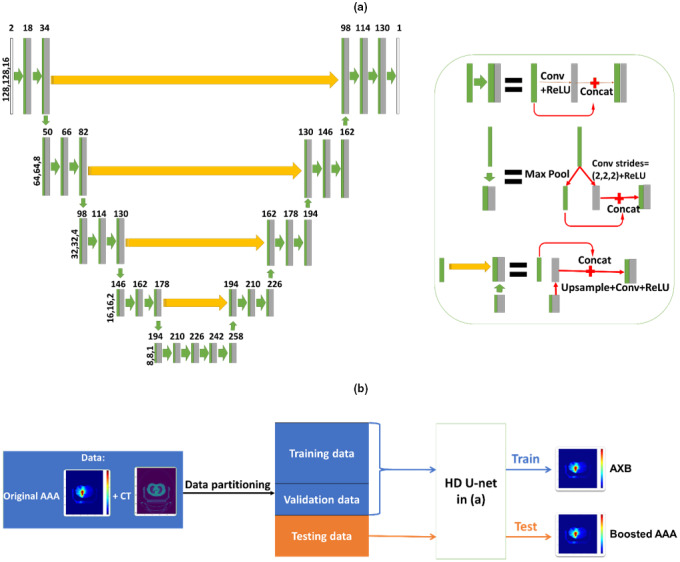
In radiotherapy, a trade-off exists between computational workload/speed and dose calculation accuracy. Calculation methods like pencil-beam convolution can be much faster than Monte-Carlo methods, but less accurate. The dose difference, mostly caused by inhomogeneities and electronic disequilibrium, is highly correlated with the dose distribution and the underlying anatomical tissue density. We hypothesize that a conversion scheme can be established to boost low-accuracy doses to high-accuracy, using intensity information obtained from computed tomography (CT) images. A deep learning-driven framework was developed to test the hypothesis by converting between two commercially available dose calculation methods: Anisotropic analytic algorithm (AAA) and Acuros XB (AXB). A hierarchically dense U-Net model was developed to boost the accuracy of AAA dose toward the AXB level. The network contained multiple layers of varying feature sizes to learn their dose differences, in relationship to CT, both locally and globally. Anisotropic analytic algorithm and AXB doses were calculated in pairs for 120 lung radiotherapy plans covering various treatment techniques, beam energies, tumor locations, and dose levels. For each case, the CT and the AAA dose were used as the input and the AXB dose as the "ground-truth" output, to train and test the model. The mean squared errors (MSEs) and gamma passing rates (2 mm/2% & 1 mm/1%) were calculated between the boosted AAA doses and the "ground-truth" AXB doses. The boosted AAA doses demonstrated substantially improved match to the "ground-truth" AXB doses, with average (± s.d.) gamma passing rate (1 mm/1%) 97.6% (±2.4%) compared to 87.8% (±9.0%) of the original AAA doses. The corresponding average MSE was 0.11(±0.05) vs 0.31(±0.21). Deep learning is able to capture the differences between dose calculation algorithms to boost the low-accuracy algorithms. By combining a less accurate dose calculation algorithm with a trained deep learning model, dose calculation can potentially achieve both high accuracy and efficiency.
Keywords: AAA; AXB; CT; deep learning; dose calculation; inhomogeneous regions.
© 2020 The Authors. Journal of Applied Clinical Medical Physics published by Wiley Periodicals, Inc. on behalf of American Association of Physicists in Medicine.
Conflict of interest statement
No conflict of interest.
Figures
References
-
- Papanikolaou N, Battista JJ, Boyer A, Kappas C. Tissue inhomogeneity corrections for megavoltage photon beams. AAPM Task Group. 2004;65:1–142.
-
- Clarkson J. A note on depth doses in fields of irregular shape. Br J Radiol. 1941;14:265–268.
-
- Cunningham JR. Scatter‐air ratios. Phys Med Biol. 1972;17:42–51. - PubMed
MeSH terms
Grants and funding
LinkOut - more resources
Full Text Sources
Miscellaneous
