Observational Study
. 2020 Jul 23;5(14):e140327.
doi: 10.1172/jci.insight.140327.

COVID-19 infection alters kynurenine and fatty acid metabolism, correlating with IL-6 levels and renal status

Affiliations
Observational Study

COVID-19 infection alters kynurenine and fatty acid metabolism, correlating with IL-6 levels and renal status

Tiffany Thomas et al. JCI Insight. .

Abstract

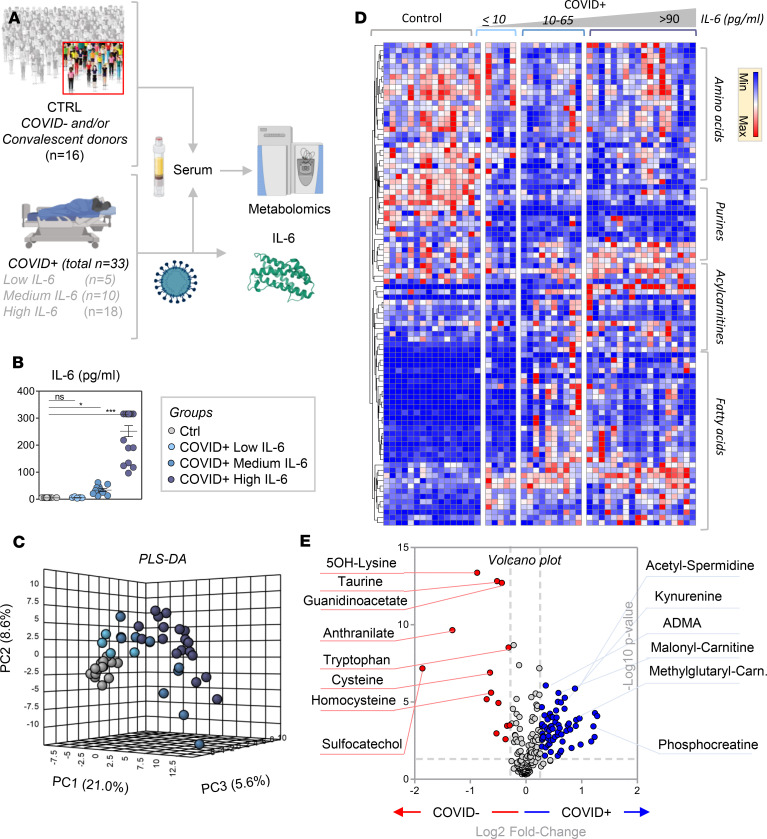
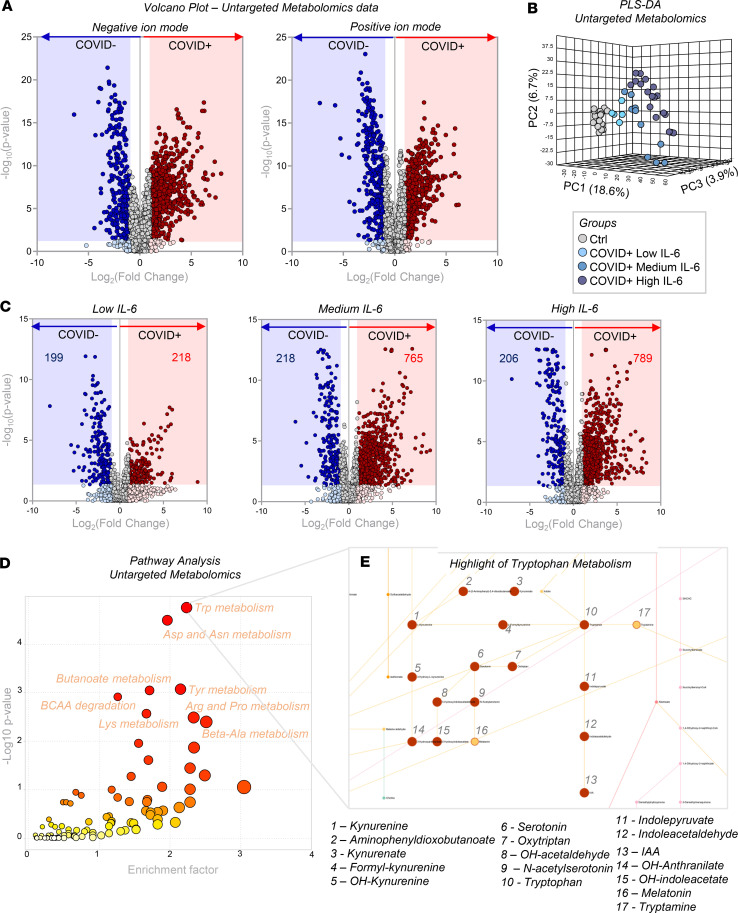
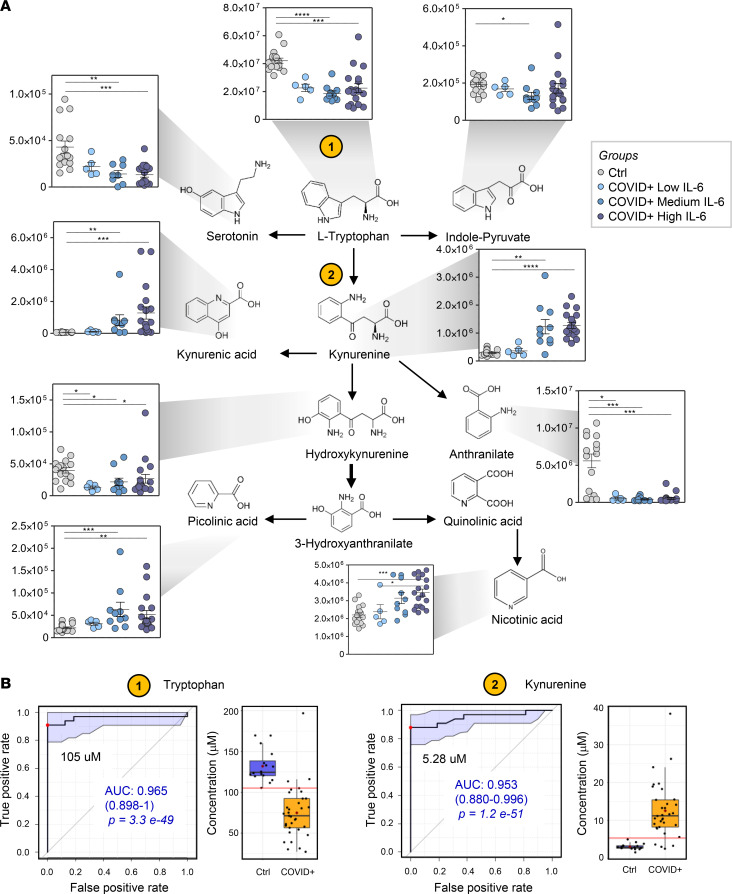
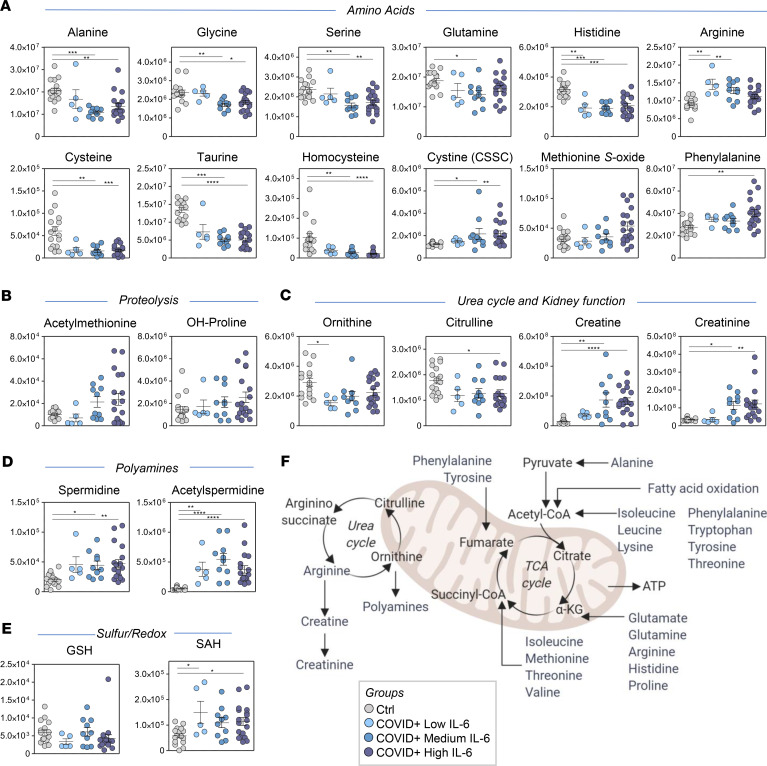
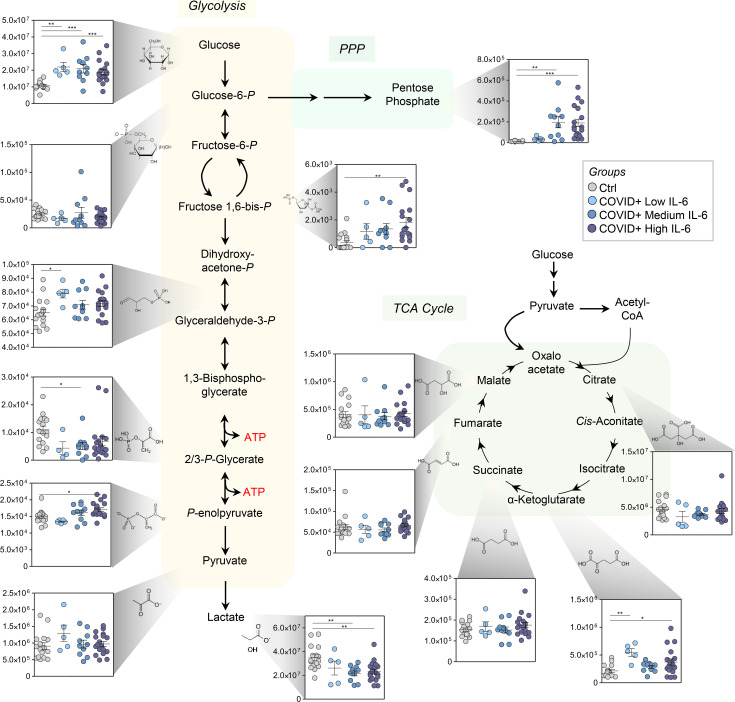
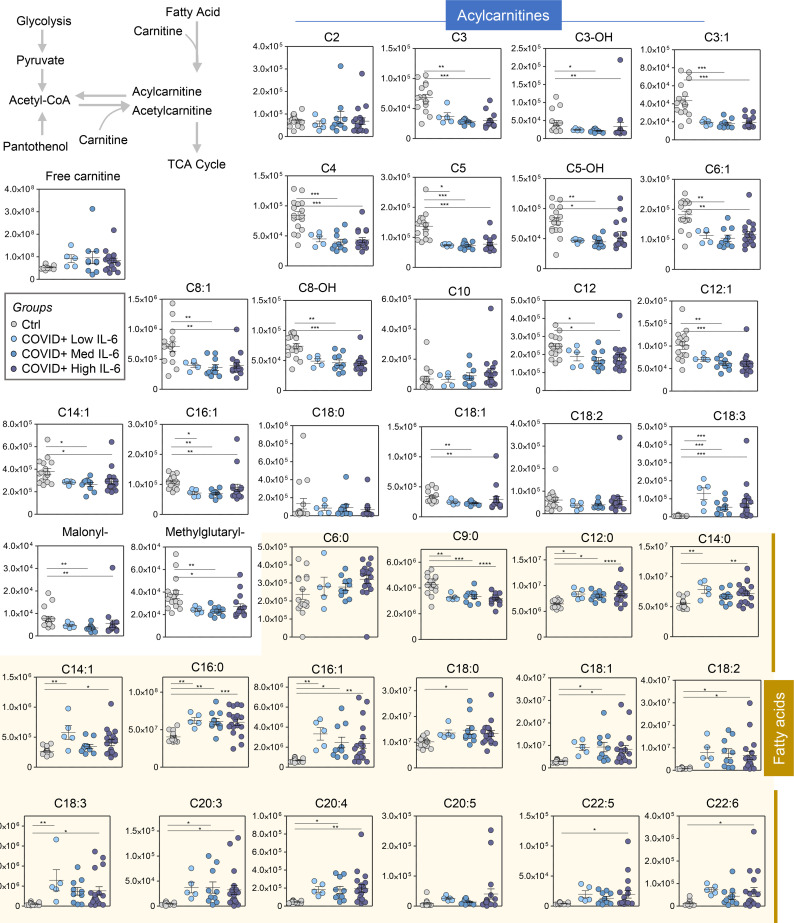
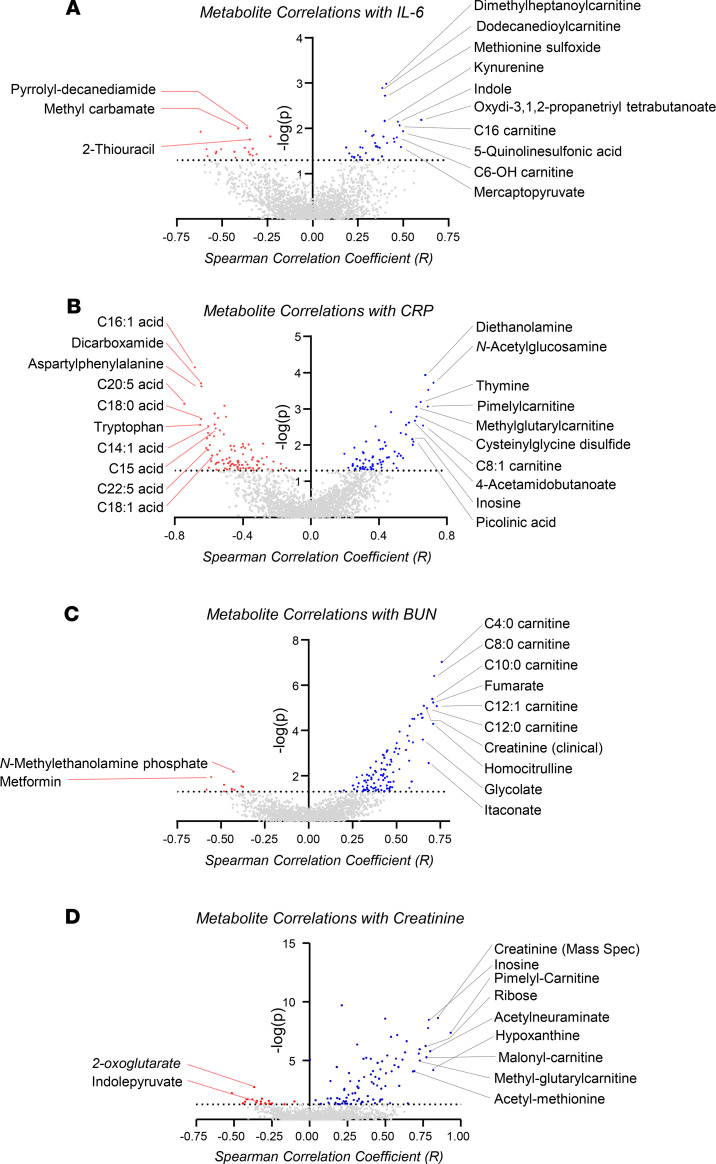
BACKGROUNDReprogramming of host metabolism supports viral pathogenesis by fueling viral proliferation, by providing, for example, free amino acids and fatty acids as building blocks.METHODSTo investigate metabolic effects of SARS-CoV-2 infection, we evaluated serum metabolites of patients with COVID-19 (n = 33; diagnosed by nucleic acid testing), as compared with COVID-19-negative controls (n = 16).RESULTSTargeted and untargeted metabolomics analyses identified altered tryptophan metabolism into the kynurenine pathway, which regulates inflammation and immunity. Indeed, these changes in tryptophan metabolism correlated with interleukin-6 (IL-6) levels. Widespread dysregulation of nitrogen metabolism was also seen in infected patients, with altered levels of most amino acids, along with increased markers of oxidant stress (e.g., methionine sulfoxide, cystine), proteolysis, and renal dysfunction (e.g., creatine, creatinine, polyamines). Increased circulating levels of glucose and free fatty acids were also observed, consistent with altered carbon homeostasis. Interestingly, metabolite levels in these pathways correlated with clinical laboratory markers of inflammation (i.e., IL-6 and C-reactive protein) and renal function (i.e., blood urea nitrogen).CONCLUSIONIn conclusion, this initial observational study identified amino acid and fatty acid metabolism as correlates of COVID-19, providing mechanistic insights, potential markers of clinical severity, and potential therapeutic targets.FUNDINGBoettcher Foundation Webb-Waring Biomedical Research Award; National Institute of General and Medical Sciences, NIH; and National Heart, Lung, and Blood Institute, NIH.

Keywords: Amino acid metabolism; COVID-19; Intermediary metabolism; Metabolism.


Conflict of interest statement

Conflict of interest: ADA, KCH, and TN are founders of Omix Technologies Inc and Altis Biosciences LLC. AD and SLS are consultants for Hemanext Inc. SLS is also a consultant for Tioma Therapeutics Inc. JCZ is a consultant for Rubius Therapeutics.

Figures

Figure 1
Figure 1. Metabolomics analysis of patients with COVID-19.
(A) Forty-nine subjects were studied, of which 16 were COVID-19–negative and 33 were COVID-19–positive patients, as determined by nucleic acid testing of nasopharyngeal swabs. IL-6 levels were determined during routine clinical care using a clinically validated ELISA (B), and the results were used to divide COVID-19–positive patients into groups with low (≤10 pg/mL), medium (10–65 pg/mL) and high (>90 pg/mL) IL-6 levels (although IL-6 levels were treated as a continuous variable, no patients had a result of >65 but ≤90 pg/mL). Sera were obtained from these subjects for metabolomics analyses. Asterisks indicate significance by ANOVA (1-way ANOVA with Tukey’s multiple comparisons, *P < 0.05; **P < 0.01; ***P < 0.001; ****P < 0.0001). (C) The serum metabolic phenotypes of COVID-19–positive patients substantially differed from controls by PLS-DA. (D) Hierarchical clustering analysis highlighted a significant impact of COVID-19 and IL-6 levels on amino acid metabolism, purines, acylcarnitines, and fatty acids. A vectorial version of this figure is provided in Supplemental Figure 2. (E) The volcano plot derived from a targeted metabolomics analysis highlights the top serum metabolites that increased (shown in blue) or decreased (shown in red) in COVID-19–positive patients, as compared with controls.
Figure 2
Figure 2. Untargeted metabolomics analyses.
Untargeted metabolomics analyses were performed using sera obtained from COVID-19–positive and –negative subjects. (A) Volcano plots highlight 3034 and 2484 differential metabolites (unique molecular formulas were determined by high-resolution, accurate intact mass, isotopic patterns, and MS/MS analyses) for negative and positive ion modes (left and right), respectively. (B) PLS-DA based on the untargeted metabolomics data further separates COVID-19–negative and –positive subjects, the latter separating from the former across principal component 1 (18.7% of the total variance) as a function of IL-6 levels. (C) Volcano plots highlight differences between COVID-19–positive subjects with low, medium, and high serum IL-6 levels, as compared with controls. (D) Pathway analysis of untargeted metabolomics data identified significant effects of COVID-19 on amino acids, especially regarding tryptophan, aspartate, arginine, tyrosine, and lysine metabolism. (E) Tryptophan metabolism, one of the top hits from pathway analysis, is mapped against KEGG pathway map hsa01100.
Figure 3
Figure 3. Alterations of tryptophan metabolism in COVID-19–positive subjects.
(A) Tryptophan metabolism was identified in targeted and untargeted metabolomics data as the top pathway affected by COVID-19. Asterisks indicate significance by ANOVA (1-way ANOVA with Tukey’s multiple comparisons, *P < 0.05; **P < 0.01; ***P < 0.001; ****P < 0.0001). The y axis in the dot plots indicates arbitrary units (AU). In particular, decreases in tryptophan and increases in kynurenine were proportional to disease severity, as inferred by IL-6 levels, and predicted COVID-19 infection with good sensitivity and specificity, as shown by the ROC curves (B). The box plots depict the minimum and maximum values (whiskers), the upper and lower quartiles, and the median. The length of the box represents the interquartile range. The red horizontal lines represent the respective metabolite concentration thresholds used in the statistical model to differentiate COVID-19 and control subjects.
Figure 4
Figure 4. Amino acid levels and metabolism in sera of COVID-19–positive patients.
Serum levels of amino acids (A), proteolysis markers (B), urea cycle and renal function metabolites (C), polyamines (D), and sulfur-redox metabolism (E) showed significant differences between COVID-19–positive patients and controls. GSH, reduced glutathione; SAH, S-Adenosylhomocysteine. (F) An overview of the pathways related to these metabolites. Asterisks indicate significance by ANOVA (1-way ANOVA with Tukey’s multiple comparisons, *P < 0.05; **P < 0.01; ***P < 0.001; ****P < 0.0001). The y axis in the dot plots indicates AU.
Figure 5
Figure 5. Circulating levels of glucose and its catabolites in sera of COVID-19–positive patients.
Serum levels of glucose were significantly different when comparing COVID-19–positive patients and controls. Similarly, significant increases were seen in the levels of some intermediates of the glycolytic and pentose phosphate pathways in sera of COVID-19–positive patients. No significant changes were noted in serum levels of carboxylic acids across the groups. Asterisks indicate significance by ANOVA (1-way ANOVA with Tukey’s multiple comparisons, *P < 0.05; **P < 0.01; ***P < 0.001; ****P < 0.0001). The y axis in the dot plots indicates AU. PPP, pentose phosphate pathway.
Figure 6
Figure 6. Circulating levels of free fatty acids and acylcarnitines in sera of COVID-19–positive patients.
Serum levels of free fatty acids and acylcarnitines were significantly different when comparing COVID-19–positive patients and controls. Asterisks indicated significance by ANOVA (1-way ANOVA with Tukey’s multiple comparisons, *P < 0.05; **P < 0.01; ***P < 0.001; ****P < 0.0001). The y axis in the dot plots indicates AU.
Figure 7
Figure 7. Metabolic correlates to IL-6, renal function (BUN), and CRP.
Metabolite levels were correlated (Spearman’s, x axis) to measurements of inflammatory markers IL-6 (A) and CRP (B) or renal function (BUN in C and creatinine in D). In each panel, the x axis indicates Spearman’s correlation coefficients, and the y axis indicates the significance of the correlation (–log10 of P values for each correlate).

Update of

References

    1. Wu F, et al. A new coronavirus associated with human respiratory disease in China. Nature. 2020;579(7798):265–269. doi: 10.1038/s41586-020-2008-3. - DOI - PMC - PubMed
    1. WHO. Coronavirus disease 2019 (COVID-19) situation report – 162. https://www.who.int/docs/default-source/coronaviruse/20200630-covid-19-s... Updated June 30, 2020. Accessed June 30, 2020.
    1. Callaway E. The race for coronavirus vaccines: a graphical guide. Nature. 2020;580(7805):576–577. doi: 10.1038/d41586-020-01221-y. - DOI - PubMed
    1. London AJ, Kimmelman J. Against pandemic research exceptionalism. Science. 2020;368(6490):476–477. doi: 10.1126/science.abc1731. - DOI - PubMed
    1. Woodward A, Gal S. One chart shows how many coronavirus tests per capita have been completed in 6 countries. The US has finally caught up. Business Insider. https://www.businessinsider.com/coronavirus-testing-per-capita-us-italy-... Published April 20, 2020. Accessed June 25, 2020.

Publication types

MeSH terms