. 2020 Aug 19;107(4):617-630.e6.
doi: 10.1016/j.neuron.2020.05.038. Epub 2020 Jun 18.

Direct Readout of Neural Stem Cell Transgenesis with an Integration-Coupled Gene Expression Switch

Affiliations

Direct Readout of Neural Stem Cell Transgenesis with an Integration-Coupled Gene Expression Switch

Takuma Kumamoto et al. Neuron. .

Abstract

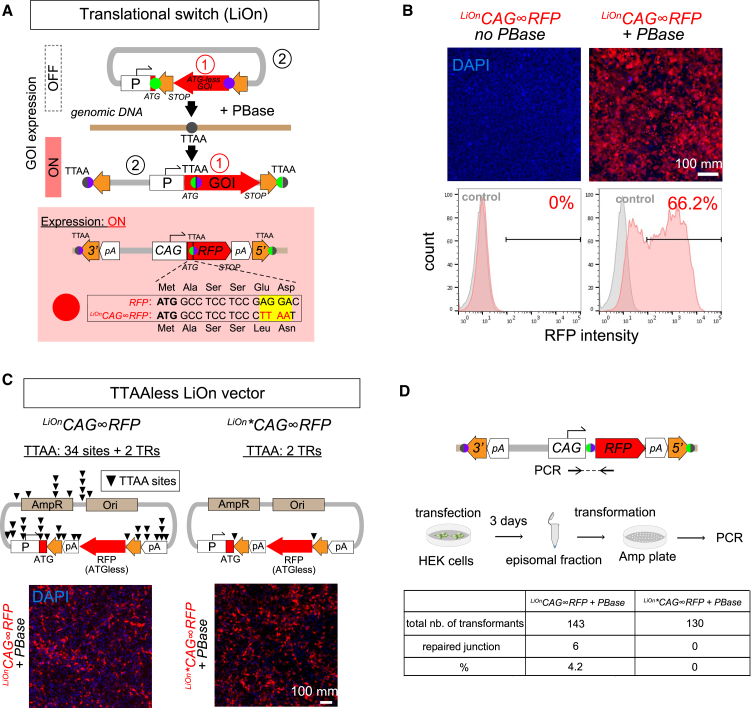
Stable genomic integration of exogenous transgenes is essential in neurodevelopmental and stem cell studies. Despite tools driving increasingly efficient genomic insertion with DNA vectors, transgenesis remains fundamentally hindered by the impossibility of distinguishing integrated from episomal transgenes. Here, we introduce an integration-coupled On genetic switch, iOn, which triggers gene expression upon incorporation into the host genome through transposition, thus enabling rapid and accurate identification of integration events following transfection with naked plasmids. In vitro, iOn permits rapid drug-free stable transgenesis of mouse and human pluripotent stem cells with multiple vectors. In vivo, we demonstrate faithful cell lineage tracing, assessment of regulatory elements, and mosaic analysis of gene function in somatic transgenesis experiments that reveal neural progenitor potentialities and interaction. These results establish iOn as a universally applicable strategy to accelerate and simplify genetic engineering in cultured systems and model organisms by conditioning transgene activation to genomic integration.

Keywords: DNA vectors; genetic engineering; genetic switch; genomic integration; lineage tracing; mosaic analysis; neural stem cells; somatic transgenesis; transposon systems.


Conflict of interest statement

Declaration of Interests J.L., T.K., R.B.-M., F.M., S.T., K.L., and M. Le have filed a patent application related to the technology described in this article (number EP18305623).

Figures

None
Graphical abstract
Figure 1
Figure 1
Principle and Validation of the iOn Switch (A) Principle of gene transfer with a classic transposon (left) and iOn vector (right). While the former allows GOI expression from episomes, that from iOn vector is conditioned by transposase action that reunites the promoter (Prom) and GOI. Orange arrows: 5′ and 3′, transposon TRs; pA, transcription terminators; TTAA, PB transposition footprint. (B) Validation in HEK293 cells 3 days after transfection with a classic transposon (PBCAG::RFP, left) and iOn vector (right). Top: epifluorescence images. Bottom: representative cytometry plots from cells transfected with PB/iOn vectors (red) versus control cells (gray). (C) Time-course analysis of RFP expression with episomal, classic transposon, and iOn vectors. Values and error bars represent the mean and SEM of four replicates. (D) Localization of a membrane-GFP (GFP-Kras) expressed from a classic transposon (left) or iOn vector (right) 3 days after transfection in HEK293 cells. This vector was designed with the translational LiOn switch presented in Figure 2. (E) Clones established by sorting iOnCAG∞RFP-transfected cells display the sequence expected for precise junction between the promoter and GOI. (F) Cells sorted based on iOnCAG∞RFP expression yield a high proportion of RFP-positive clones compared to PBCAG::RFP. Values and error bars represent the mean and SEM of three separate experiments. 1,078, 620, and 504 clones were assessed for PBCAG::RFP transfection without and with PBase and iOnCAG∞RFP, respectively (p < 0.0001 with χ2 test). See also Figures S1 and S2.
Figure 2
Figure 2
Improvement of the iOn Switch (A) Principle of the leak-proof translational iOn (LiOn) switch. In episomes, the GOI is split in 5′ and 3′ portions that are reunited upon transposition with incorporation of the TTAA footprint at a silent position. Orange arrows: 5′ and 3′, transposon TRs; pA, transcription terminators. (B) Validation of the LiOn switch. Top: epifluorescence views of HEK293 cells 3 days after transfection with a LiOnCAG∞RFP vector in presence and absence of PBase. Bottom: representative cytometry plots from cells transfected with the LiOn vector (red) versus control cells (gray). (C) Design and validation of a “TTAA-less” LiOn vector (LiOnCAG∞RFP) devoid of PBase target sequences. Top: maps of the original LiOn vector (left) and LiOnCAG∞RFP plasmid (right) in which all TTAA sequences have been mutated (except in the two TRs). Bottom: control and mutated vectors show similar RFP expression 3 days after transfection in HEK293 cells. (D) Assessment of episomal activation of the LiOnCAG∞RFP and LiOnCAG∞RFP vectors. Episomes purified from HEK cells 3 days after transfection were transformed in competent bacteria. PCR tests on 130 colonies grown from the TTAA-less LiOn vector did not reveal any activated episomes. See also Figure S3.
Figure 3
Figure 3
Highly Efficient Multiplexed Stable Transfection with iOn Vectors (A) 3 days after co-transfection in HEK293 cells of three LiOn plasmids expressing distinct FPs (EGFP, mRFP1, or IRFP670, 100 ng each, respectively coded as green, red, and blue), PBase-dependent expression is observed at similar levels for all markers. (B) Dose dependence of expressed transgenes copy number. Co-transfection of 1 ng, 10 ng, and 100 ng of the three LiOnCAG∞FP plasmids results in increasingly complex colors that reveal activity of 1.1-6.9 transgene copies. Ternary graphs show RGB values from individual labeled cells. See also Figure S4C for transgene copy number estimation. (C) Cell sorting of triple-labeled cells 2 days after transfection with the LiOn vectors yields a majority of clones co-expressing the three FPs, but only a minority with classic transposons (mean and SEM of three separate experiments; 158, 104, and 87 clones were assessed for each condition). χ2 test indicated significant differences among the three situations (p < 0.0001). (D) Example of a human iPSC colony derived from cells co-transfected with the three-color LiOnCAG∞FP vectors, grown 45 days. All cells co-express the three FPs. (E) Co-transfection of the three-color LiOnCAG∞FP vectors during human iPSC neuronal differentiation yields varied FP combinations reflecting their clonal organization. Inset: LiOnCAG∞RFP expression in iPSCs immunostained with the neuronal marker Tuj1 (green). See also Figure S4.
Figure 4
Figure 4
Cell Lineage Tracing and Conditional Expression by Additive Somatic Transgenesis with iOn (A) Fate mapping in the mouse cerebral cortex. Left: co-electroporation of an iOnCAG∞RFP vector with PBase during neurogenesis (E12.5) yields streams of neurons migrating radially from the ventricular surface at E18.5, while an episome (CAG::GFP) only marks those born shortly after electroporation. No red labeling is observed in absence of PBase (inset). CP, cortical plate. Right: quantification of labeled cells confirms that iOn-labeled cells (RFP, RFP/GFP) occupy all cortical layers, while most cells bearing episomal labeling settle in intermediate layers. Values and error bars represent mean and SEM from 4 tissue sections. (B) Longitudinal confocal views through E6 chick spinal cords electroporated at E2 with a classic transposon (top) or iOn vector (bottom) together with a control episome (CAG::GFP). The iOn vector homogenously labels radially migrating cells, while the classic transposon also strongly labels isolated neurons (white arrowheads), similar to the nonintegrating vector. (C) LiOnCAG∞GFP electroporation with PBase in the embryonic mouse retina during neurogenesis (E14.5) labels all retinal layers at post-natal day 6 (P6), while expression from an episome (CAG::dsRed2) only marks ganglion cells, born shortly after electroporation (ONL, outer nuclear layer; INL, inner nuclear layer; GCL, ganglion cell layer). (D) Multicolor clonal tracking. Radial view of a portion of neural retina (top) and en face views of the bipolar cell layer (BC; bottom) and retinal pigmented epithelium (RPE; right) from an E8 chicken embryo electroporated with triple-color LiOn vectors at E1.5. FP combinations identify clones. See also Figure S5.
Figure 5
Figure 5
Functional Mosaic Analysis by Somatic Transgenesis (A) Top: longitudinal confocal views through E5 chick spinal cords 3 days after electroporation of a LiOn vector expressing the Notch intracellular domain (LiOnCAG∞RFP-2A-NICD) compared to transient NICD overexpression (CAG::NICD-IRES-GFP) or control (LiOnCAG∞GFP). VZ, ventricular zone. Bottom: representative transverse section of E5 chick spinal cords electroporated with control (LiOnCAG∞GFP, green) and NICD-expressing LiOn vectors (LiOnCAG∞RFP-2A-NICD, red), immunostained for neuronal marker HuC/D (blue). Graph shows the percentage of HuC/D neurons among transfected cells with sustained versus transient NICD expression (CAG::NICD) and control cells (LiOnCAG∞RFP). Values and error bars show mean and SEM from distinct embryos. A Kruskal-Wallis test indicated significant difference between control and LiOnCAG∞NICD (p < 0.01). (B) Longitudinal view through an E6 spinal cord co-electroporated with control (LiOnCAG∞GFP, green) and NICD-expressing LiOn vectors (LiOnCAG∞RFP-2A-NICD, red). Green cells migrate radially, while most red cells remain at the ventricular surface (dotted line). (C) Non-cell-autonomous effects of NICD expression. Left: E6 chick spinal cord transverse sections co-electroporated at E2 with a GFP-expressing control LiOn vector and a LiOnCAG∞RFP (left) or LiOnCAG∞RFP-2A-NICD plasmid (right). Middle: quantification of the ratio between GFP+/RFP and RFP+ neurons and ventricular zone cells. Values and error bars represent mean and SEM from distinct embryos (n ≥ 5). A Mann-Whitney test indicates significant difference between control and LiOnCAG∞NICD (p < 0.005). Right: summary. Increased neurogenic output from green cells in NICD-perturbed condition reveals a homeostatic interaction among progenitors. See also Figure S6.
Figure 6
Figure 6
Intersectional Cre/lox Recombination and Analysis of the Output of Genetically Identified Neural Progenitors with iOn (A) Cre/lox conditional expression. Left: LiOn vector in which full translation of Cre, initially blocked, is activated by PBase; inset: Cre-FLAG immunodetection after transfection of LiOnCMV∞Cre and PBase in HEK-RY cells stably expressing a CAG::RY reporter switching from RFP to YFP expression under Cre action. Right: strict PBase-dependent recombination is observed 3 days after LiOnCMV∞Cre transfection in HEK-RY cells (CAG::mTurquoise2: transfection control). Graph shows mean and SEM of replicates from three distinct experiments. (B) Radial view through an E8 chick retina co-electroporated at E1.5 with a Cre-expressing LiOn vector driven by Atoh7 regulatory sequences (LiOnAtoh7∞Cre) and a Tol2CAG::RY transposon. Restricted recombination in the retinal ganglion (RGL) and outer nuclear (ONL) layers is observed. INL, inner nuclear layer. (C) Multicolor clonal analysis of Atoh7+ progenitor output. Optical sections and radial views of an E8 chick retina electroporated at E1.5 with LiOnAtoh7∞Cre along with genome-integrating multicolor reporters (Tol2CAG::Nucbow and Tol2CAG::Cytbow). Left: 3D view of a retinal column containing labeled neurons. Middle: Four retinal columns in which clonal pairs or sister cells of a same type can be identified based on expression of identical color marker combinations (arrowheads). Some cells not included in same-type pairs are also observed (asterisks). Column 1 corresponds to that shown in the left panel. Right: quantification of the number of cells belonging to 1-, 2-, 3- or 4-cell clones within labeled photoreceptor (PR), horizontal cell (HC), amacrine cell (AC), and ganglion cells (RGC) in individual columns, consistent with a bias of Atoh7+ retinal progenitors to generate PRs, HCs, and ACs through terminal symmetric division patterns. Graph shows mean and SEM of 14 columns reconstructed from two distinct embryos. See also Figure S7.
Figure 7
Figure 7
Summary of iOn Potential Applications iOn vectors enable fast and reliable analysis of genome integrative events shortly after transfection both in vitro (top) and in vivo (bottom).

References

    1. Akhtar W., de Jong J., Pindyurin A.V., Pagie L., Meuleman W., de Ridder J., Berns A., Wessels L.F.A., van Lohuizen M., van Steensel B. Chromatin position effects assayed by thousands of reporters integrated in parallel. Cell. 2013;154:914–927. - PubMed
    1. Averaimo S., Assali A., Ros O., Couvet S., Zagar Y., Genescu I., Rebsam A., Nicol X. A plasma membrane microdomain compartmentalizes ephrin-generated cAMP signals to prune developing retinal axon arbors. Nat. Commun. 2016;7:12896. - PMC - PubMed
    1. Batard P., Jordan M., Wurm F. Transfer of high copy number plasmid into mammalian cells by calcium phosphate transfection. Gene. 2001;270:61–68. - PubMed
    1. Beard C., Hochedlinger K., Plath K., Wutz A., Jaenisch R. Efficient method to generate single-copy transgenic mice by site-specific integration in embryonic stem cells. Genesis. 2006;44:23–28. - PubMed
    1. Black J.B., Perez-Pinera P., Gersbach C.A. Mammalian synthetic biology: engineering biological systems. Annu. Rev. Biomed. Eng. 2017;19:249–277. - PubMed

Publication types