

Effectiveness of isolation, testing, contact tracing, and physical distancing on reducing transmission of SARS-CoV-2 in different settings: a mathematical modelling study
- PMID: 32559451
- PMCID: PMC7511527
- DOI: 10.1016/S1473-3099(20)30457-6
Effectiveness of isolation, testing, contact tracing, and physical distancing on reducing transmission of SARS-CoV-2 in different settings: a mathematical modelling study
Abstract
Background: The isolation of symptomatic cases and tracing of contacts has been used as an early COVID-19 containment measure in many countries, with additional physical distancing measures also introduced as outbreaks have grown. To maintain control of infection while also reducing disruption to populations, there is a need to understand what combination of measures-including novel digital tracing approaches and less intensive physical distancing-might be required to reduce transmission. We aimed to estimate the reduction in transmission under different control measures across settings and how many contacts would be quarantined per day in different strategies for a given level of symptomatic case incidence.
Methods: For this mathematical modelling study, we used a model of individual-level transmission stratified by setting (household, work, school, or other) based on BBC Pandemic data from 40 162 UK participants. We simulated the effect of a range of different testing, isolation, tracing, and physical distancing scenarios. Under optimistic but plausible assumptions, we estimated reduction in the effective reproduction number and the number of contacts that would be newly quarantined each day under different strategies.
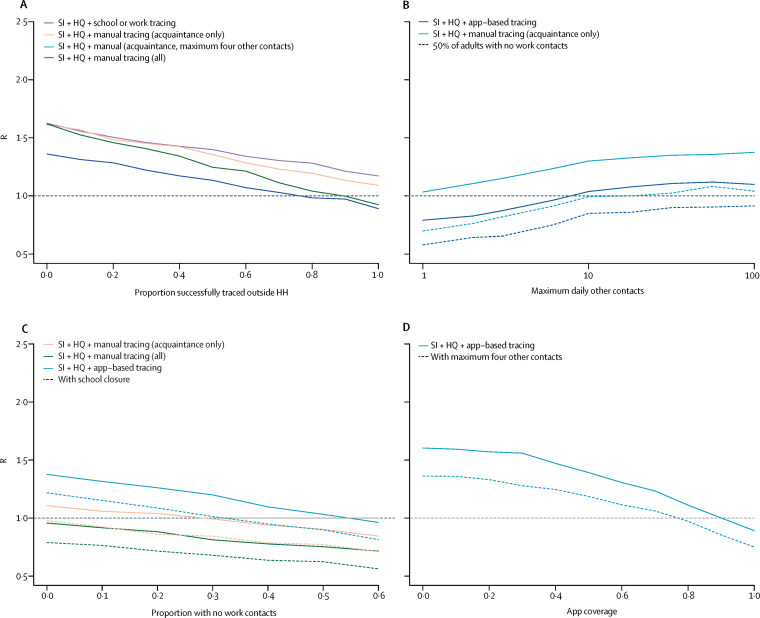
Results: We estimated that combined isolation and tracing strategies would reduce transmission more than mass testing or self-isolation alone: mean transmission reduction of 2% for mass random testing of 5% of the population each week, 29% for self-isolation alone of symptomatic cases within the household, 35% for self-isolation alone outside the household, 37% for self-isolation plus household quarantine, 64% for self-isolation and household quarantine with the addition of manual contact tracing of all contacts, 57% with the addition of manual tracing of acquaintances only, and 47% with the addition of app-based tracing only. If limits were placed on gatherings outside of home, school, or work, then manual contact tracing of acquaintances alone could have an effect on transmission reduction similar to that of detailed contact tracing. In a scenario where 1000 new symptomatic cases that met the definition to trigger contact tracing occurred per day, we estimated that, in most contact tracing strategies, 15 000-41 000 contacts would be newly quarantined each day.
Interpretation: Consistent with previous modelling studies and country-specific COVID-19 responses to date, our analysis estimated that a high proportion of cases would need to self-isolate and a high proportion of their contacts to be successfully traced to ensure an effective reproduction number lower than 1 in the absence of other measures. If combined with moderate physical distancing measures, self-isolation and contact tracing would be more likely to achieve control of severe acute respiratory syndrome coronavirus 2 transmission.
Funding: Wellcome Trust, UK Engineering and Physical Sciences Research Council, European Commission, Royal Society, Medical Research Council.
Copyright © 2020 The Author(s). Published by Elsevier Ltd. This is an Open Access article under the CC BY 4.0 license. Published by Elsevier Ltd.. All rights reserved.
Figures

Comment in
-
Case isolation, contact tracing, and physical distancing are pillars of COVID-19 pandemic control, not optional choices.Lancet Infect Dis. 2020 Oct;20(10):1105-1106. doi: 10.1016/S1473-3099(20)30512-0. Epub 2020 Jun 16. Lancet Infect Dis. 2020. PMID: 32559453 Free PMC article. No abstract available.
References
-
- Cereda D, Tirani M, Rovida F. The early phase of the COVID-19 outbreak in Lombardy, Italy. ArXiv. 2020 DOI: 2003.09320 published online March 20. (preprint).
-
- Abbott S, Hellewell J, Thompson RN. Estimating the time-varying reproduction number of SARS-CoV-2 using national and subnational case counts. Wellcome Open Research. 2020. https://wellcomeopenresearch.org/articles/5-112
Publication types
MeSH terms
Grants and funding
LinkOut - more resources
Full Text Sources
Other Literature Sources
Miscellaneous
