. 2020 Jul 14;15(1):214-225.
doi: 10.1016/j.stemcr.2020.05.018. Epub 2020 Jun 18.

Human Stem Cell Resources Are an Inroad to Neandertal DNA Functions

Affiliations

Human Stem Cell Resources Are an Inroad to Neandertal DNA Functions

Michael Dannemann et al. Stem Cell Reports. .

Abstract

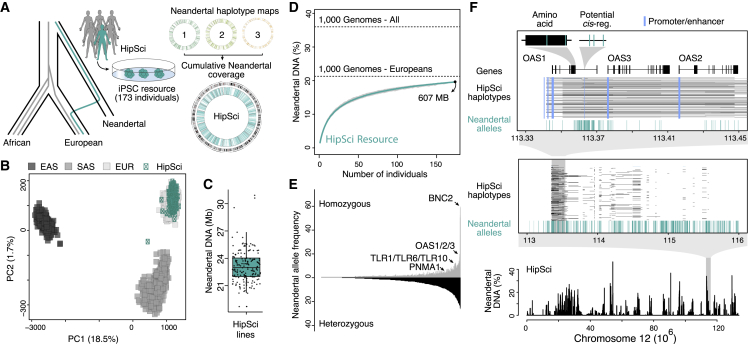
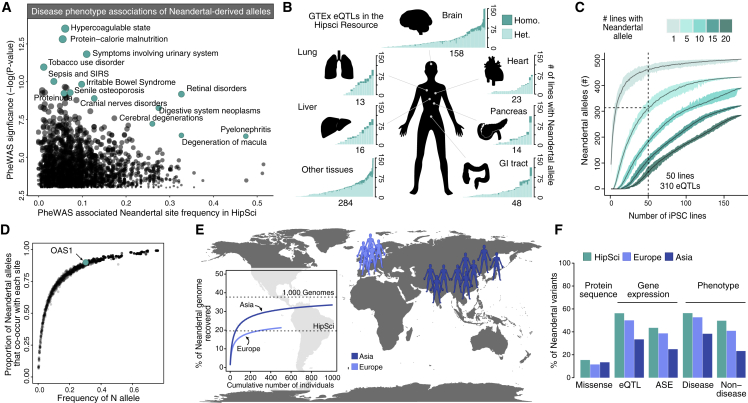
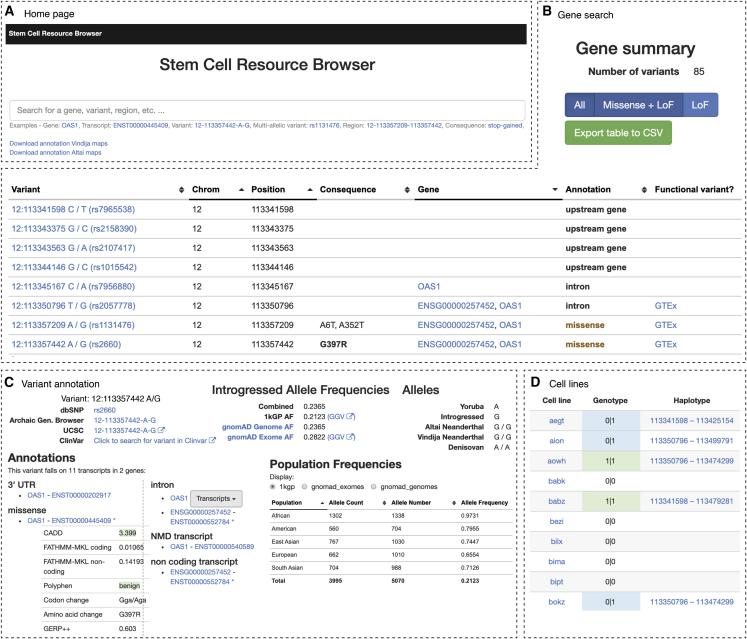
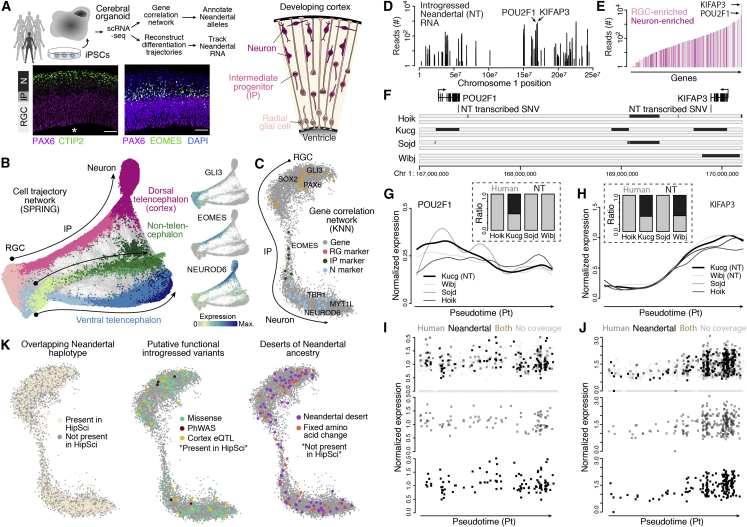
Induced pluripotent stem cells (iPSCs) from diverse humans offer the potential to study human functional variation in controlled culture environments. A portion of this variation originates from an ancient admixture between modern humans and Neandertals, which introduced alleles that left a phenotypic legacy on individual humans today. Here, we show that a large iPSC repository harbors extensive Neandertal DNA, including alleles that contribute to human phenotypes and diseases, encode hundreds of amino acid changes, and alter gene expression in specific tissues. We provide a database of the inferred introgressed Neandertal alleles for each individual iPSC line, together with the annotation of the predicted functional variants. We also show that transcriptomic data from organoids generated from iPSCs can be used to track Neandertal-derived RNA over developmental processes. Human iPSC resources provide an opportunity to experimentally explore Neandertal DNA function and its contribution to present-day phenotypes, and potentially study Neandertal traits.

Keywords: Neandertal genomics; archaic introgression; cerebral organoids; induced pluripotent stem cells; single-cell transcriptomics.


Figures

Figure 1
Figure 1
Identification of Neandertal Haplotypes in Human iPSC Lines (A) The Human Pluripotent Stem Cell Initiative (HipSci) created and characterized induced pluripotent stem cells lines from 173 individuals with genome-wide genotype data, which we analyzed for Neandertal ancestry (Kilpinen et al., 2017). Circos plots show Neandertal haplotype coverage across each chromosome for three individuals (top) and the entire resource (bottom) (Kilpinen et al., 2017). (B) Principal-component analysis on SNPs that distinguish East Asian (EAS) (dark gray), Southeast Asian (SAS) (gray), and European (light gray) individuals suggests that each HipSci individual (teal) has a major European component to their ancestry. (C) Boxplot shows Neandertal DNA in megabases (Mb) per individual detected in 173 HipSci individuals. (D) The cumulative percentage of the human genome covered by Neandertal haplotypes in the HipSci resource. The percentage is also shown for European and all non-African individuals from the 1000 Genome Project. (E) Frequency distribution plot showing the HipSci resource partitioned by the contribution of variants found in heterozygous (lower, black) and homozygous state (upper, gray). Highlighted are four selected SNPs (chr9:16720122, BNC2; chr4:38760338, TLR1/TLR6/TLR10; chr12:113366899, OAS1/OAS2/OAS3; chr11:3867350, PNMA1, Table 2) tagging high-frequency Neandertal haplotypes close to genes with phenotype associations. (F) Neandertal DNA percentage, alleles, and haplotypes present in the HipSci resource covering the OAS locus. In this example, the gene OAS1 contains Neandertal alleles in non-protein coding, potential regulatory regions (blue bars), and those that change the amino acid sequence, present at a frequency of approximately 33% in HipSci individuals. Gene, promoter, and enhancer annotations are from ENSEMBL (GRCh37, Experimental Procedures).
Figure 2
Figure 2
The HipSci Resource Harbors Extensive Functionally Relevant Neandertal DNA (A) The frequency of single nucleotide changes introgressed from Neandertals that have significant associations with human disease phenotypes (Simonti et al., 2016), with select associations highlighted in teal. (B) Barplots illustrating the number of iPSC lines that contain each Neandertal-associated eQTL (y axis sorted by frequency of alleles in HipSci), from the GTEx dataset present in the HipSci resource, colored by tissue and by homozygous (dark) or heterozygous (light). Neandertal-associated eQTLs in the brain represent the pool of Neandertal-associated eQTLs that are found in at least one of the 13 GTEx brain tissues. (C) A power analysis shows the average of how many Neandertal eQTLs are present in at least a certain number of cell lines (color) out of a random sample of X lines (x axis) from the HipSci resource (grey). The range across the random samplings is shown in respective colors for each number of lines. (D) Plot showing the co-occurrence of Neandertal alleles within individuals. The frequency of each Neandertal allele is plotted against the proportion of all other Neandertal alleles with which it co-occurs in the HipSci resource. For example, an OAS1 Neandertal-derived allele is found at relatively high frequency (0.33, and present in 53% of all individuals) in the HipSci resource and is therefore paired with the majority of other Neandertal alleles. (E) Inferred Neandertal haplotypes in the 5 European (light blue, total of 505 individual) and 10 Asian (dark blue, total of 1,009 individuals) populations of the 1000 Genomes Project (1000 Genomes Project Consortium et al., 2015) recovered 21.3% and 33.5% of the Neandertal genome in Europeans and Asians, respectively. (F) Barplots show the presence of putative functional Neandertal variants at frequencies greater than 5% in the HipSci cohort as well as 1000 Genomes European and Asian populations (allele-specific expression [ASE]). We found that amino acid-modifying variants were slightly more prevalent in Asian populations, consistent with the higher amount of recovered Neandertal DNA in that population. However, other functional variants derived from association studies with gene expression and phenotype data were more often found in Europeans and the mostly European HipSci individuals, consistent with a detection bias inherited from the association analyses that were conducted in cohorts with a mostly European ancestry. See also Figure S1.
Figure 3
Figure 3
Overview of the Stem Cell Resource Browser Screenshots showing pages of the Neandertal Stem Cell Resource Browser (A). The website contains information about the presence of Neandertal variants for each individual in the HipSci resource (B,D) with a link to those variants that modify the protein sequence or have previously been associated with effects on gene expression and disease and non-disease phenotypes (B,C). The information of which cell lines carries the variant is displayed, and is designed to provide a practical resource to query the HipSci for available cell lines to study the effects of individual variants.
Figure 4
Figure 4
Tracking RNA from Neandertal-Introgressed Haplotypes during Cortex Development (A) Overview of analysis using single-cell RNA sequencing (scRNA-seq) data from cerebral organoids from multiple individuals with whole-genome genotype data. Schematic and immunohistochemistry show the structure of cortical-like regions within cerebral organoids. Radial glial (RG), intermediate progenitor (IP), and neuronal (N) (Mora-Bermúdez et al., 2016) cells were extracted from the organoid scRNA-seq data, and used to identify correlated gene expression patterns during cortical neuron differentiation. scRNA-seq data is from Kanton et al. (2019), and stainings are from Mora-Bermúdez et al. (2016). (B) SPRING reconstruction based on organoid scRNA-seq data from seven individuals (including four HipSci iPSC lines), with clusters colored by cell types. All subsequent analysis was based on RGCs, IPs, and neurons in the cortical trajectory. (C) A correlation network (knn, k = 70) using 7,349 genes (gray) that highly correlate in expression (r > 0.6) with transcription factors that have been shown to regulate progenitor proliferation/self-renewal and neuron differentiation (Camp et al., 2015) is shown with transcription factors that represent individual cell-type-specific expression colored (orange, RG; green, IP; blue, N). (D) Based on the reads from the scRNA-seq that overlap informative positions we are able to classify the reads as “Neandertal” or “modern human” depending on the observed allele at these sites. Plot shows the distribution of the number of reads with Neandertal informative variants across chromosome 1 from scRNA-seq data from organoids from four HipSci lines. Reads assigned to KIFAP3 and POU2F1, two genes that are part of the gene expression correlation network shown in Figure 3, are highlighted. POU2F1 and KIFAP3 show the highest expression in progenitors and neurons, respectively. (E) Number of reads covering Neandertal-informative variants which shows differences in their genotype between the 4 HipSci individuals for 535 genes. Bars representing genes with an expression difference of at least 2-fold between progenitors and neurons are highlighted in light pink (larger expression in progenitors) and dark pink (larger expression in neurons). Genes with no expression differences are shown in gray. (F) Gene models for KIFAP3 and POU2F1 are shown together with the locations of the Neandertal-informative SNPs, rs4519 and rs1059761, in the corresponding 3′ UTRs of these genes. The lower panel shows inferred Neandertal haplotypes in the four HipSci individuals overlapping chr1:167,000,000-170,000,000. (G and H) Spline-interpolated gene expression trajectories across pseudotime for four HipSci cell lines for POU2F1 (G) and KIFAP3 (H). Cell lines with a chromosome carrying Neandertal haplotypes overlapping KIFAP3 and POU2F1, respectively, are labeled with “NT.” Barplots show the fraction of reads for each cell line carrying at the Neandertal-informative position the modern human (gray) and Neandertal (black) variants. (I and J) The top panel shows the expression of all kucg cells for POU2F1 (I) and KIFAP3 (J) and whether cells have reads assigned that carry a Neandertal variant (black), a human variant (gray), both Neandertal and human variants (brown), or have no reads carrying Neandertal-informative variants (light grey). The bottom two panels highlight the cells with human-only (gray) or Neandertal-only reads. (K) Cortical gene correlation network. Left: 1,777 genes (24% of network genes) with overlapping Neandertal haplotypes in the HipSci individuals are colored in beige. Middle: subset of genes with overlapping Neandertal haplotypes in HipSci that carry Neandertal variants that are potentially functional, including eQTLs in cortical brain regions that are linked to a Neandertal haplotype in GTEx (Dannemann et al., 2017), variants that change the amino acid sequence, and variants that have been associated with clinical phenotypes (Simonti et al., 2016). Right: among the genes without overlapping Neandertal haplotypes in the HipSci are 81 genes that are located in desert regions devoid of Neandertal ancestry (Vernot et al., 2016) and 33 genes with fixed human-derived amino acid substitutions (Prüfer et al., 2014). See also Figures S2–S4.

Comment in

References

    1. 1000 Genomes Project Consortium, Auton A., Brooks L.D., Durbin R.M., Garrison E.P., Kang H.M., Korbel J.O., Marchini J.L., McCarthy S., McVean G.A. A global reference for human genetic variation. Nature. 2015;526:68–74. - PMC - PubMed
    1. Angerer P., Haghverdi L., Büttner M., Theis F.J., Marr C., Buettner F. destiny: diffusion maps for large-scale single-cell data in R. Bioinformatics. 2016;32:1241–1243. - PubMed
    1. Banovich N.E., Li Y.I., Raj A., Ward M.C., Greenside P., Calderon D., Tung P.Y., Burnett J.E., Myrthil M., Thomas S.M. Impact of regulatory variation across human iPSCs and differentiated cells. Genome Res. 2018;28:122–131. - PMC - PubMed
    1. Bonder M.J., Smail C., Gloudemans M.J., Frésard L., Jakubosky D., D’Antonio M., Li X., Ferraro N.M., Carcamo-Orive I., Mirauta B. Systematic assessment of regulatory effects of human disease variants in pluripotent cells. bioRxiv. 2019 doi: 10.1101/784967. - DOI
    1. Browning S.R., Browning B.L., Zhou Y., Tucci S., Akey J.M. Analysis of human sequence data reveals two pulses of archaic denisovan admixture. Cell. 2018;173:53–61.e9. - PMC - PubMed

Publication types