. 2020 Jun 25;181(7):1596-1611.e27.
doi: 10.1016/j.cell.2020.05.053. Epub 2020 Jun 18.

Metabolic Fingerprinting Links Oncogenic PIK3CA with Enhanced Arachidonic Acid-Derived Eicosanoids

Affiliations

Metabolic Fingerprinting Links Oncogenic PIK3CA with Enhanced Arachidonic Acid-Derived Eicosanoids

Nikos Koundouros et al. Cell. .

Abstract

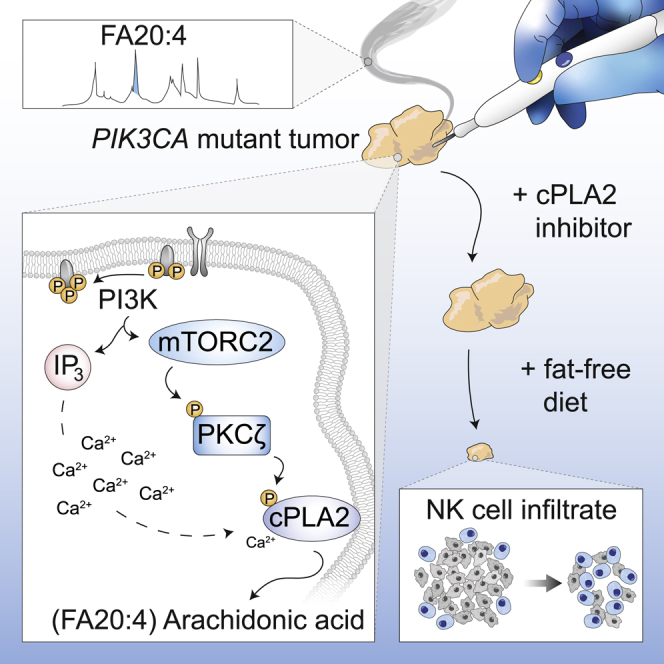
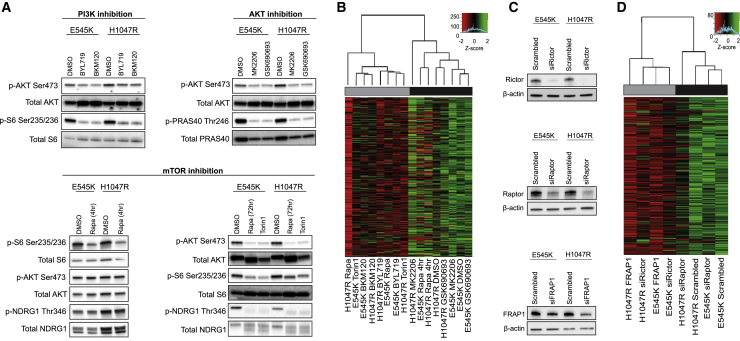
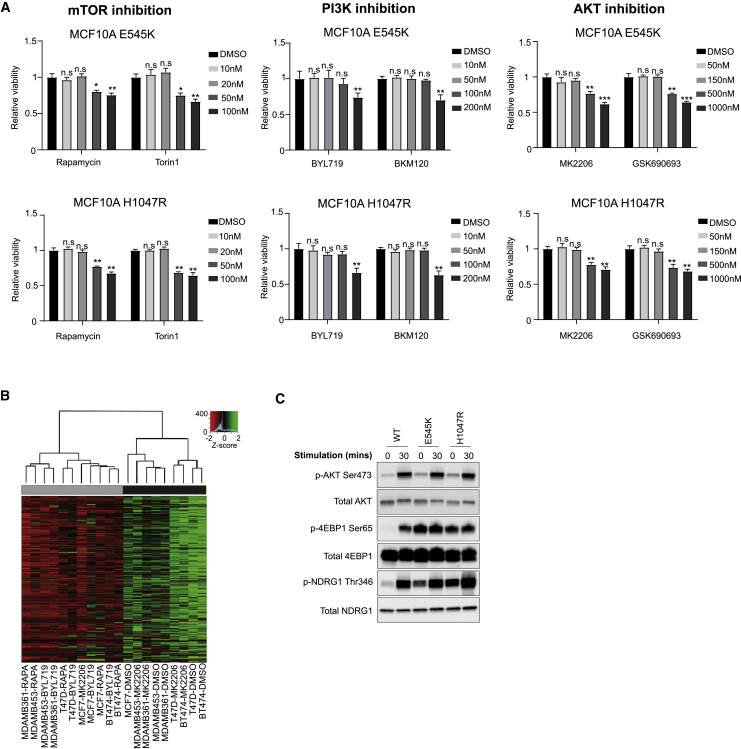
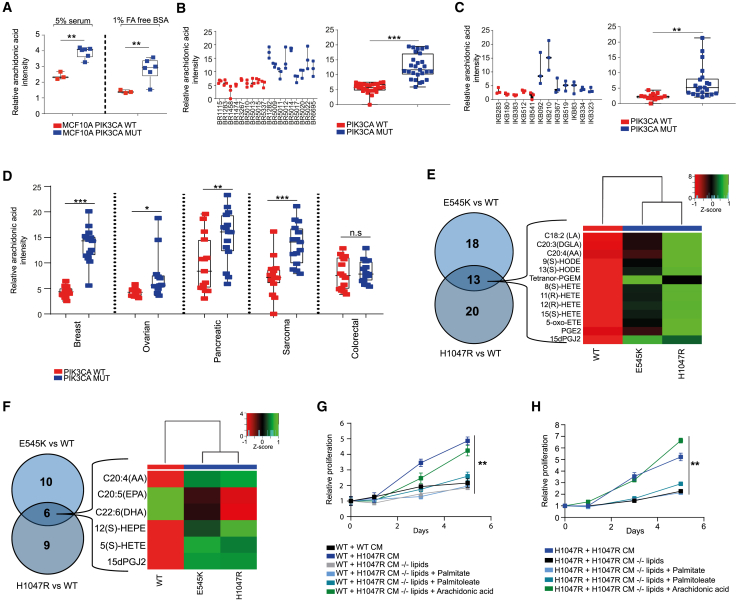
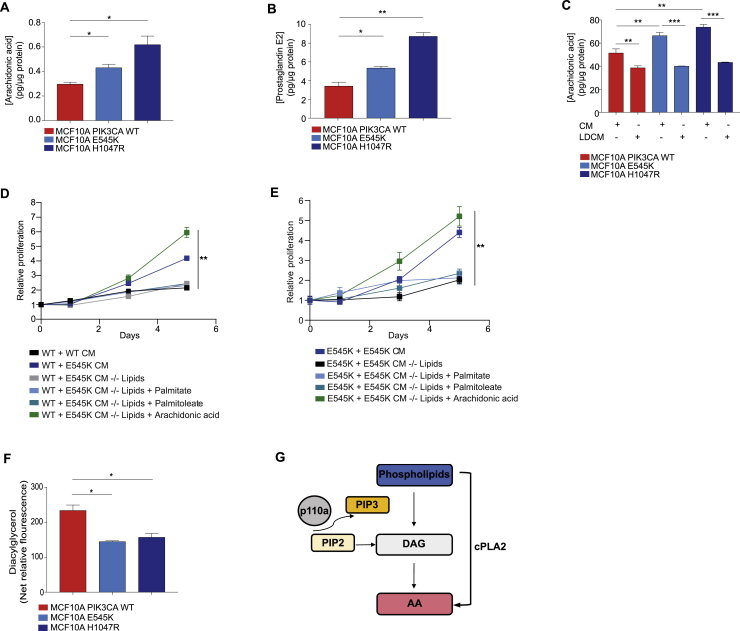
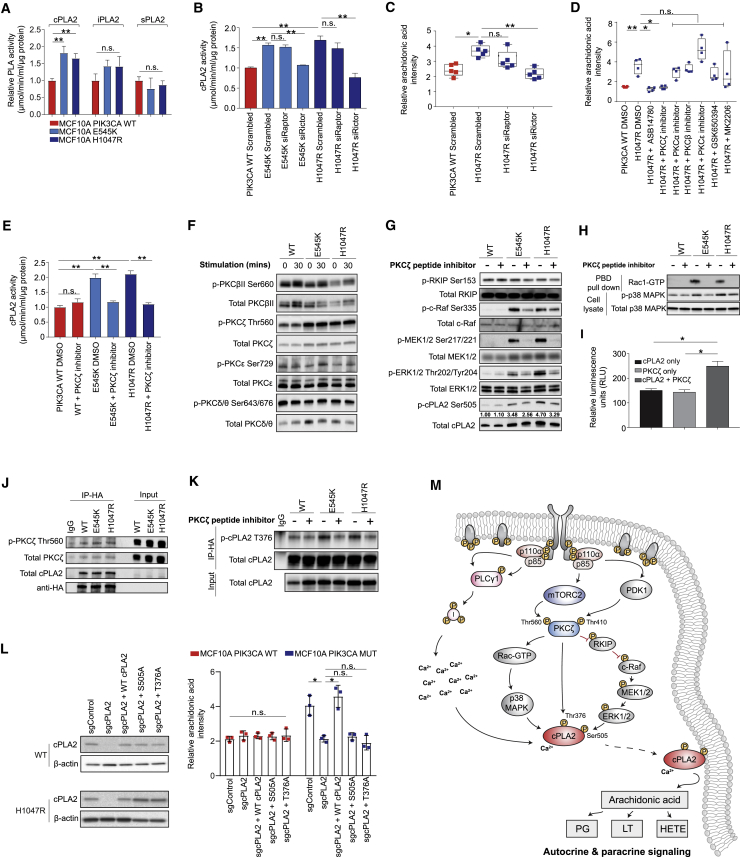
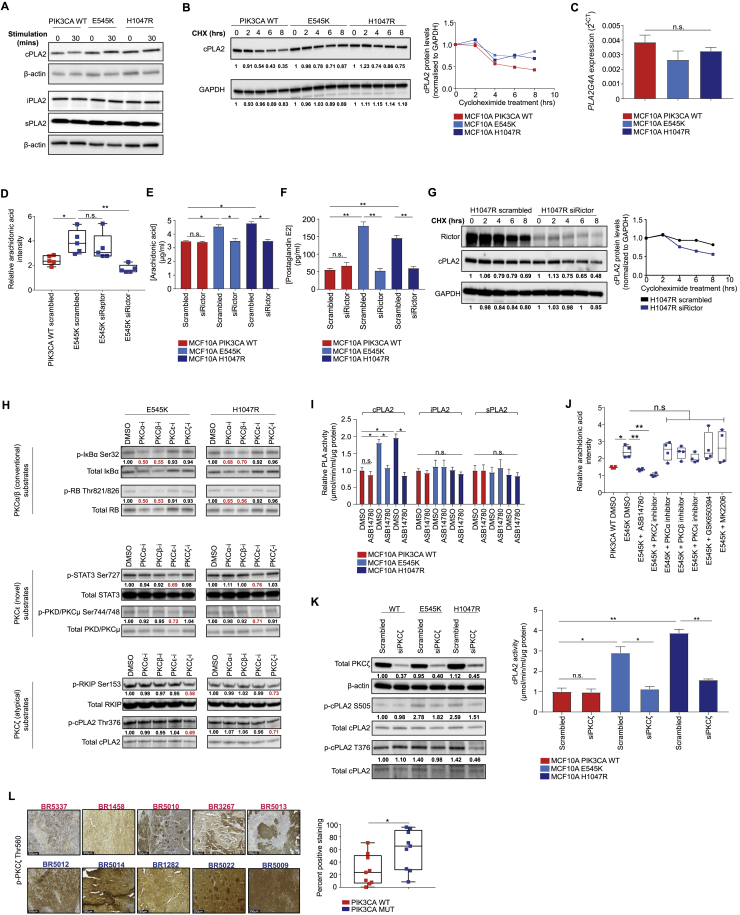
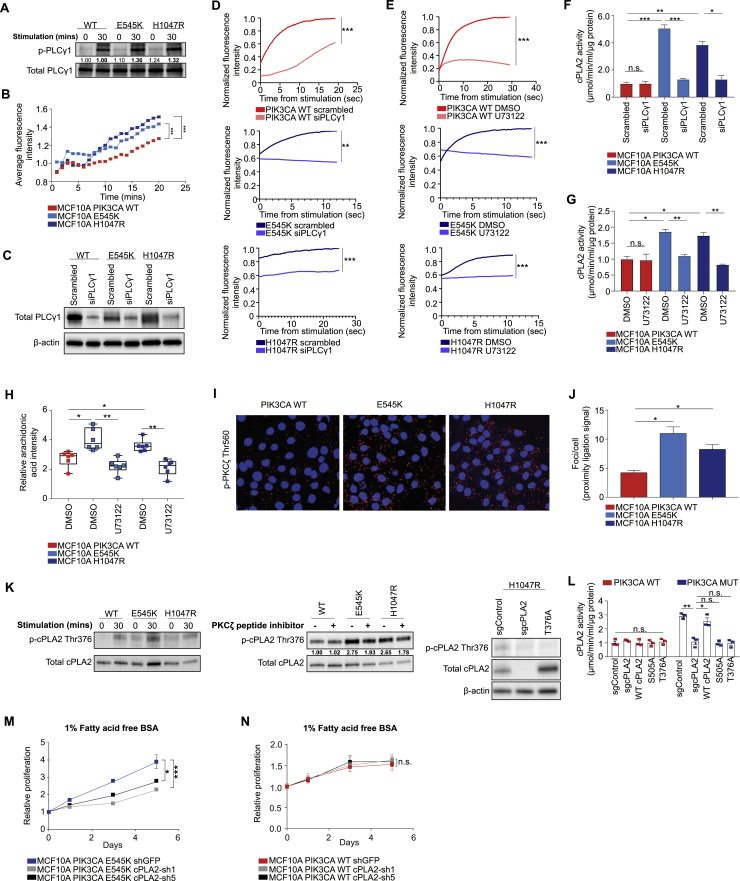
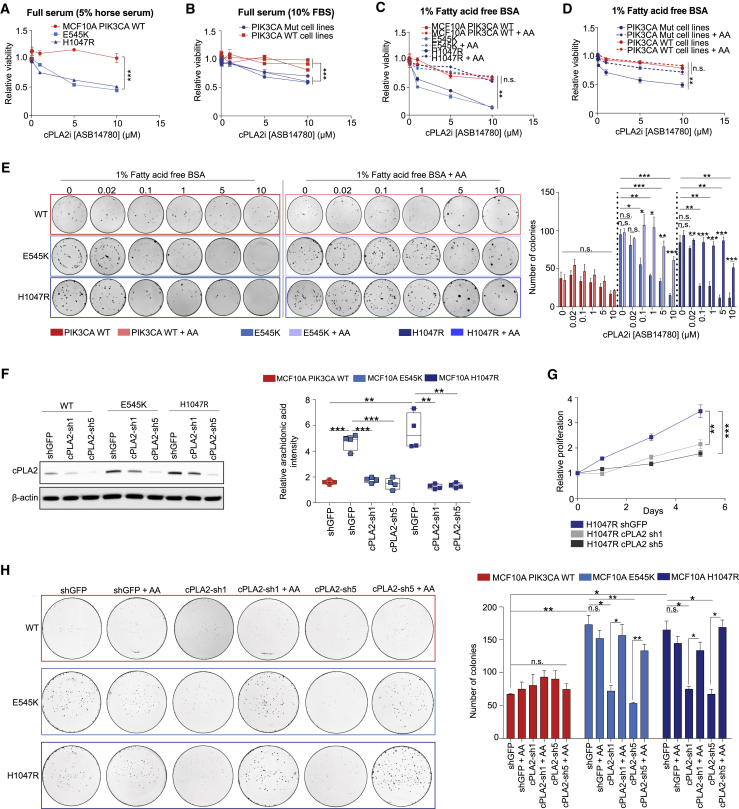
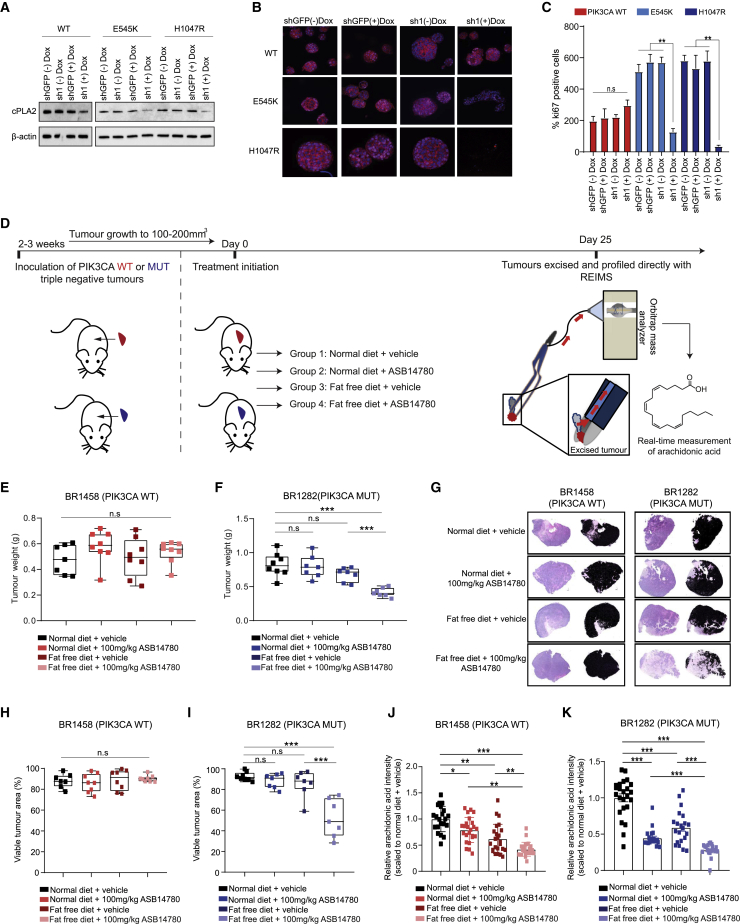
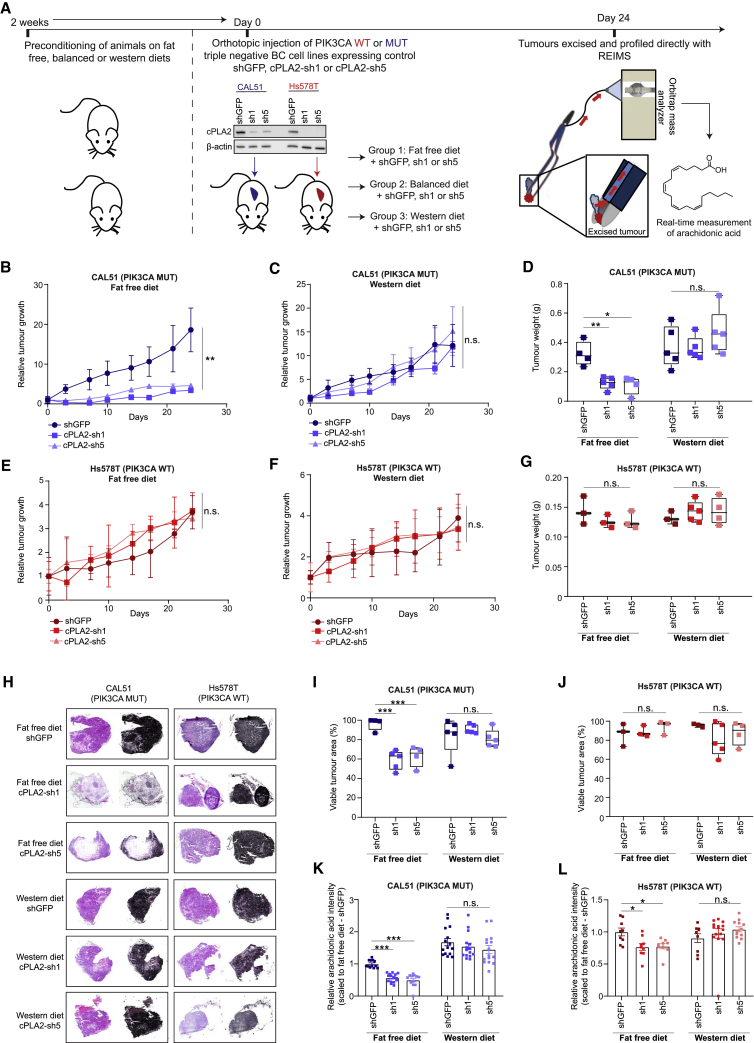
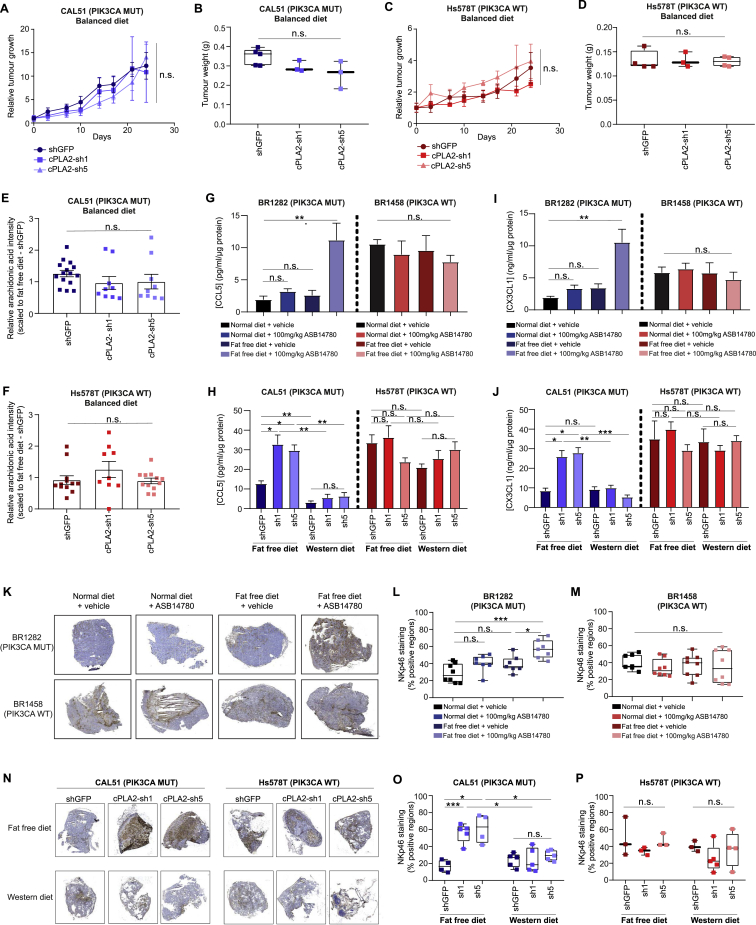
Oncogenic transformation is associated with profound changes in cellular metabolism, but whether tracking these can improve disease stratification or influence therapy decision-making is largely unknown. Using the iKnife to sample the aerosol of cauterized specimens, we demonstrate a new mode of real-time diagnosis, coupling metabolic phenotype to mutant PIK3CA genotype. Oncogenic PIK3CA results in an increase in arachidonic acid and a concomitant overproduction of eicosanoids, acting to promote cell proliferation beyond a cell-autonomous manner. Mechanistically, mutant PIK3CA drives a multimodal signaling network involving mTORC2-PKCζ-mediated activation of the calcium-dependent phospholipase A2 (cPLA2). Notably, inhibiting cPLA2 synergizes with fatty acid-free diet to restore immunogenicity and selectively reduce mutant PIK3CA-induced tumorigenicity. Besides highlighting the potential for metabolic phenotyping in stratified medicine, this study reveals an important role for activated PI3K signaling in regulating arachidonic acid metabolism, uncovering a targetable metabolic vulnerability that largely depends on dietary fat restriction. VIDEO ABSTRACT.

Keywords: PIK3CA; PKCζ; arachidonic acid; cPLA2; cancer metabolism; diet; eicosanoids; fat restriction; iKnife; mTORC2.


Conflict of interest statement

Declaration of Interests N.K. and G.P. are inventors on a patent application covering new methods and compositions useful in the treatment of cancers with PIK3CA mutation (application number GB 2005874.9).

Figures

None
Graphical abstract
Figure 1
Figure 1
REIMS Analysis Predicts Breast Cancer Molecular Markers Including Oncogenic Mutations in PIK3CA (A) Schematic overview of sample preparation for REIMS analysis. (B) Area under the curve (AUC) classification accuracies for ER, PR, HER2 receptor, and triple negative status of 43 breast cancer (BC) cell lines (median intensity of n = 3 biological replicates) following feature selection for phospholipids in the m/z range 600–900, and leave-one-out cross validation. (C) Immunoblot analysis of estrogen inducible protein pS2 and predicted ESR1 expression in ER+ve MCF7 cells following treatment with 0.1% DMSO or indicated concentrations of 4-OHT for 72 h. (D) Unsupervised hierarchical clustering of 872 lipid species detected by REIMS across 43 BC cell lines. (E) Dendrogram of BC cell lines and isogenic MCF10A cells harboring either WT or MUT (E545K or H1047R) PIK3CA. (F) Immunoblot analysis of mature SREBP1 transcription factor expression in nuclear extracts of the MCF10A PIK3CA isogenic panel. (G) Relative exogenous fatty acid uptake in MCF10A PIK3CA WT and MUT cells following serum starvation for 1 h and supplementation with fluorescently labeled dodecanoic acid (n = 5 replicates). (H and I) Unsupervised hierarchical clustering of 9 PIK3CA WT and 9 MUT breast PDX tumors (H) and (I) 5 WT and 7 MUT primary breast tumors. Individual rows in the heatmaps in (D), (H) and (I) correspond to scaled Z score phospholipid intensities (n = 3 biological replicates). Error bars represent ± SEM. n.s., not significant; p ≤ 0.05; ∗∗p ≤ 0.01; ∗∗∗p ≤ 0.001. p values in (C, bottom panel) and (G) were calculated with one-way ANOVA, followed by unpaired, two-tailed Student’s t test with Bonferroni correction.
Figure S1
Figure S1
Related to Figure 1 (A) Volcano plots of significantly altered phospholipids between receptor positive and negative cell lines. Black dots: not significantly altered; Red dots: significantly upregulated; Green dots: significantly downregulated phospholipids. (B) Area under the curve (AUC) classification accuracies for estrogen (ER), progesterone (PR), HER2 receptor and triple negative status of 30 primary and PDX breast tumors (median intensity of n = 3 separate sections per tumor) following feature selection for phospholipids in the m/z range 600-900 and leave-one-out cross validation. (C) Immunoblot analysis of estrogen inducible protein pS2 (top) and prediction of ESR1 expression (bottom) in ER+ve T47D cells following treatment with 0.1% DMSO or indicated concentrations of 4-OHT for 72 hours using REIMS. (D) NMF consensus maps summarizing the clustering of cell lines used in Figure 1D. The color map represents the correlation between cell lines in the same cluster when samples are divided into 2-6 groups. The highest cophenetic score was obtained for two clusters. (E) REIMS analysis of MCF10A PIK3CA WT and MUT cells cultured as 3D spheroids for 10 days. Clustering was performed as in Figure 1D using the median lipid intensities of 3 biological replicates. (F) Overall, precision and recall classification accuracies for PIK3CA mutation status in primary and PDX breast tumors (n = 30 in total), using all detectable lipid features (n = 1147) following 3-fold cross validation repeated 100 times with random forest as a classifier. n.s., not significant; p ≤ 0.05; ∗∗p ≤ 0.01; ∗∗∗p ≤ 0.001. P values in (C, bottom panel) were calculated with one-way ANOVA, followed by unpaired, two-tailed Student’s t test with Bonferroni correction.
Figure S2
Figure S2
Related to Figures 1 and 2 (A) Pathway enrichment analysis of genes corresponding to the three most significantly enriched KEGG pathways determined from the 512 significantly upregulated genes in the lipid-enriched cluster from Figure 1D. (B) Gene interaction networks corresponding to the 55 genes encompassing the KEGG pathways in (A). (C) FASN, (D) ELOVL6, and (E) LDLRAP1 mRNA expression between cell lines in the lipid-enriched (n = 19) and depleted (n = 15) clusters. p ≤ 0.05; ∗∗p ≤ 0.01; ∗∗∗p ≤ 0.001. P values in (C), (D), and (E) were calculated with unpaired, two-tailed Student’s t test.
Figure 2
Figure 2
Oncogenic PIK3CA Drives the Lipid-Enriched Phenotype via mTORC2 Signaling (A) MCF10A PIK3CA MUT cells were treated with BYL719 or BKM120 (100 nM), MK2206, or GSK690693 (150 nM) for 72 h, or rapamycin (20 nM) for 4 h, or rapamycin or torin 1 (20 nM) for 72 h. (B) Unsupervised hierarchical clustering of MCF10A E545K and H1047R MUT cells treated with PI3K, AKT, and mTOR inhibitors. (C and D) Immunoblot analysis (C) and unsupervised hierarchical clustering (D) of MCF10A E545K and H1047R cells transfected with RAPTOR, RICTOR, or mTOR siRNA. Individual rows in the heatmaps in (B) and (D) correspond to scaled Z score phospholipid intensities (n = 3 biological replicates).
Figure S3
Figure S3
Related to Figure 2 (A) Cell viability of MCF10A PIK3CA MUT cells following treatment with increasing concentrations of rapamycin, torin 1, BYL-719, BKM120, MK2206 or GSK690693 for 72 hours. (B) Unsupervised hierarchical clustering of the median phospholipid intensities of 5 PIK3CA MUT breast cancer cell lines (MCF7, T47D, MDAMB361, MDAMB453 and BT474) treated with 20 nM rapamycin, 100 nM BYL-719 and 150 nM MK2006 for 72 hours. (C) Immunoblot analysis of mTORC1 and mTORC2 signaling in the PIK3CA MUT isogenic panel. Cells were serum and growth-factor starved for 16 hours and subsequently stimulated with 5% horse serum, 20 ng/ml EGF, 0.5 mg/ml hydrocortisone and 10 μg/ml insulin for 30 min. Data in (A) are presented as the mean ± SEM of n = 4 biological replicates and are representative of at least two independent experiments. n.s., not significant; p ≤ 0.05; ∗∗p ≤ 0.01. P values in (A) were calculated with unpaired, two-tailed Student’s t test.
Figure 3
Figure 3
Oncogenic PIK3CA Drives Enhanced Arachidonic Acid Metabolism (A and B) Arachidonic acid (AA) levels measured by REIMS in MCF10A PIK3CA WT and MUT cells cultured under full 5% horse serum or fatty acid-free (FAF) conditions for 72 h (n = 3 biological replicates) (A). AA levels of 18 breast PDX tumors (n = 9 PIK3CA WT and n = 9 MUT) (left) (B). Three sections corresponding to different tumor regions were analyzed with REIMS. Data are summarized in the boxplot to the right. (C) 12 primary breast tumors (n = 5 PIK3CA WT and n = 7 MUT) (left). Data are summarized in the boxplot to the right. (D) Breast, ovarian, pancreatic, sarcoma, and colorectal PDX tumors (n = 5 PIK3CA WT and MUT tumors for breast, pancreatic, sarcoma, and colorectal tissues, and n = 4 PIK3CA WT and MUT ovarian PDX tumors). (E) Heatmap and Venn diagram summarizing the intracellular eicosanoids that were significantly different between MCF10A PIK3CA WT and MUT cells. Rows correspond to the Z score scaled eicosanoid intensities detected by LC-MS (n = 3 biological replicates). (F) Heatmap and Venn diagram summarizing the eicosanoids of the conditioned media (CM) that were significantly different between MCF10A PIK3CA WT and MUT cells. (G) Cell proliferation assays of MCF10A PIK3CA WT cells cultured in CM derived from WT or H1047R MUT cells before or after lipid depletion (LD), with or without the supplementation of 25 μM AA, palmitate, or palmitoleate. (H) Cell proliferation assays of MCF10A PIK3CA H1047R MUT cells before or after LD, with or without the supplementation of 25 μM AA, palmitate, or palmitoleate. Sulforhodamine B (SRB) protein staining was used in (G) and (H) to measure cell proliferation over 5 days (replicates from n = 3 wells). Error bars in (G) and (H) represent mean ± SEM for each time point. p ≤ 0.05; ∗∗p ≤ 0.01; ∗∗∗p ≤ 0.001. p values in (A)–(D) were calculated with unpaired, two tailed Student’s t test. Two-way ANOVA was used for (G) and (H).
Figure S4
Figure S4
Related to Figures 3 and 4 Intracellular levels of (A) Arachidonic acid (AA) and (B) PGE2 levels as measured by LC-MS profiling. (C) AA levels from the conditioned media (CM) of indicated cells before and after lipid depletion (LD). (D) Cell proliferation assays of MCF10A PIK3CA WT cells cultured in CM derived from WT or E545K MUT cells before or after LD, with or without the supplementation of 25 μM AA, palmitate or palmitoleate. (E) Cell proliferation assays of MCF10A PIK3CA E545K MUT cells before or after LD, with or without the supplementation of 25 μM AA, palmitate or palmitoleate. (F) Diacylglycerol (DAG) levels in MCF10A PIK3CA WT and MUT cells. (G) Diagram summarizing DAG contribution to AA production. Sulforhodamine B (SRB) protein staining was used in (D) and (E) to measure cell proliferation over 5 days. Data are presented as the mean ± SEM of n = 3-4 biological replicates and are representative of at least two independent experiments. p ≤ 0.05; ∗∗p ≤ 0.01; ∗∗∗p ≤ 0.001. P values in (A), (B), (C) and (F) were calculated using one-way ANOVA followed by unpaired, two-tailed Student’s t test with Bonferroni correction, and in (D) and (E) with two-way ANOVA.
Figure 4
Figure 4
Oncogenic PIK3CA Signaling Triggers cPLA2-Induced Arachidonic Acid Production (A) Enzymatic activity of cPLA2, iPLA2, and sPLA2 in the MCF10A PIK3CA isogenic panel. (B–D) cPLA2 activity (B) and AA levels (C and D) measured by REIMS in MCF10A H1047R PIK3CA MUT cells following RAPTOR or RICTOR siRNA-mediated knockdown (C), or treatment with 100 nM ASB14780, 1 μM each of PKCα, β, ε, or ζ peptide inhibitors, 250 μM GSK650394, or 150 nM MK2206 for 72 h (D). Cells were grown under exogenous FAF conditions. (E) cPLA2 activity following PKCζ inhibition with 1 μM peptide inhibitor for 72 h. (F and G) Immunoblot analysis of the MCF10A PIK3CA isogenic panel following growth factor deprivation for 16 h and 30 min stimulation with serum and growth factors (F) or PKCζ inhibition with 1 μM peptide inhibitor for 72 h (G). (H) Immunoblot analysis of activated Rac-1 and p38 MAPK in the MCF10A PIK3CA isogenic panel following PKCζ inhibition with 1 μM peptide inhibitor for 72 h. (I) In vitro kinase assay of 100 ng and 0.5 μg/μL purified PKCζ and cPLA2 proteins, respectively. (J) Immunoblot analysis of anti-HA immunoprecipitates derived from HA-tagged cPLA2 transfected MCF10A PIK3CA WT and MUT cells. (K) Immunoblot analysis of anti-HA immunoprecipitates derived from HA-tagged cPLA2 transfected MCF10A PIK3CA WT and MUT cells treated where indicated with 1 μM PKCζ peptide inhibitor for 48 h. (L) AA levels across H1047R MUT cells with CRISPR knockout of PLA2G4A reconstituted with WT or phosphoresistant cPLA2 isoforms. (M) Diagram summarizing the proposed model for PI3K-mTORC2-PKCζ and calcium-dependent activation of cPLA2, leading to a concomitant increase in AA and downstream eicosanoids. Data are presented as the mean ± SEM of n = 3–6 biological replicates and are representative of at least two independent experiments. n.s., not significant; p ≤ 0.05; ∗∗p ≤ 0.01; ∗∗∗p ≤ 0.001. p values in (A) were calculated with unpaired, two tailed Student’s t test, and in (B)–(E), (I), and (L) with one-way ANOVA, followed by unpaired, two-tailed Student’s t test with Bonferroni correction.
Figure S5
Figure S5
Related to Figure 4 (A) Immunoblot of phospholipases in MCF10A PIK3CA WT and MUT cells following serum and growth-factor deprivation for 16 hours and stimulation with serum and growth factors for 30 min. (B) Immunoblot analysis of cPLA2 protein decay following treatment with 50 μM cycloheximide (CHX) for the indicated times. Image and quantification is from one experiment. (C) Real-time quantitative PCR of PLA2G4A expression in the MCF10A PIK3CA isogenic panel. (D) AA levels measured by REIMS in MCF10A E545K PIK3CA MUT cells following RAPTOR and RICTOR siRNA-mediated knockdown 48 hours post transfection under exogenous FAF conditions. ELISA analysis of (E) AA and (F) PGE2 in the MCF10A PIK3CA isogenic panel 48 hours post RICTOR siRNA-mediated knockdown. (G) Immunoblot analysis of cPLA2 protein decay (top) and quantification (bottom) following RICTOR siRNA-mediated knockdown and treatment with 50 μM cycloheximide for the indicated times. Image and quantification is from one experiment. (H) Immunoblot analysis of substrates of conventional PKCα/β (p-IκBα Ser32 and p-RB Thr821/826), novel PKCε (p-STAT3 Ser727 and p-PKD Ser744/748) and atypical PKCζ (p-RKIP Ser153 and p-cPLA2 T376) isoforms following treatment of MCF10A E545K and H1047R MUT cells with 1 μM of each PKCα, β, ε, and ζ peptide inhibitors for 72 hours. (I) Enzymatic activity of cPLA2, iPLA2, and sPLA2 in the MCF10A PIK3CA isogenic panel following treatment with 100 nM ASB14780 for 72 hours. (J) AA levels measured by REIMS in MCF10A E545K MUT cells treated with 100 nM ASB14780, 1 μM each of PKCα, β, ε, and ζ peptide inhibitors, 250 μM GSK650394, or 150 nM MK2206 for 72 hours under exogenous FAF conditions. (K) Immunoblot (right) of total PKCζ and phospho-S505 and T376 cPLA2 of MCF10A PIK3CA WT and MUT cells following PKCζ siRNA-mediated knockdown, and cPLA2 activity (left) following 48 hours post-transfection. (L) Representative phospho-PKCζ Thr560 immunoreactivity images (left) of 9 PIK3CA MUT (blue) and 9 WT (red) breast PDX tumors. Scale bar = 250 μm. Quantification of percent positive regions (right) was performed using the IHC profiler plug-in for ImageJ. Data are presented as the mean ± SEM of n = 3-5 biological replicates and are representative of at least two independent experiments. n.s., not significant, p ≤ 0.05; ∗∗p ≤ 0.01. P values in (C), (D), (E), (F), (I), (J) and (K, right) with one-way ANOVA followed by unpaired, two-tailed Student’s t test with Bonferroni correction, and in (L) with unpaired, two-tailed Student’s t test.
Figure S6
Figure S6
Related to Figures 4 and 5 (A) Immunoblot analysis of phospho-Tyr783 PLCγ1 in MCF10A PIK3CA isogenics following serum and growth factor deprivation for 16 hours, and stimulation with serum and growth factors for 30 min. Densitometry values are either scaled to unstimulated or stimulated (bold) WT samples. (B) Measurement of intracellular calcium flux in MCF10A PIK3CA isogenics following serum and growth factor deprivation and stimulation for 30 min. (C) Immunoblot of MCF10A PIK3CA WT and MUT cells following siRNA-mediated knockdown of PLCγ1. (D) Intracellular calcium flux of MCF10A PIK3CA WT (top), E545K (middle) and H1047R (bottom) cells 48 hours post transfection with siPLCγ1, or (E) treatment with 2 μM U73122 for 24 hours. For the final 18 hours of the treatments, cells were serum and growth factor deprived, and stimulated with full media immediately prior to the assay. cPLA2 activity in MCF10A PIK3CA WT and MUT following (F) siRNA-mediated knockdown of PLCγ1 for 48 hours, or (G) treatment with 2 μM U73122 for 24 hours. (H) AA levels measured by REIMS in MCF10A PIK3CA isogenics following treatment with 2 μM U73122 for 24 hours. (I) Representative confocal images and (J) quantification of in situ proximity ligation assay (PLA) between cPLA2 and phospho-Thr560 PKCζ in MCF10A PIK3CA WT and MUT cells. (K) Immunoblot analysis of phospho-cPLA2 (T376) custom antibody in the MCF10A isogenic panel following serum and growth factor deprivation for 18 hours and subsequent stimulation for 30 min (left), treatment with 1 μM PKCζ peptide inhibitor for 72 hours (middle), and in MCF10A H1047R cPLA2 CRISPR knockout cells overexpressing a phosphoresistant mutant (T376A) cPLA2 (right). (L) Activity of cPLA2 in MCF10A PIK3CA WT or H1047R cPLA2 CRISPR knockout cells transfected with 9 μg of either WT-cPLA2, or S505A/T376A phosphoresistant mutant cPLA2 constructs. Activity was measured 48 hours post-transfection. Cell proliferation of MCF10A (M) PIK3CA WT and (N) E545K MUT cells expressing control shGFP, cPLA2-sh1 or sh5 under exogenous FAF conditions. Sulforhodamine B (SRB) protein staining was used to measure cell proliferation over 5 days. Data in (B), (D), (E), (F), (G), (H), (L), (M) and (N) are presented as the mean ± SEM of n = 3-6 biological replicates and are representative of at least two independent experiments. n.s., not significant; p < 0.05; ∗∗p < 0.01; ∗∗∗p < 0.001; P values in (B), (D), (E), (M) and (N) were calculated using two-way ANOVA. One-way ANOVA followed by Student’s t test with Bonferroni correction was used for (F), (G), (H), (J)and (L).
Figure 5
Figure 5
Genetic and Pharmacological Inhibition of cPLA2 Selectively Reduces Oncogenic PIK3CA-Mediated Tumorigenicity (A–D) Cell viability of (A) PIK3CA WT and MUT MCF10A cells, and (B) breast cancer cell lines (PIK3CA WT: MDAMB134, Hs578T, AU565; PIK3CA MUT: MCF-7, CAL-51, MDAMB453) following treatment with increasing concentrations (20 nM–10 μM) of ASB14780 under full serum conditions for 72 h. The same treatments were also performed under fatty acid-free conditions in (C) and (D), in the presence or absence of exogenous supplementation of 25 μM AA. (E) Clonogenic assays of MCF10A PIK3CA WT and MUT cells treated with increasing concentrations of ASB14780 as in (A)–(D). Treatments were performed under fatty acid-free conditions, with or without the supplementation of 25 μM AA. (F) Immunoblot analysis confirming specific knockdown of cPLA2 using two independent constitutive shRNAs (sh1 and sh5) (left) and reduction in AA levels in MCF10A E545K/H1047R MUT cells using REIMS. (G) Proliferation of MCF10A H1047R MUT cells expressing shGFP, cPLA2-sh1, or cPLA2-sh5 under exogenous FAF conditions. Sulforhodamine B (SRB) protein staining was used to measure cell proliferation over 5 days. (H) Clonogenic assays of MCF10A PIK3CA WT and MUT cells expressing shGFP, cPLA2-sh1, or cPLA2-sh5 under FAF conditions, supplemented with or without 25 μM AA. Data in (A)–(H) are presented as the mean ± SEM of n = 3–4 biological replicates and are representative of at least two independent experiments. Data in (D) are presented as the mean viability of three PIK3CA MUT (MCF-7, CAL-51, MDAMB453) and WT (MDAMB134, Hs578T, AU565) measured in triplicate wells. n.s., not significant; p < 0.05; ∗∗p < 0.01; ∗∗∗p < 0.001; p values in (A)–(D) and (G) were calculated using two-way ANOVA. For (E, right), (F, right), and (H, right), one-way ANOVA followed by unpaired, two-tailed Student’s t test with Bonferroni correction was applied.
Figure 6
Figure 6
Oncogenic PIK3CA Serves as a Defining Biomarker for Sensitivity of Pre-clinical Models to cPLA2 Inhibition (A) Immunoblot analysis confirming inducible knockdown of cPLA2 following induction with 2 μg/mL doxycycline. (B) 3D acini formation of MCF10A PIK3CA WT and MUT cells following doxycycline-induced cPLA2-sh1 or shGFP expression. Cells were stained for Ki-67 (pink, Alexa Fluor 546), F-actin (red, Phalloidin 633), and DAPI (blue). (C) Quantification of Ki-67 staining from treatments in (B). (D) Schematic of in vivo experimental design and tumor profiling with REIMS. (E and F) Tumor weights of (E) PIK3CA WT (BR1458) and (F) C420R MUT (BR1282) breast PDX tumors treated with 100 mg/kg of the cPLA2α pharmacological inhibitor ASB14780 under FAF diet (n = 8 mice for the BR1458 model, and n = 7 mice for the BR1282 for both the vehicle- and ASB14780-treated groups). (G) Representative images of H&E staining from resected tumors in (E) and (F). The black masks in (G) represent viable tumor area, while unshaded regions correspond to necrotic tissue. (H and I) Quantification of viable tumor area from (H) PIK3CA WT (BR1458) and (I) PIK3CA MUT (BR1282) tumor sections based on the analysis depicted in (G). (J and K) AA levels measured by REIMS in (J) PIK3CA WT (BR1458) and (K) MUT (BR1282) tumors excised and snap frozen 2 h after the final dosing. Error bars in (C), (J), and (K) represent mean ± SEM, with data in (J) and (K) corresponding to tumor REIMS measurements from n = 7–8 mice. n.s., not significant;p < 0.05; ∗∗p < 0.01; ∗∗∗p < 0.001; p values in (E), (F), and (H)–(K) were calculated using one-way ANOVA followed by unpaired, two-tailed Student’s t test with Bonferroni correction.
Figure 7
Figure 7
Dietary Supplementation of Arachidonic Acid Reverses the Sensitivity of PIK3CA Mutant Tumors to cPLA2 Inhibition (A) Schematic of in vivo experimental design and profiling of breast cancer cell line xenografts with REIMS. (B and C) Relative tumor growth of CAL-51 (PIK3CA MUT)-derived xenografts stably expressing control shGFP or two independent shRNAs targeting cPLA2 (cPLA2-sh1 and cPLA2-sh5) under (B) fat-free or (C) “Western” diets. (D) Weights of tumors excised at the end of the experiments (B) and (C). (E and F) Relative tumor growth of Hs578T (PIK3CA WT)-derived xenografts stably expressing control shGFP or two independent shRNAs targeting cPLA2 under (E) fat-free or (F) “Western” diets. (G) Weights of tumors excised at the end of the experiments (E) and (F). (H) Representative images of H&E staining from resected tumors in (D) and (G). The black masks in (H) represent viable tumor area, while unshaded regions correspond to necrotic tissue. (I and J) Quantification of viable tumor area from (I) PIK3CA MUT (CAL-51) and (J) PIK3CA WT (Hs578T) tumor sections based on the analysis depicted in (H). (K and L) AA levels measured by REIMS in (K) PIK3CA MUT (CAL-51) and (L) PIK3CA WT (Hs578T) snap frozen excised tumors. AA intensities are reported as scaled values to the appropriate shGFP-fat-free diet condition. Data in (B), (C), (E), (F), (K), and (L) represent the mean ± SEM of relative tumor growth or tumor REIMS measurements from n = 3–5 mice. n.s., not significant; p < 0.05; ∗∗p < 0.01; ∗∗∗p < 0.001; p values in (B), (C), (E), and (F) were calculated using two-way ANOVA, and one-way ANOVA followed by unpaired, two-tailed Student’s t test with Bonferroni correction was used in (D), (G), and (I)–(L).
Figure S7
Figure S7
Related to Figures 6 and 7 (A) Relative tumor growth and (B) tumor weights of CAL51 (PIK3CA MUT)-derived xenografts stably expressing control shGFP or two independent shRNAs targeting cPLA2 (cPLA2-sh1 and cPLA2-sh5) in mice fed a balanced omega3:omega6 diet. (C) Relative tumor growth and (D) tumor weights of Hs578T (PIK3CA WT)-derived xenografts stably expressing control shGFP or cPLA2-sh1 or cPLA2-sh5 in mice fed a balanced omega3:omega6 diet. AA levels measured by REIMS in (E) PIK3CA MUT (CAL51) and (F) PIK3CA WT (Hs578T) snap frozen excised tumors. AA intensities are reported as scaled values to the appropriate shGFP-fat free diet control. Quantification of CCL5 from excised tumors derived from (G) PDX and (H) cell line-derived xenograft studies. Quantification of CX3CL1 from excised tumors derived from (I) PDX and (J) cell line-derived xenograft studies. Concentrations of chemokines in (G-J) were determined from whole tumor lysates using ELISA, and normalized to protein content. (K) Representative immunohistochemical staining of the activated NK cell marker NKp46 in BR1282 (PIK3CA MUT) and BR1458 (PIK3CA WT) PDX tumors. (L) and (M) Quantification of positively immunostained areas from (K). (N) Representative immunohistochemical staining of NKp46 in shGFP, cPLA2-sh1 and cPLA2-sh5 expressing CAL51 (PIK3CA MUT) and Hs578T (PIK3CA WT)-derived xenograft tumors under fat free or ‘Western’ diets. (O) and (P) Quantification of positively immunostained areas from (N). Data in (A), (C), and (E) to (J) are presented as the mean ± SEM of n = 3–5 mice for cell line xenograft or n = 7–8 mice for PDX studies. n.s., not significant; p < 0.05; ∗∗p < 0.01; ∗∗∗p < 0.001; P values in (A) and (C) were calculated using two-way ANOVA, and one-way ANOVA followed by unpaired, two tailed Student’s t test with Bonferroni correction was used in (B), (D), (E), (F), (G), (H), (I), (J), (L), (M), (O), (P).

Comment in

References

    1. Alexander L.D., Ding Y., Alagarsamy S., Cui X.L., Douglas J.G. Arachidonic acid induces ERK activation via Src SH2 domain association with the epidermal growth factor receptor. Kidney Int. 2006;69:1823–1832. - PubMed
    1. Alexander J., Gildea L., Balog J., Speller A., McKenzie J., Muirhead L., Scott A., Kontovounisios C., Rasheed S., Teare J. A novel methodology for in vivo endoscopic phenotyping of colorectal cancer based on real-time analysis of the mucosal lipidome: a prospective observational study of the iKnife. Surg. Endosc. 2017;31:1361–1370. - PMC - PubMed
    1. Ambs P., Baccarini M., Fitzke E., Dieter P. Role of cytosolic phospholipase A2 in arachidonic acid release of rat-liver macrophages: regulation by Ca2+ and phosphorylation. Biochem. J. 1995;311:189–195. - PMC - PubMed
    1. Balog J., Sasi-Szabó L., Kinross J., Lewis M.R., Muirhead L.J., Veselkov K., Mirnezami R., Dezső B., Damjanovich L., Darzi A. Intraoperative tissue identification using rapid evaporative ionization mass spectrometry. Sci. Transl. Med. 2013;5:194ra93. - PubMed
    1. Basingab F.S., Ahmadi M., Morgan D.J. IFNγ-Dependent Interactions between ICAM-1 and LFA-1 Counteract Prostaglandin E2-Mediated Inhibition of Antitumor CTL Responses. Cancer Immunol. Res. 2016;4:400–411. - PubMed

Publication types

MeSH terms