. 2020 Jun 25;181(7):1502-1517.e23.
doi: 10.1016/j.cell.2020.05.035. Epub 2020 Jun 18.

Hybrid Gene Origination Creates Human-Virus Chimeric Proteins during Infection

Affiliations

Hybrid Gene Origination Creates Human-Virus Chimeric Proteins during Infection

Jessica Sook Yuin Ho et al. Cell. .

Abstract

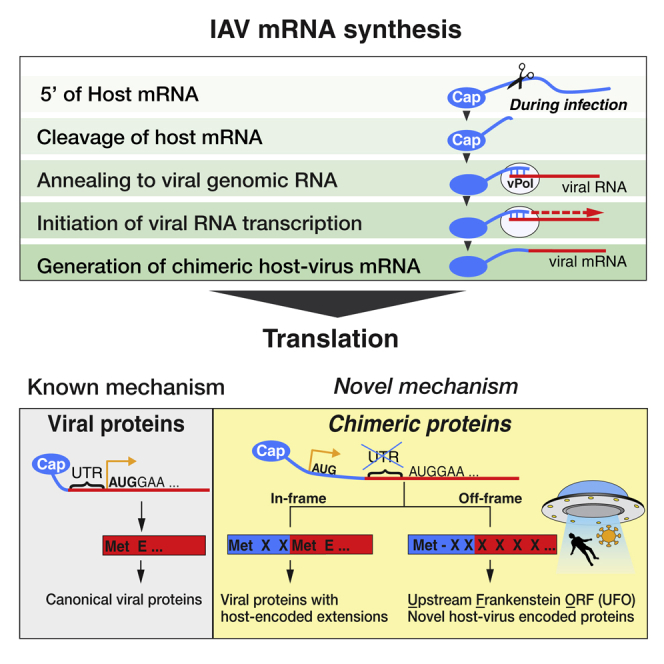
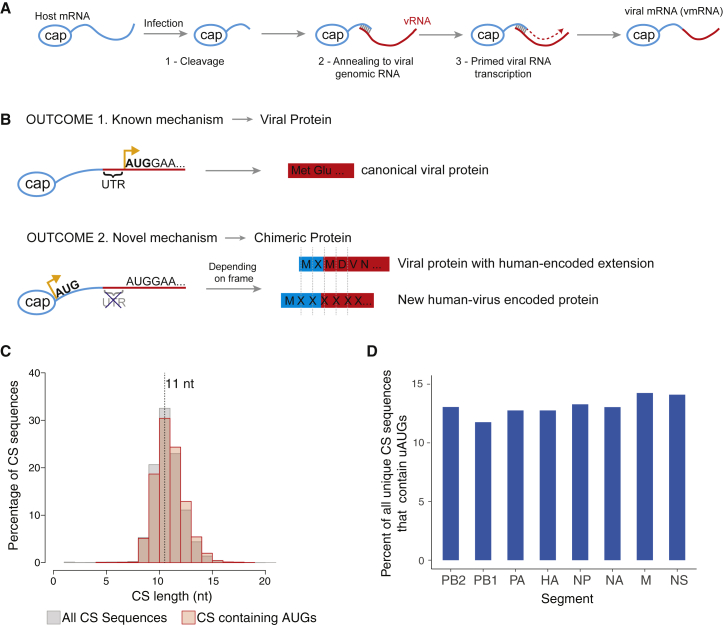
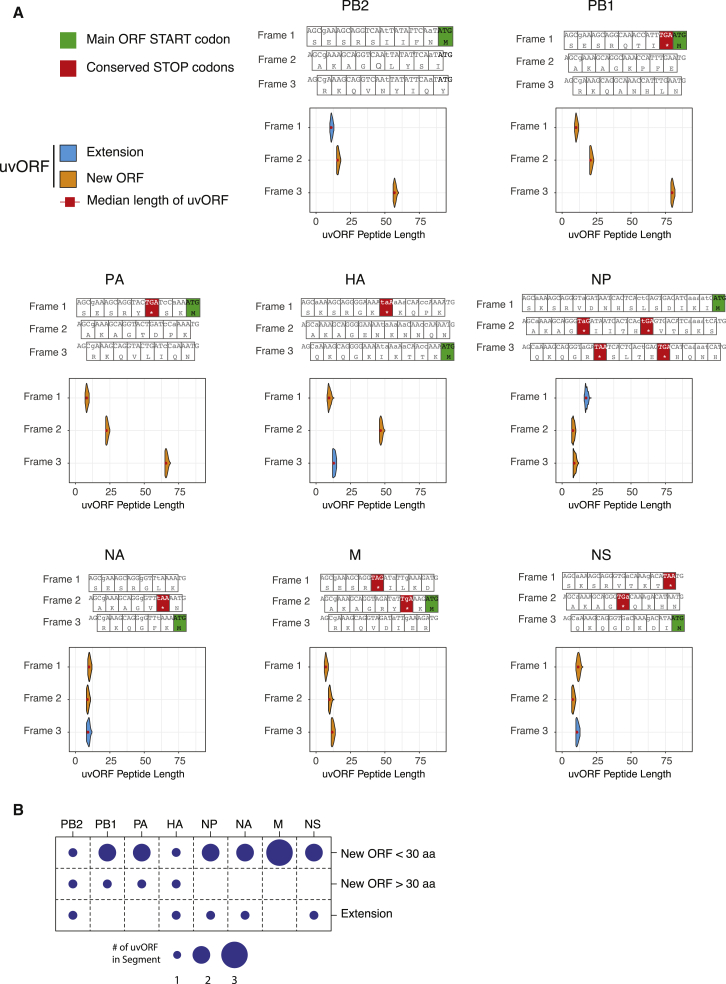
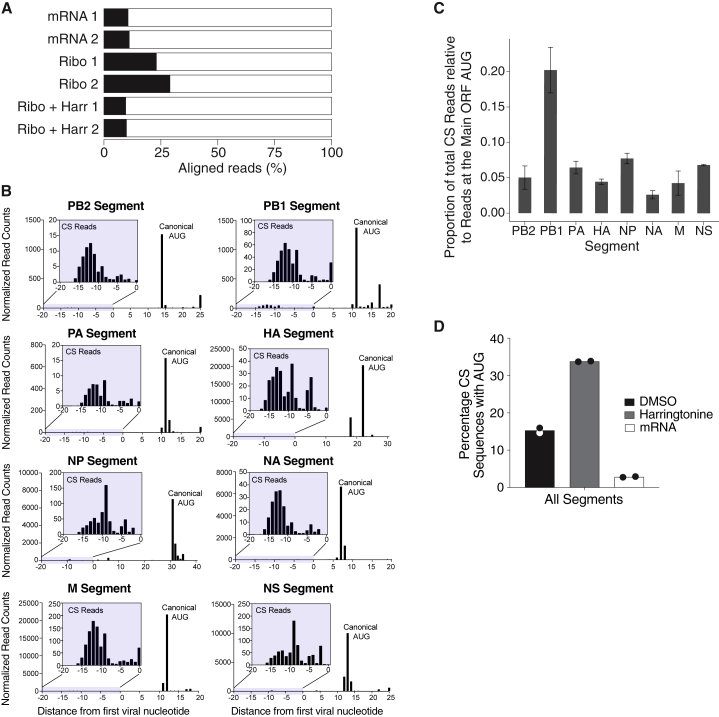
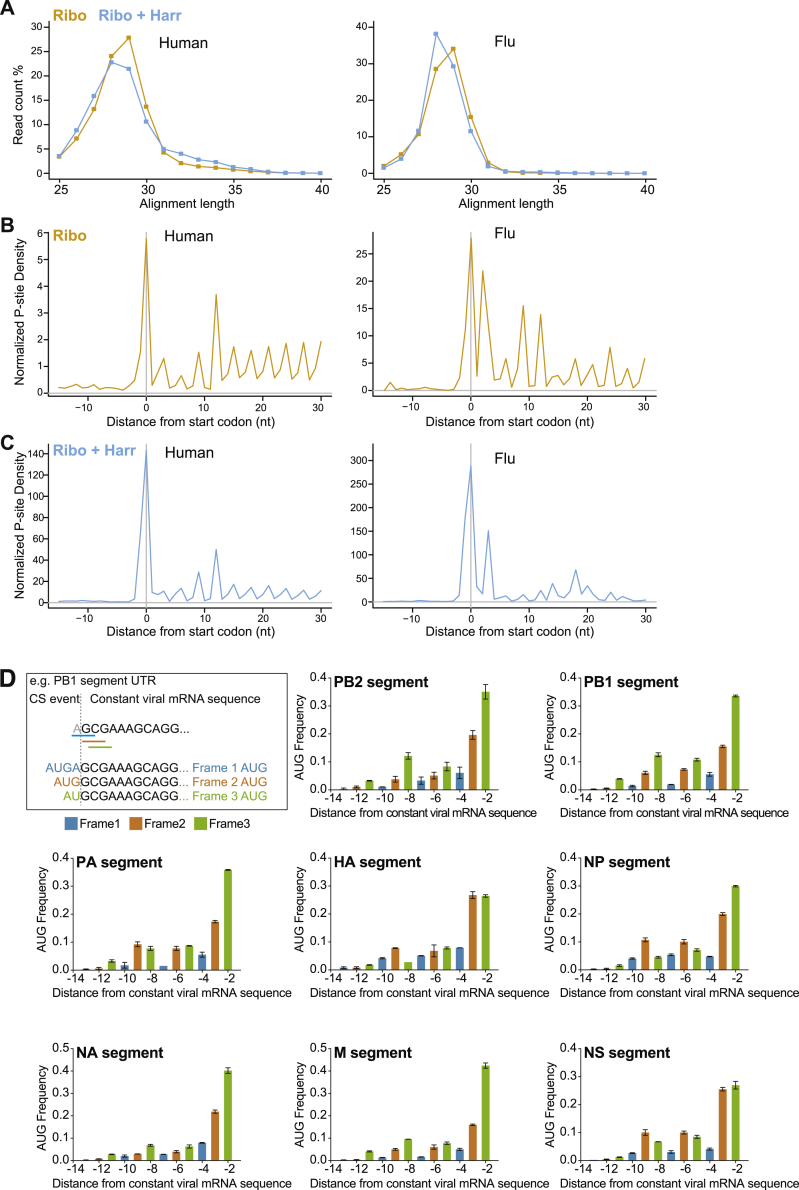
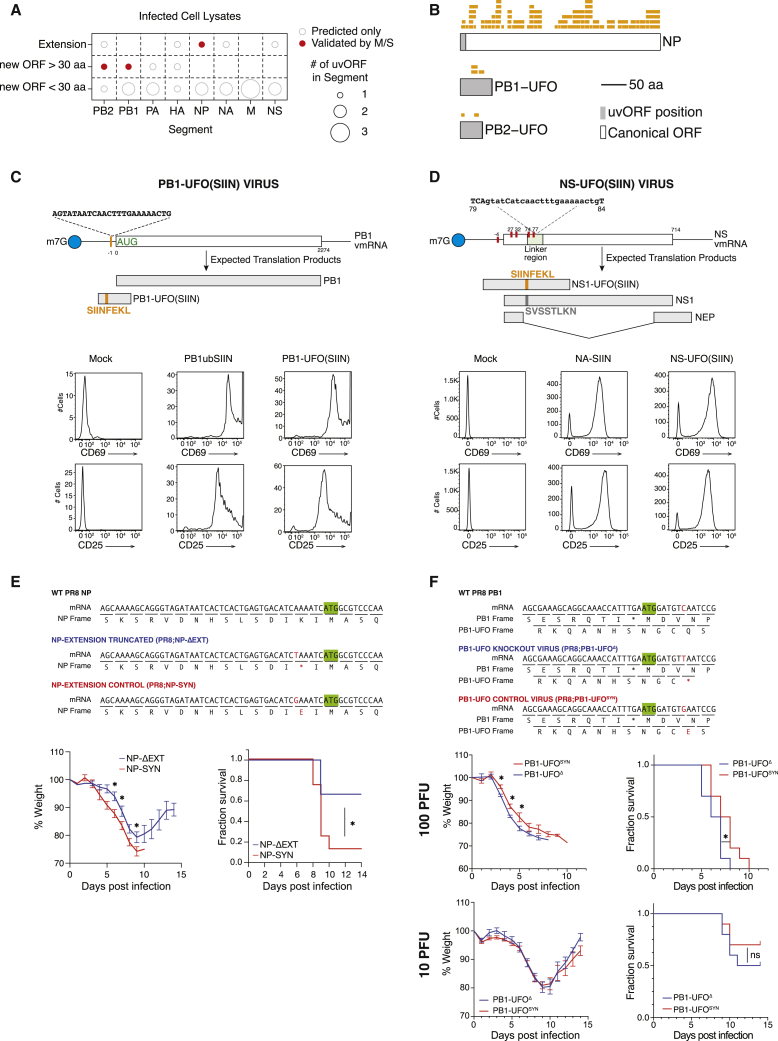
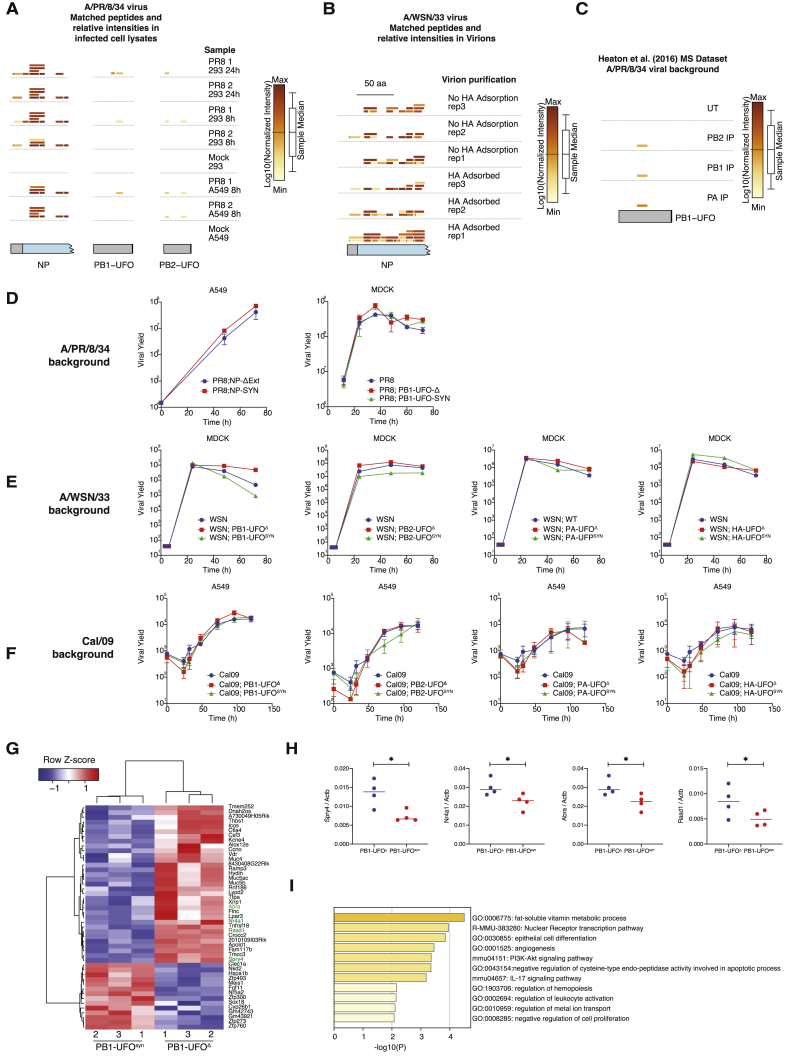
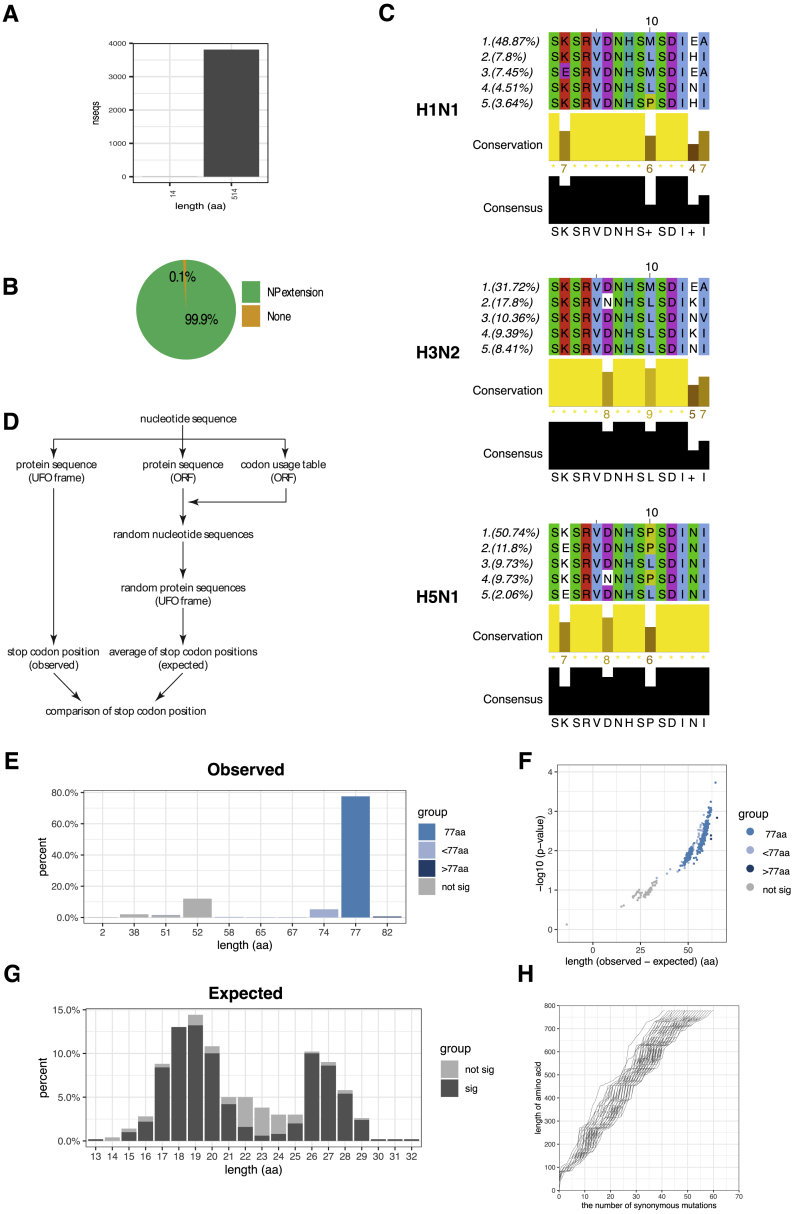
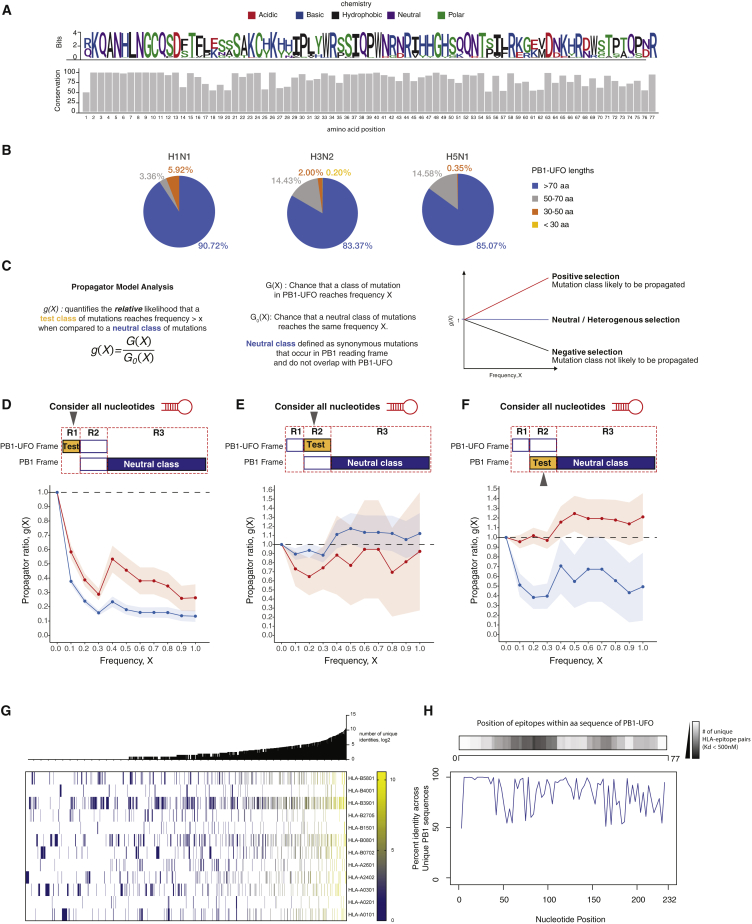
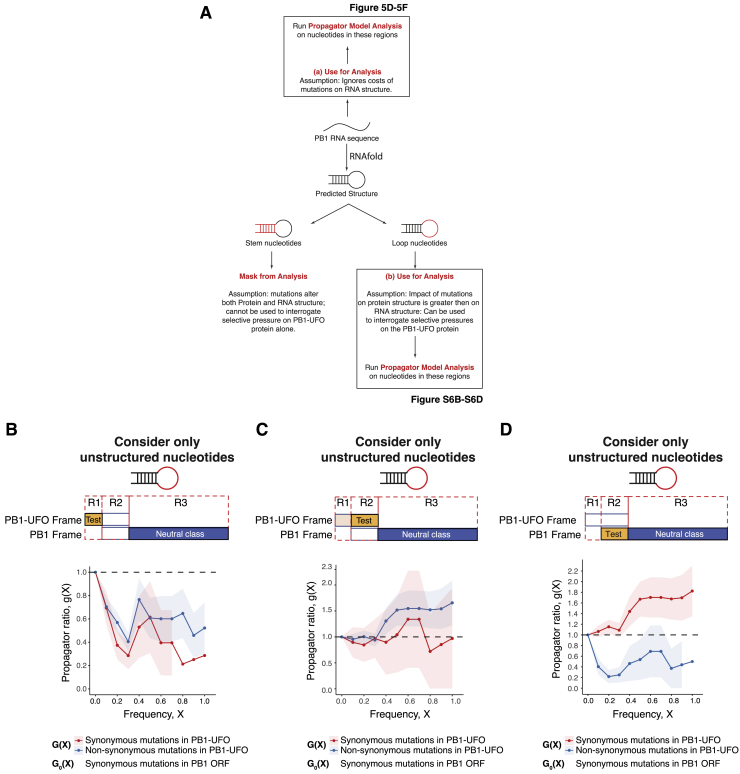
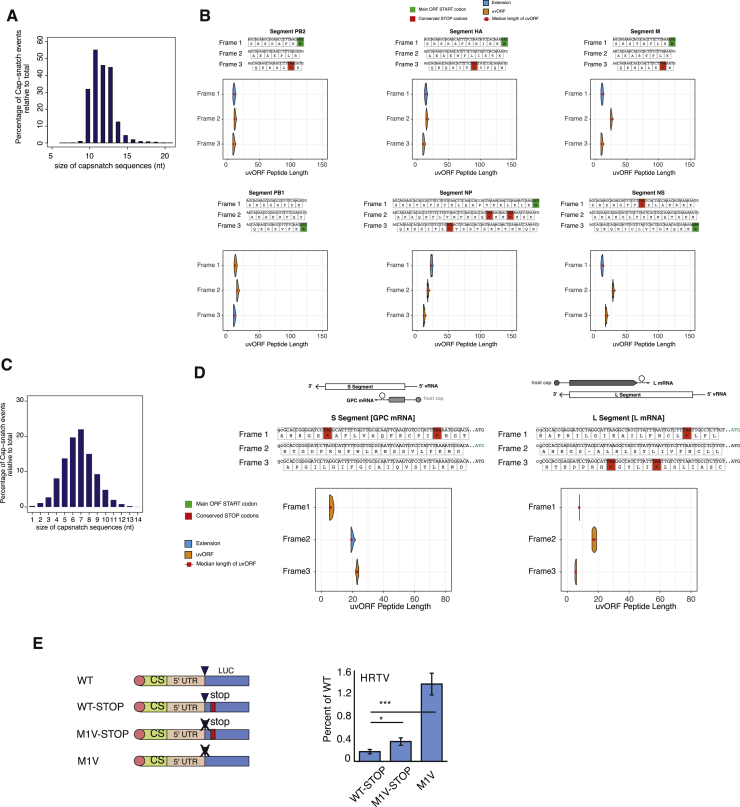
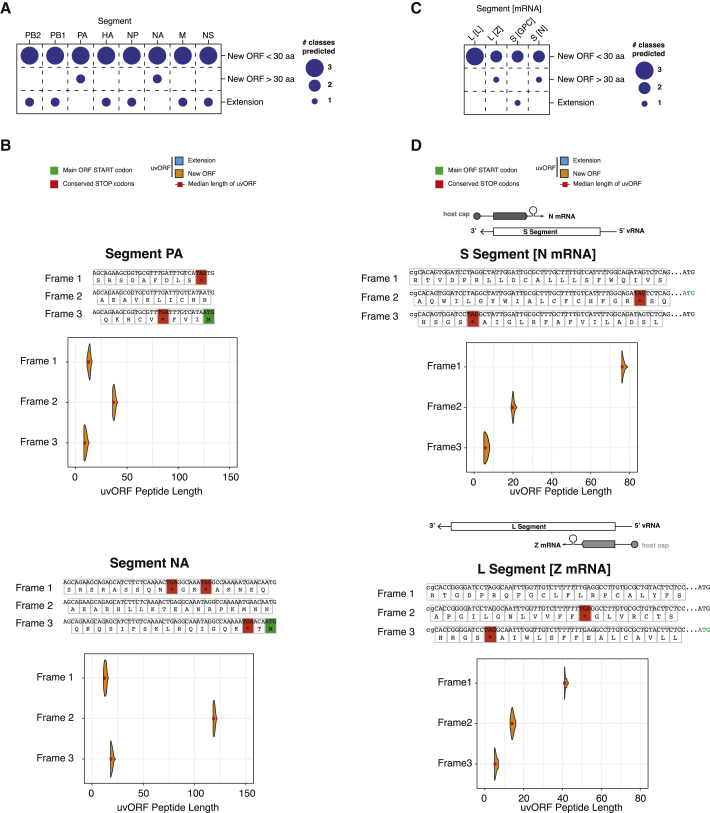
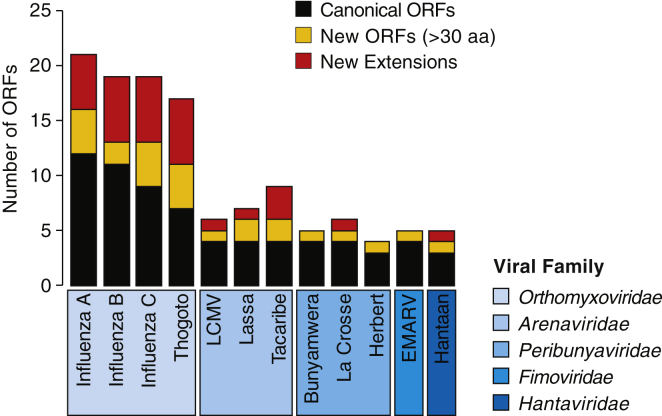
RNA viruses are a major human health threat. The life cycles of many highly pathogenic RNA viruses like influenza A virus (IAV) and Lassa virus depends on host mRNA, because viral polymerases cleave 5'-m7G-capped host transcripts to prime viral mRNA synthesis ("cap-snatching"). We hypothesized that start codons within cap-snatched host transcripts could generate chimeric human-viral mRNAs with coding potential. We report the existence of this mechanism of gene origination, which we named "start-snatching." Depending on the reading frame, start-snatching allows the translation of host and viral "untranslated regions" (UTRs) to create N-terminally extended viral proteins or entirely novel polypeptides by genetic overprinting. We show that both types of chimeric proteins are made in IAV-infected cells, generate T cell responses, and contribute to virulence. Our results indicate that during infection with IAV, and likely a multitude of other human, animal and plant viruses, a host-dependent mechanism allows the genesis of hybrid genes.

Keywords: RNA hybrid; cap-snatching; chimeric proteins; gene origination; influenza; segmented negative-strand RNA viruses; uORFs; upstream AUG; viral RNA; viral evolution.


Conflict of interest statement

Declaration of Interests The authors declare no competing interests.

Figures

None
Graphical abstract
Figure 1
Figure 1
Upstream AUGs Are Present in Host-Derived Sequences of Viral mRNAs (A) Schematic of cap-snatching during the transcription of a segmented negative sense RNA virus (sNSV) such as influenza A virus (IAV). (B) Schematic showing how the presence of upstream AUGs (uAUGs) in host-derived cap-snatched RNA sequences may drive the formation of novel host-viral chimeric proteins. (C) Histograms showing the length distributions of all cap-snatched (CS) sequences (gray bars) or only CS sequences containing uAUGs (red bars) in A549 cells infected with IAV (strain PR8) for 4 h, as determined by DEFEND-seq. (D) Bar plots showing the percentages of uAUG containing CS sequences in each IAV genome segment.
Figure S1
Figure S1
uAUGs Are Present in Viral mRNAs, Related to Figure 1 (A) Incorporation of host transcript sequences increases the diversity of putative alternative start codons. For each viral genome segment, the frequency and position of alternative start codons is shown relative to native start of the viral genes. For each reading frame, the frequency and location of the first in-frame stop codon are indicated. (B) Percentages of cap-snatched sequences that contain AUG codons, as identified by CAGE. Data are shown relative to all the viral reads from the specified genome segments.
Figure S2
Figure S2
Viral 5′ UTRs Are Conserved, Related to Figure 2 Multiple sequence alignments of unique H1N1 IAV 5′UTRs per genome segment (n = 10904). The overall distribution of each unique nucleotide sequence is indicated on the left, and the consensus sequence of each UTR is indicated below each alignment. The top panels show the positional weight matrix of each nucleotide across the UTRs.
Figure 2
Figure 2
IAV 5′ UTRs Are Conserved and Translatable (A) Sequence analysis of all unique 5′ UTR sequences from each segment of 10,904 H1N1 subtype IAV genomes (coding sense), showing (upper panels) the translation of the 5′ UTR in all three reading frames; and (lower panels) the predicted amino acid length (aa) distributions of N-terminal extensions to the major gene product and of overprinted new ORFs. This is calculated from the distribution of uAUG positions in DEFEND-seq data and (for overprinted new ORFs) from the position of stop codons in the IAV PR8. (B) The numbers of translatable products that could be accessed from uAUGs in each genome segment of IAV.
Figure 3
Figure 3
IAV mRNAs Can Be Translated from Host-Derived AUGs (A) Proportion of reads that align to viral and human transcripts for the indicated experimental conditions. (B) 5′ end mapping of ribosome protected fragments (RPFs) in harringtonine-treated A549 cells infected with the IAV PR8 at 8 h post-infection, showing for each segment of the IAV genome the distribution of reads in the cap-snatched regions (shown in insets) and virally encoded mRNA up to 10 nt after the canonical start codon. The x axis is shown relative to the first virally encoded nucleotide. (C) For each IAV genome segment, the number of ribosome-protected fragments (RPFs) upstream of the canonical AUG as a proportion of those mapping to the canonical AUG is shown. Data are shown as the mean ± SD. (D) Barplots showing the percentages of RPFs that contain an AUG when cells were treated with DMSO (black bars) or harringtonine (gray bars) immediately prior to harvest, or from total mRNA-seq (white bars). Results from two sequencing replicates are shown as points, with bars showing the mean.
Figure S3
Figure S3
IAV mRNAs Can Be Translated from Host-Derived AUGs, Related to Figure 3 (A) Length distribution of ribosome profiling reads that aligned to human (left panel) and viral (right panel) transcripts in DMSO (Ribo) or harringtonine (Ribo + Harr) treated samples. (B) Metagene alignment of average P site density around annotated start codons in human (left panel) or viral (right panel) transcripts in DMSO treated samples. (C) Metagene alignment of average P site density around annotated start codons in human (left panel) or viral (right panel) transcripts in harringtonine treated samples. (D) Frequency of AUG codons by position relative to the viral transcription initiation site. Bars show the mean frequency and are color coded according to frame. Error bars indicate the standard deviation.
Figure 4
Figure 4
uvORFs Are Expressed during Infection and Can Contribute to Virulence (A) The number of upstream viral open reading frames (uvORFs) that could be translated for each segment of the IAV genome (empty circles), highlighting those detected in infected cell lysates by mass spectrometry (filled red circles). (B) Tryptic peptides that map to translated uvORFs, detected by mass spectrometry across multiple experiments (summarizing data in Figures S4A and S4C). (C) Schematic showing the generation of the PB1-UFO(SIIN) virus. DC2.4 cells were infected with the indicated viruses and co-cultured with OT-I CD8+ T cells. OT-1 activation, assessed by CD69 and CD25 expression, was assayed by flow cytometry at 24 h post co-culture. vmRNA, viral mRNA. (D) Schematic showing the generation of the NS-SIIN virus. Red bars indicate stop codons mutated to permit uninterrupted NS1-UFO translation. Mouse BMDC cells were incubated with IAV antigen presentations, and co-cultured with OT1-CD8+ T cells. OT-I activation, assessed by CD69 and CD25 expression, was assayed by flow cytometry of CD69 and CD25 expression at 24 h post co-culture. (E) Upper panel: schematic showing mutations that truncate NP-ext (NP-ΔEXT) and control mutations (NP-SYN), as engineered into the IAV PR8. Wild-type PR8 is also shown. Lower panel: weight loss and survival curves of 6- to 8-week-old BALB/c mice infected with 15 plaque-forming unit (PFU)/mouse of the indicated viruses. Data are an aggregate of 2 independent experiments of n = 3 mice, using 2 independently plaque purified clones of the NP-ΔEXT or PR8;NP-SYN viruses (total n = 6/condition). p < 0.05; data are shown as the mean ± SEM. (F) Upper panel: schematic showing mutations that knocked out PB1-UFO (PB1-UFOΔ) and control mutations (PB1-UFOSYN), as engineered into the IAV PR8. Wild-type PR8 is also shown. Lower panel: weight loss and survival curves of 6- to 8-week-old BALB/c mice infected with the indicated dose (per mouse) of the indicated viruses. n = 10 mice/condition. p < 0.05. Data are shown as the mean ± SEM.
Figure S4
Figure S4
uvORFs Are Expressed during Infection and Can Contribute to Virulence, Related to Figure 4 (A) Plots showing the position of uvORF peptides found in lysates of cells (A549 or 293) infected with A/PR/8/34 virus at 8 or 24h post infection. The specific cell lysates they were found in are indicated on the right. 1: MG132 treated, 2: DMSO treated. Peptide locations are drawn relative to uvORFs (gray regions) and canonical ORFs (blue regions) and are colored by the log10 of their intensities, relative to the sample median. (B) Same as in (A), but for uvORF peptides found within purified A/WSN/33 virions. (C) Same as in (A), but for uvORF peptides found from an independent, previously published dataset. (D) In vitro growth curves of the indicated mutant (UFOΔ) and control (UFOSYN) viruses made in the PR8 background, and performed on MDCK cells. Error bars indicate the standard deviation of 3 replicates. (E) In vitro growth curves of the indicated mutant (UFOΔ) and control (UFOSYN) viruses made in the WSN/33 background, and performed on MDCK cells. (F) In vitro growth curves of the indicated mutant (UFOΔ) and control (UFOSYN) viruses made in the Cal/09 background, and performed on A549 cells. Error bars indicate the standard deviation of 3 replicates. (G) Heatmap of differentially expressed genes (Fold Change > 2, p < 0.01) found in the lungs of mice infected with 100PFU of either the PR8;PB1-UFOΔ or PR8;PB1-UFOSYN viruses at day 6 post infection. (H) qPCR validation of four significantly changed genes identified in (G) (highlighted with green text). Each dot represents the lung of one mouse infected with 100PFU of the indicated viruses, collected at day 6 post infection. P values were calculated through a one tailed t test. p < 0.05 (I) Gene ontology analysis of genes shown in (G).
Figure S5
Figure S5
uvORFs Are Conserved, Related to Figure 5 (A) Bar plot showing the number of unique NP sequences that give rise to the full length, extended NP protein of ∼514aa, or those that result in truncated (non-extended) uvORFs. (B) Percentages of unique NP sequences that preserve the propensity to code for NP-extension. (C) Top five most common NP extension protein sequences in three types of influenza A strains, H1N1, H3N2 and H5N1. (D) Schematic showing the model used to calculate the expected versus observed PB1-UFO sequence lengths. (E) Density plot of predicted length of H3N2 PB1-UFO protein sequences. Sequences predicted to generate a protein of 77aa are shown in medium blue, shorter than 77aa in light blue, and those longer than 77aa are in dark blue. Sequences predicted not to generate PB1-UFO protein are shown in gray. (F) P value distribution/volcano plot of H3N2 PB1-UFO protein sequence length. Each dot represents the difference between observed length and expected length of each individual sequence. (G) Density plot showing the distribution of expected lengths of H3N2 PB1-UFO proteins, based on random codon-shuffled sequences. (H) Line plot showing the number of synonymous mutations in frame of WT H3N2 PB1 (x axis) that are required to generate stop codons in frame of H3N2 PB1-UFO (y axis).
Figure 5
Figure 5
uvORFs Are Conserved (A) Conservation analysis of PB1-UFO protein sequences across all IAV subtypes. (B) Pie charts showing percentages of sequences in H1N1, H3N2, and H5N1 IAV subtypes that have a PB1-UFO that is 77 aa long (blue), 50–77 aa long (gray), 30–50 aa long (orange), and <30 aa long (yellow). (C) Outline of the propagator model analysis. Diagrams describe possible outcomes and interpretations of calculated g(x) ratios (D) Frequency propagator ratios of the indicated classes of mutations occurring in PB1-UFO relative to the PB1 open reading frame of H3N2 viruses. Top: regions used for the test (G(x); yellow), and neutral class (G0(X); blue) ratios are shown. The test class is the region of PB1-UFO ORF that overlaps only with the viral 5′ UTR; the neutral class consists of synonymous mutations in the PB1 ORF that do not overlap with PB1-UFO. All nucleotides positions were considered. Error bars indicate sampling uncertainties. See also Figure 5C for interpretations (E) Frequency propagator ratios, as in (D), but with the test class comprising the C-terminal region of the PB1-UFO ORF. (F) Frequency propagator ratios, as in (D), but with the test class comprising the region in the main PB1 ORF overlapping the PB1-UFO reading frame. (G) Number of predicted PB1-UFO epitope-allele interactions for frequent 11 human HLA alleles. Heatmaps show number of PB1-UFO epitopes derived from all possible unique identities and predicted to bind selected MHC-I alleles. Number of unique identities (i.e., unique influenza A virus sequences) encoding predicted epitopes are shown in histograms, next to the heatmaps. (H) Locations of PB1-UFO peptides that are predicted to result in strong (Kd <500 nM) unique interacting HLA-epitope pairs across the PB1-UFO reading frame. This plot is juxtaposed with percent identity plot of PB1-UFO (lower panel) across 3,140 unique PB1-UFO sequences taken from the NCBI Influenza Database (Zhang et al., 2017).
Figure S6
Figure S6
Controls Related to Propagator Analysis, Related to Figures 5C–5F (A) Schematic of analysis steps taken to quantify selection occurring on synonymous and non-synonymous mutations in the PB1-UFO ORF. Propagator model analyses were done by either not taking (Figure 5B and 5D) or taking the RNA structure of IAV PB1 segment into account (Figures 5C–5E). (B) Frequency propagator ratios of the indicated classes of mutations occurring in PB1-UFO relative to the PB1 open reading frame of H3N2 viruses. The region used to calculate the test class ratio (G(X)) is indicated in yellow, and the region used to calculate the neutral class ratio (G0(X)) is indicated in blue in the top schematic. Here, the test class is the region of the PB1-UFO ORF that overlaps only with the virally-encoded 5′UTR; the neutral class consists of synonymous mutations in the PB1 ORF that do not overlap with PB1-UFO. Only nucleotides within predicted loop regions (i.e., non-pairing) positions were considered. Error bars indicate sampling uncertainties. g(x)<1: negative selection, g(x)1: weak/heterogeneous selection; g(x)>1: positive selection; see also Figure 5C) (C) Frequency propagator ratios, as in (B), but with the test class comprising the C-terminal region of the PB1-UFO ORF. (D) Frequency propagator ratios, as in (B), but with the test class comprising the region in the main PB1 ORF overlapping the PB1-UFO reading frame.
Figure S7
Figure S7
DEFEND-Seq and CAGE Analysis of Other Cap-Snatching Viruses, Related to Figure 6 (A) Distribution of lengths for cap-snatched sequences found in IBV, as determined by DEFEND-seq. (B) Host derived uAUGs give rise to long uvORFs (> 30aa). (Upper panels) Predicted peptide sequences derived upon translation of all three ribosome reading frames in the indicated IBV genome segments. (Lower panels) Predicted distribution of the lengths of new ORF and extension peptides generated from each reading frame of the viral 5′UTR. Peptide lengths are calculated based on AUG positions obtained through DEFEND-sequencing. (C) Distribution of lengths for cap-snatched sequences found in LASV infected cells, as determined by CAGE-seq. (D) Host derived uAUGs enable reverse sense genome segments of Lassa virus L and S to give rise to uvORFs and extensions. (Upper panels) Schematic of proteins encoded in the indicated reading frames in either the L or S segment. Lassa virus RNA is ambisense. (Middle panels) Predicted peptide sequences derived upon translation of all three reading frames in the reverse sense L and S segments. (Lower panels) Predicted distribution of the lengths of new ORFs and extension peptides generated from each reading frame of the viral 5′UTR. Peptide lengths are calculated based on AUG positions obtained through CAGE. (E) (Left panels) Schematic showing (in coding sense) the 5′ termini of viral reporter RNAs, in which a viral untranslated region (UTR) flanks a luciferase (Luc) reporter gene. Reporter RNAs were used to assess upstream translation in the mRNAs of Heartland virus (HRTV). The 5′ terminus of the mRNAs consisted of cap-snatched sequence from host mRNAs (cap), followed by a viral 5′ UTR (5′ UTR) and the reporter gene (Luc). Cap structures are indicated as circles, the most N-terminal AUG as a triangle, AUG mutations as crosses and stop codons as lines. (Right panels) Luc expression when these reporters were included in minireplicon assays, as a percentage of expression with the WT construct, showing the means and s.d. of 3 repeats compared to WT-STOP by Student’s 2-tailed t test (n.s.: p ≥ 0.05, p < 0.05, ∗∗∗p ≤ 0.0005).
Figure 6
Figure 6
uvORFs Are Encoded by Cap-Snatching Viruses from Diverse Families (A) The number of host-virus chimeric protein species potentially encoded by influenza B virus (IBV; B/Wisconsin/01/2010). (B) Sequence analysis of the PA and NA segments of IBV, showing the translation of the 5′ UTR in all three reading frames and the predicted length distributions of N-terminal extensions to the main ORF and of overprinted new ORFs, calculated from uAUG positions in DEFEND-seq data. (C) The number of host-virus chimeric protein species potentially encoded by the ambisense genome of Lassa virus (LASV; Josiah strain), in both forward and reverse senses. The ORF encoded by the segment is indicated in the square brackets. (D) Sequence analysis of L and S segments of LASV in the indicated orientations, showing a schematic of genome organization, the translation of the 5′ UTR in all three reading frames, and the predicted length distributions of overprinted new ORFs, calculated from uAUG positions in CAGE-seq data.
Figure 7
Figure 7
Start-Snatching Increases the Number of Potential ORFs in sNSVs The increase in number of potential ORFs in cap-snatching viruses when uvORFs are considered. Black, number of canonical ORFs; yellow, number of new overprinted ORFs >30 aa; red, number of new extensions. LCMV, lymphocytic choriomeningitis virus; EMARV, European mountain ash ringspot-associated emaravirus.

Comment in

References

    1. Andreatta M., Nielsen M. Gapped sequence alignment using artificial neural networks: application to the MHC class I system. Bioinformatics. 2016;32:511–517. - PMC - PubMed
    1. Andreev D.E., O’Connor P.B., Fahey C., Kenny E.M., Terenin I.M., Dmitriev S.E., Cormican P., Morris D.W., Shatsky I.N., Baranov P.V. Translation of 5′ leaders is pervasive in genes resistant to eIF2 repression. eLife. 2015;4:e03971. - PMC - PubMed
    1. Andrews S.J., Rothnagel J.A. Emerging evidence for functional peptides encoded by short open reading frames. Nat. Rev. Genet. 2014;15:193–204. - PubMed
    1. Bottermann M., Foss S., van Tienen L.M., Vaysburd M., Cruickshank J., O’Connell K., Clark J., Mayes K., Higginson K., Hirst J.C. TRIM21 mediates antibody inhibition of adenovirus-based gene delivery and vaccination. Proc. Natl. Acad. Sci. USA. 2018;115:10440–10445. - PMC - PubMed
    1. Buchholz U.J., Finke S., Conzelmann K.K. Generation of bovine respiratory syncytial virus (BRSV) from cDNA: BRSV NS2 is not essential for virus replication in tissue culture, and the human RSV leader region acts as a functional BRSV genome promoter. J. Virol. 1999;73:251–259. - PMC - PubMed

Publication types

MeSH terms