Multicenter Study
. 2020 Jul;8(7):594-605.
doi: 10.1016/S2213-8587(20)30153-4.

Disease characteristics of MCT8 deficiency: an international, retrospective, multicentre cohort study

Stefan Groeneweg  1 Ferdy S van Geest  1 Ayhan Abacı  2 Alberto Alcantud  3 Gautem P Ambegaonkar  4 Christine M Armour  5 Priyanka Bakhtiani  6 Diana Barca  7 Enrico S Bertini  8 Ingrid M van Beynum  9 Nicola Brunetti-Pierri  10 Marianna Bugiani  11 Marco Cappa  12 Gerarda Cappuccio  10 Barbara Castellotti  13 Claudia Castiglioni  14 Krishna Chatterjee  15 Irenaeus F M de Coo  16 Régis Coutant  17 Dana Craiu  7 Patricia Crock  18 Christian DeGoede  19 Korcan Demir  2 Alice Dica  7 Paul Dimitri  20 Anna Dolcetta-Capuzzo  21 Marjolein H G Dremmen  22 Rachana Dubey  23 Anina Enderli  24 Jan Fairchild  25 Jonathan Gallichan  26 Belinda George  27 Evelien F Gevers  28 Annette Hackenberg  24 Zita Halász  29 Bianka Heinrich  24 Tony Huynh  30 Anna Kłosowska  31 Marjo S van der Knaap  32 Marieke M van der Knoop  16 Daniel Konrad  33 David A Koolen  34 Heiko Krude  35 Amy Lawson-Yuen  36 Jan Lebl  37 Michaela Linder-Lucht  38 Cláudia F Lorea  39 Charles M Lourenço  40 Roelineke J Lunsing  41 Greta Lyons  15 Jana Malikova  37 Edna E Mancilla  42 Anne McGowan  15 Veronica Mericq  43 Felipe M Lora  44 Carla Moran  15 Katalin E Müller  45 Isabelle Oliver-Petit  46 Laura Paone  12 Praveen G Paul  47 Michel Polak  48 Francesco Porta  49 Fabiano O Poswar  50 Christina Reinauer  51 Klara Rozenkova  37 Tuba S Menevse  52 Peter Simm  53 Anna Simon  47 Yogen Singh  54 Marco Spada  49 Jet van der Spek  34 Milou A M Stals  1 Athanasia Stoupa  48 Gopinath M Subramanian  18 Davide Tonduti  55 Serap Turan  52 Corstiaan A den Uil  56 Joel Vanderniet  18 Adri van der Walt  57 Jean-Louis Wémeau  58 Jolante Wierzba  31 Marie-Claire Y de Wit  16 Nicole I Wolf  32 Michael Wurm  59 Federica Zibordi  55 Amnon Zung  60 Nitash Zwaveling-Soonawala  61 W Edward Visser  62
Affiliations
Multicenter Study

Disease characteristics of MCT8 deficiency: an international, retrospective, multicentre cohort study

Stefan Groeneweg et al. Lancet Diabetes Endocrinol. 2020 Jul.

Erratum in

Abstract

Background: Disordered thyroid hormone transport, due to mutations in the SLC16A2 gene encoding monocarboxylate transporter 8 (MCT8), is characterised by intellectual and motor disability resulting from cerebral hypothyroidism and chronic peripheral thyrotoxicosis. We sought to systematically assess the phenotypic characteristics and natural history of patients with MCT8 deficiency.

Methods: We did an international, multicentre, cohort study, analysing retrospective data from Jan 1, 2003, to Dec 31, 2019, from patients with MCT8 deficiency followed up in 47 hospitals in 22 countries globally. The key inclusion criterion was genetically confirmed MCT8 deficiency. There were no exclusion criteria. Our primary objective was to analyse the overall survival of patients with MCT8 deficiency and document causes of death. We also compared survival between patients who did or did not attain full head control by age 1·5 years and between patients who were or were not underweight by age 1-3 years (defined as a bodyweight-for-age Z score <-2 SDs or <5th percentile according to WHO definition). Other objectives were to assess neurocognitive function and outcomes, and clinical parameters including anthropometric characteristics, biochemical markers, and neuroimaging findings.

Findings: Between Oct 14, 2014, and Jan 17, 2020, we enrolled 151 patients with 73 different MCT8 (SLC16A2) mutations. Median age at diagnosis was 24·0 months (IQR 12·0-60·0, range 0·0-744·0). 32 (21%) of 151 patients died; the main causes of mortality in these patients were pulmonary infection (six [19%]) and sudden death (six [19%]). Median overall survival was 35·0 years (95% CI 8·3-61·7). Individuals who did not attain head control by age 1·5 years had an increased risk of death compared with patients who did attain head control (hazard ratio [HR] 3·46, 95% CI 1·76-8·34; log-rank test p=0·0041). Patients who were underweight during age 1-3 years had an increased risk for death compared with patients who were of normal bodyweight at this age (HR 4·71, 95% CI 1·26-17·58, p=0·021). The few motor and cognitive abilities of patients did not improve with age, as evidenced by the absence of significant correlations between biological age and scores on the Gross Motor Function Measure-88 and Bayley Scales of Infant Development III. Tri-iodothyronine concentrations were above the age-specific upper limit in 96 (95%) of 101 patients and free thyroxine concentrations were below the age-specific lower limit in 94 (89%) of 106 patients. 59 (71%) of 83 patients were underweight. 25 (53%) of 47 patients had elevated systolic blood pressure above the 90th percentile, 34 (76%) of 45 patients had premature atrial contractions, and 20 (31%) of 64 had resting tachycardia. The most consistent MRI finding was a global delay in myelination, which occurred in 13 (100%) of 13 patients.

Interpretation: Our description of characteristics of MCT8 deficiency in a large patient cohort reveals poor survival with a high prevalence of treatable underlying risk factors, and provides knowledge that might inform clinical management and future evaluation of therapies.

Funding: Netherlands Organisation for Health Research and Development, and the Sherman Foundation.


Conflict of interest statement

Declaration of Interest

The Erasmus Medical Centre (Rotterdam, Netherlands), which employs SG, FSvG, IMvB, MD, MMvdK, CAU, MCYdW, and WEV, might receive royalties from Rare Thyroid Therapeutics (the manufacturer of Triac) in the future, dependent on any future commercialisation. None of the authors will benefit personally from any royalties. Rare Thyroid Therapeutics had no influence on the conduct or analysis of this study. All other authors declare no competing interests.

Figures
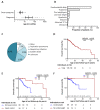
Figure 1
Figure 1
Panel A graphically presents the mean ± SEM (black lines) age at onset of symptoms and panel B the age at time of diagnosis. Grey dots represent measurements in individual patients. Panel C shows the causes of death in patient with MCT8 deficiency. HR: hazard ratio. Panel D shows the overall survival based on age at last follow-up (Kaplan-Meier estimates). Panel E shows the Kaplan-Meier estimates of MCT8-specific survival in patients who attained head control (red line) versus those who did not (blue line) and panel F those in patients with (blue line) versus without (red line) underweight.
Figure 2
Figure 2
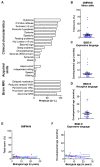
Panel A shows the prevalence of clinical, radiological and developmental key features in MCT8 deficiency. Bars indicate the proportion of patients presenting the indicated feature at first presentation. Panel B represents the gross motor function development in patients with MCT8 deficiency measured by the Gross Motor Function Measure (GMFM) 88 (15). A 100% score indicates the level of development that is achieved by a healthy 4-year old child. Panel C shows the development of expressive language and panel D the development of receptive language, measured by the respective sub-domains of the Bayley Scales of Infant Development (BSID) III (16). Scores are expressed as developmental age in months. Blue dots indicate measurements in individual patients and black lines indicate the mean ± SEM score. Panel E shows the relation between GMFM 88 score and panel F the developmental age on the sub-domain expressive language of the BSID III versus the chronological age using linear regression (the 95% CI is displayed as blue dotted lines). Only severely affected patients were considered in panel E and F. Linear regression was used to plot the trend and the 95% confidence intervals (blue lines). Patients harboring the same genetic mutation are displayed in the same color: p.F230del (green), c.651-652+20del (blue), G564R (purple), p.A565fs566X (pink), and R271H (orange). Unique mutations are colored in grey.
Figure 3
Figure 3
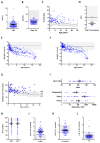
Mean ± SEM (black lines) serum concentrations of thyroid stimulating hormone (TSH) (panel A) and free T4 (panel B). Panel C presents the serum total T3 concentrations versus age. Panel D shows the available results on total T4 measurements during neonatal screening expressed in SDs. Blue dots represent measurements in individual patients and grey areas the normal range. Panel E shows the natural course of bodyweight change in patients with MCT8 deficiency. Blue dots represent available historical bodyweight measurements in untreated patients. Non-linear (third order) polynomial regression was used to plot the trend with its 95% error band. Similarly, panel F shows the natural course of body height. Panel G shows the resting heart rate by age. Normal range in healthy children is derived from (17). Panel H shows the mean ± SEM diastolic and systolic blood pressure. The orange line represents the threshold for classification as elevated blood pressure and the red line the threshold of hypertension, as defined by the guidelines from the American Academy of Pediatrics (18) and the American College of Cardiology and American Heart Association (19). Panel I shows the mean ± SEM (black lines) occurrence of indicated features during 24h cardiac monitoring in 45 individuals. Serum concentration of sex hormone binding globulin (SHBG) (panel J), creatinine (panel K), and creatine kinase (panel L) are expressed relative to the age-specific lower (panel K) or upper (panel J and L) limit of the normal range. Abbreviations: TSH, thyroid stimulating hormone; T4, thyroxine; T3, triiodothyronine; PACs, premature atrial contractions; PVCs premature ventricular contractions; CK, creatine kinase; SHBG, sex hormone binding globulin; LL, lower limit; UL, upper limit. The absolute mean values of all parameters are summarized in table s4.

Comment in

References

    1. Mullur R, Liu YY, Brent GA. Thyroid hormone regulation of metabolism. Physiol Rev. 2014;94(2):355–82. - PMC - PubMed
    1. Yen PM. Physiological and molecular basis of thyroid hormone action. Physiol Rev. 2001;81(3):1097–142. - PubMed
    1. Groeneweg S, van Geest FS, Peeters RP, Heuer H, Visser WE. Thyroid hormone transporters. Endocr Rev. 2019 - PubMed
    1. Heuer H, Maier MK, Iden S, Mittag J, Friesema EC, Visser TJ, et al. The monocarboxylate transporter 8 linked to human psychomotor retardation is highly expressed in thyroid hormonesensitive neuron populations. Endocrinology. 2005;146(4):1701–6. - PubMed
    1. Ceballos A, Belinchon MM, Sanchez-Mendoza E, Grijota-Martinez C, Dumitrescu AM, Refetoff S, et al. Importance of monocarboxylate transporter 8 for the blood-brain barrier-dependent availability of 3,5,3’-triiodo-L-thyronine. Endocrinology. 2009;150(5):2491–6. - PMC - PubMed

Publication types

MeSH terms