. 2020 Jul:76:21-28.
doi: 10.1016/j.parkreldis.2020.05.014. Epub 2020 May 11.

Arterial spin labeling detects perfusion patterns related to motor symptoms in Parkinson's disease

Affiliations

Arterial spin labeling detects perfusion patterns related to motor symptoms in Parkinson's disease

Swati Rane et al. Parkinsonism Relat Disord. 2020 Jul.

Abstract

Introduction: Imaging neurovascular disturbances in Parkinson's disease (PD) is an excellent measure of disease severity. Indeed, a disease-specific regional pattern of abnormal metabolism has been identified using positron emission tomography. Only a handful of studies, however, have applied perfusion MRI to detect this disease pattern. Our goal was to replicate the evaluation of a PD-related perfusion pattern using scaled subprofile modeling/principal component analysis (SSM-PCA).

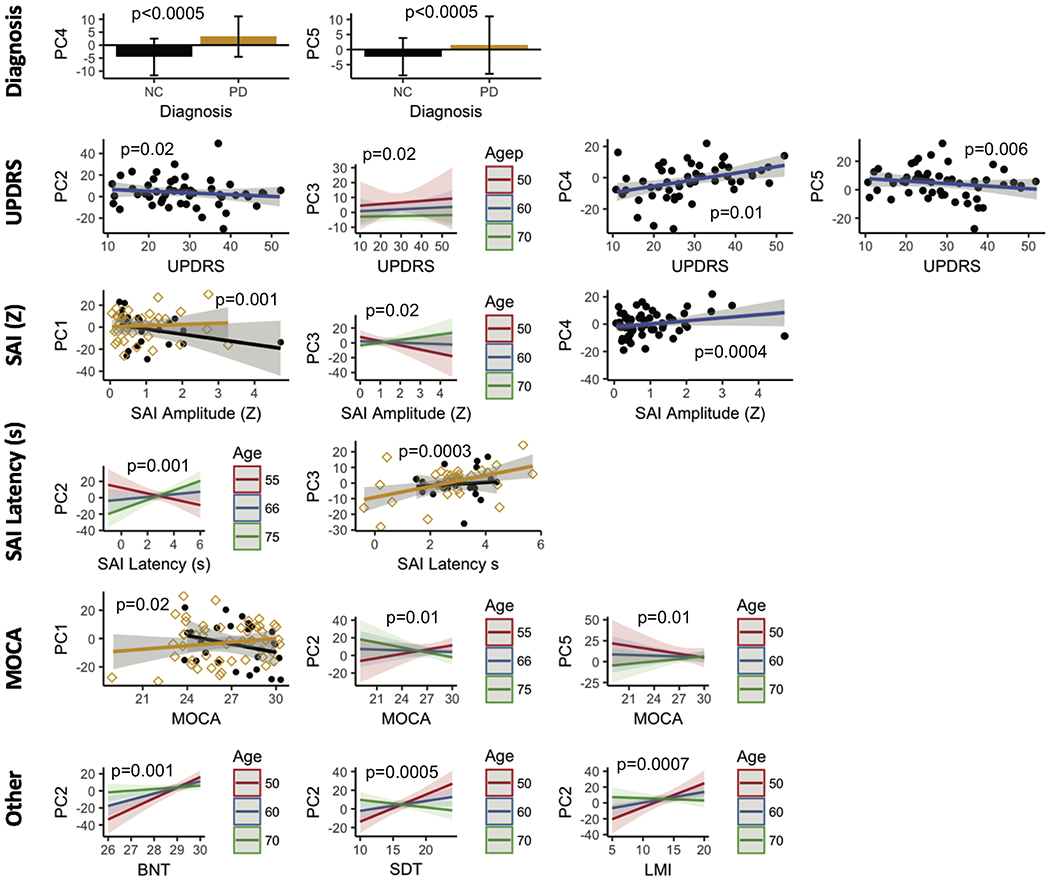
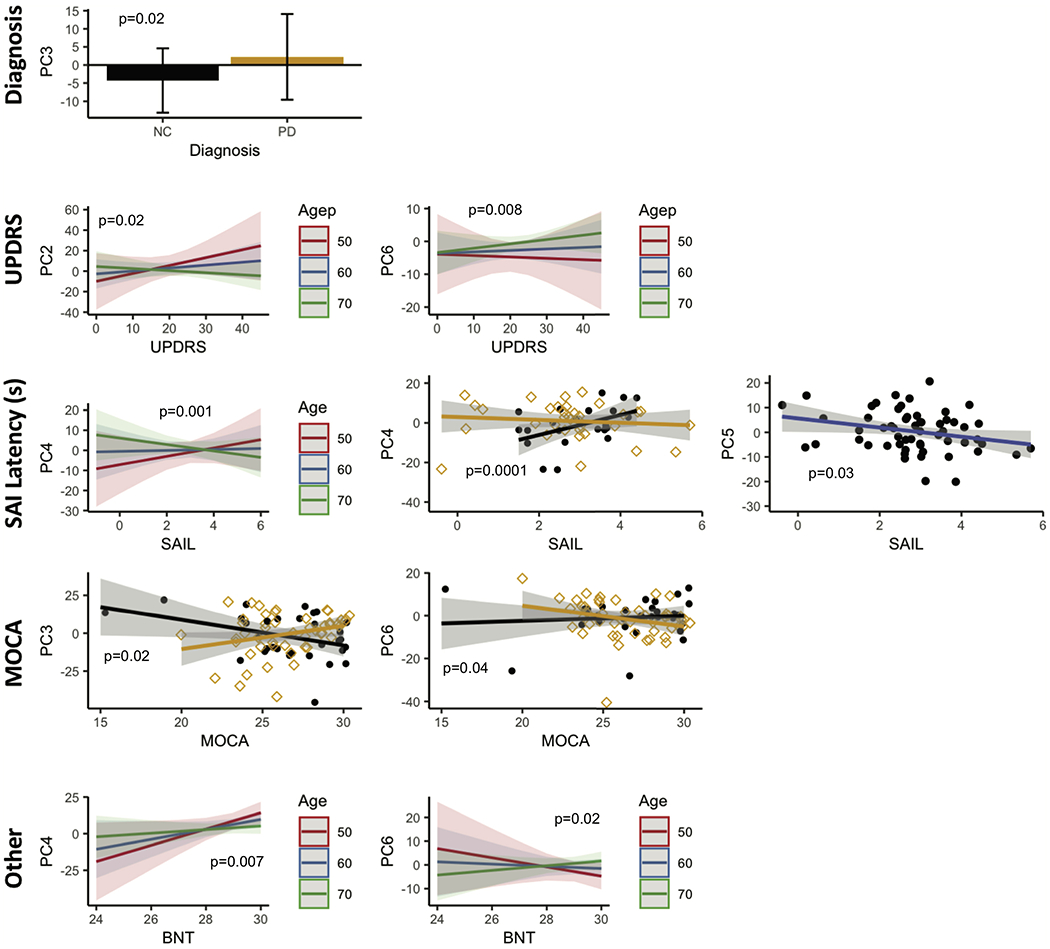
Methods: We applied arterial spin labeling (ASL) MRI for this purpose. Uniquely, we assessed this pattern separately in PD individuals ON and OFF dopamine medications. We further compared the existence of these patterns and their strength in each individual with their Movement Disorder Society-Unified Parkinson's Disease Rating Scale motor (MDS-UPDRS) scores, cholinergic tone as indexed by short-term afferent inhibition (SAI), and other neuropsychiatric tests.

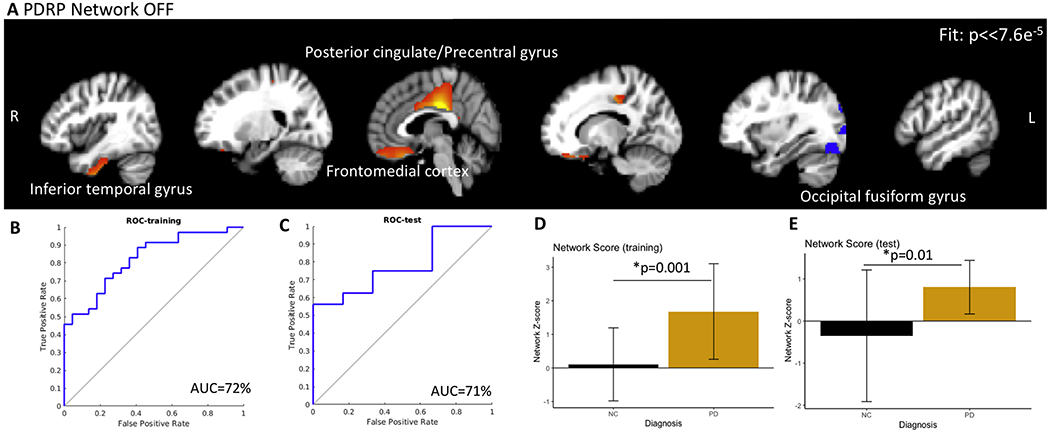
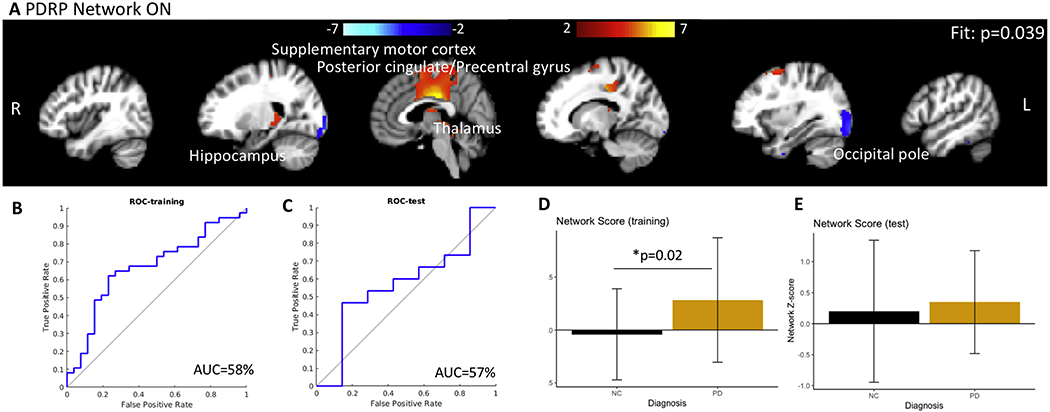
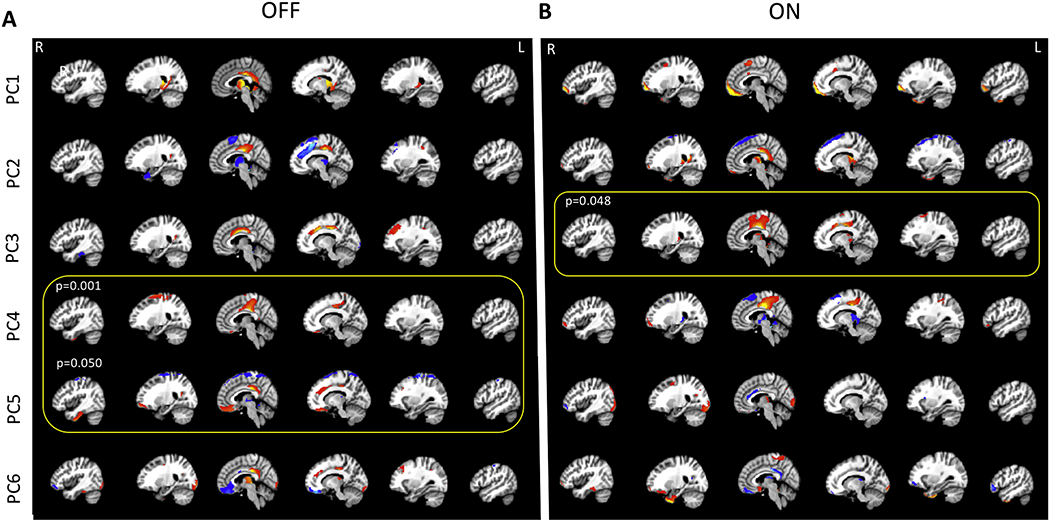
Results: We observed a PD-related perfusion pattern that was similar to previous studies. The patterns were observed in both ON and OFF states but only the pattern in the OFF condition could significantly (AUC=0.72) differentiate between PD and healthy subjects. In the ON condition, PD subjects were similar to controls from a CBF standpoint (AUC=0.45). The OFF pattern prominently included the posterior cingulate, precentral region, precuneus, and the subcallosal cortex. Individual principal components from the ON and OFF states were strongly associated with MDS-UPDRS scores, SAI amplitude and latency.

Conclusion: Using ASL, our study identified patterns of abnormal perfusion in PD and were associated with disease symptoms.

Keywords: Arterial spin labeling; PDRP; Parkinson's disease; UPDRS.


Conflict of interest statement

Financial Disclosure/Conflict of Interest: None

Figures

Figure 1.
Figure 1.
(A) The PDRP network in the OFF condition and PDRP-network Z-scores. Closer the score to zero, more normal the individual. The PDRP network consisted of posterior cingulate, precuneus, subcallosal cortex (medial frontal), and occipital cortex. (B, C) represents the ROC plots for the training and test sets for distinguishing PD participants OFF medication from controls (AUC = 72.2%) and for distinguishing PD participants ON medication from controls (AUC = 71.0%). The network Z scores for both sets are shown in D and E. The network scores were significantly different between controls and PD.
Figure 2.
Figure 2.
(A) The PDRP network in the ON condition and PDRP-network Z-scores. Closer the score to zero, more normal the individual. The PDRP network in the ON state comprised of posterior cingulate, precuneus, and occipital cortex. No sub callosal cortex (medial frontal region) was identified. The distinction between the PDRP network scores, although significant, is less prominent in the ON condition than in the OFF condition. (B, C) represents the ROC plots for the training and test sets for distinguishing PD participants OFF medication from controls (AUC = 57.4%) and for distinguishing PD participants ON medication from controls (AUC = 45.1%). The network Z scores for both sets are shown in D and E. The network scores were marginally significantly different between controls and PD only in the training set.
Figure 3.
Figure 3.
(A) The first six PCs explaining about 50% of the variability in the data comparing control participants to PD subject OFF dopaminergic medication and (B) ON medication. In the OFF condition, PC1, explaining 15.2% of the variance, comprised of posterior cingulate, precuneus, thalamus, caudate, and cerebellum. PC2 explained 10.5% of the variance and included posterior cingulate, superior frontal gyrus, and the supplementary motor cortex. PC3 (explained variance 7.4%) included posterior cingulate, anterior cingulate, L middle frontal gyrus, while PC 4 (explained variance = 5.9%) comprised of posterior cingulate, postcentral gyrus, precentral gyrus, superior frontal gyrus, frontomedial cortex/subcallosal cortex, L occipital cortex. PC5 and PC6 explained 5.7 and 4.6% of the variance. PC5 included posterior cingulate, superior frontal gyrus, frontomedial cortex/subcallosal cortex, precentral gyrus and supplementary motor cortex, and PC6 included posterior cingulate, cuneus, bilateral temporo-occipital regions. In the ON state, PC1, explaining 15.8% of the variance, comprised of the frontal pole, supplementary motors cortex, and parahippocampal gyrus. PC2 explained 12.8% of the variance and included frontal pole, thalamus, parahippocampal gyrus, and the posterior cingulate. PC3 (explained variance 7.4%) included posterior cingulate, precentral gyrus, supplementary motor cortex, while PC 4 (explained variance = 5.7%) comprised of posterior cingulate, R frontal pole, and thalamus. PC5 and PC6 explained 5.0 and 4.3% of the variance. PC5 included Thalamus and R occipital cortex. PC6 included postcentral gyrus, precentral gyrus, frontomedial cortex/subcallosal cortex, and temporo-occipital regions.
Figure 4.
Figure 4.
The PCs in the OFF condition were tested for association with diagnosis, MDS-UPDRS, SAI measures, and cognitive performance while adjusting for age and gender. PC 4 and PC 5 contributed to the PDRP network in the OFF state. PC 4 significantly (p<0.0005) discriminated controls form PD participants in the OFF condition. PC 5 was strongly associated with age (p=0.003). Lower PC 2 and PC 5 scores were associated with high MDS-UPDRs scores (PC 2, p= 0.02; PC5, p = 0.006). PC 4 showed the opposite trend (p =0.01 ). While high PC 3 scores were associated with high UPDRS scores, they decreased with age (p = 0.02 ). Higher PC 1 scores were associated with low SAI amplitude only in PD participants (p = 0.001). This relationship was observed for all participants for PC 3 but decreased with age (p = 0.02). Higher PC4 scores were associated with higher SAI amplitude (p = 0.0004). Lower PC 2 scores were associated with SAI latency, with this relationship reversing with increasing age (p = 0.0001). Lower PC 3 scores were associated with shorter latency times on SAI in controls only (p = 0.003 ). PC 1 showed opposite correlations with MOCA scores (p = 0.03). Higher PC 2 scores were associated with higher MOCA scores, but this relationship reversed with age(p = 0.01). The exact opposite behavior was observed with PC 5 (p = 0.01). BNT, SDT, and LMI scores were all positively correlated with PC 2. This correlation reduced or even reversed with age in all tests. (p-value; BNT = 0.001, SDT <0.0005, LMI = 0.0007).
Figure 5.
Figure 5.
The PCs in the ON condition were tested for association with diagnosis, MDS-UPDRS, SAI measures and cognitive performance while adjusting for age and gender. PC 3 scores were significantly different between controls and PD participants (p = 0.02). Higher UPDRs scores were associated with higher PC 2 scores. This correlation decreased with age ( p =0.02 ). On the other hand, PC 6 correlations to UPDRS scores increased with age (p = 0.008 ). High PC 4 scores were correlated with high latency time for SAI, especially in controls (p = 0.001 ), and this correlation decreased, even reversed with age (p = 0.0001). High PC 5 scores were correlated with shorter latency on SAI irrespective of diagnosis (p = 0.03). While PC 3 scores showed a negative correlation with MOCA scores in PD participants (p = 0.02), PC 6 showed similar trends in controls (p = 0.04). Higher BNT scores were associated with higher PC 4 scores (p = 0.007) and lower PC 6 scores (p = 0.02). Both relationships were modulated by age. Note that the neuropsychological battery was conducted only once in the ON condition within 6 months of the imaging.

Similar articles

Cited by

References

    1. Hammond C, Bergman H, Brown P, Pathological synchronization in Parkinson’s disease: networks, models and treatments, Trends Neurosci. 30 (2007) 357–364. - PubMed
    1. Burn DJ, Rowan EN, Allan LM, Molloy S, O’Brien JT, McKeith IG, Motor subtype and cognitive decline in Parkinson’s disease, Parkinson’s disease with dementia, and dementia with Lewy bodies, J. Neurol. Neurosurg. Psychiatry. 77 (2006) 585–589. 10.1136/jnnp.2005.081711. - DOI - PMC - PubMed
    1. Bohnen NI, Albin RL, The cholinergic system and Parkinson disease, Behav. Brain Res. 221 (2011) 564–573. 10.1016/j.bbr.2009.12.048. - DOI - PMC - PubMed
    1. Krimer LS, Iii ECM, Williams GV, Goldman-Rakic PS, Dopaminergic regulation of cerebral cortical microcirculation, Nat. Neurosci. 1 (1998) 286–289. 10.1038/1099. - DOI - PubMed
    1. Kim KJ, Diaz JR, Iddings JA, Filosa JA, Vasculo-Neuronal Coupling: Retrograde Vascular Communication to Brain Neurons, J. Neurosci. 36 (2016) 12624–12639. 10.1523/JNEUROSCI.1300-16.2016. - DOI - PMC - PubMed

Publication types