. 2020 Jun 16;12(6):556.
doi: 10.3390/pharmaceutics12060556.

A Mechanistic, Enantioselective, Physiologically Based Pharmacokinetic Model of Verapamil and Norverapamil, Built and Evaluated for Drug-Drug Interaction Studies

Affiliations

A Mechanistic, Enantioselective, Physiologically Based Pharmacokinetic Model of Verapamil and Norverapamil, Built and Evaluated for Drug-Drug Interaction Studies

Nina Hanke et al. Pharmaceutics. .

Abstract

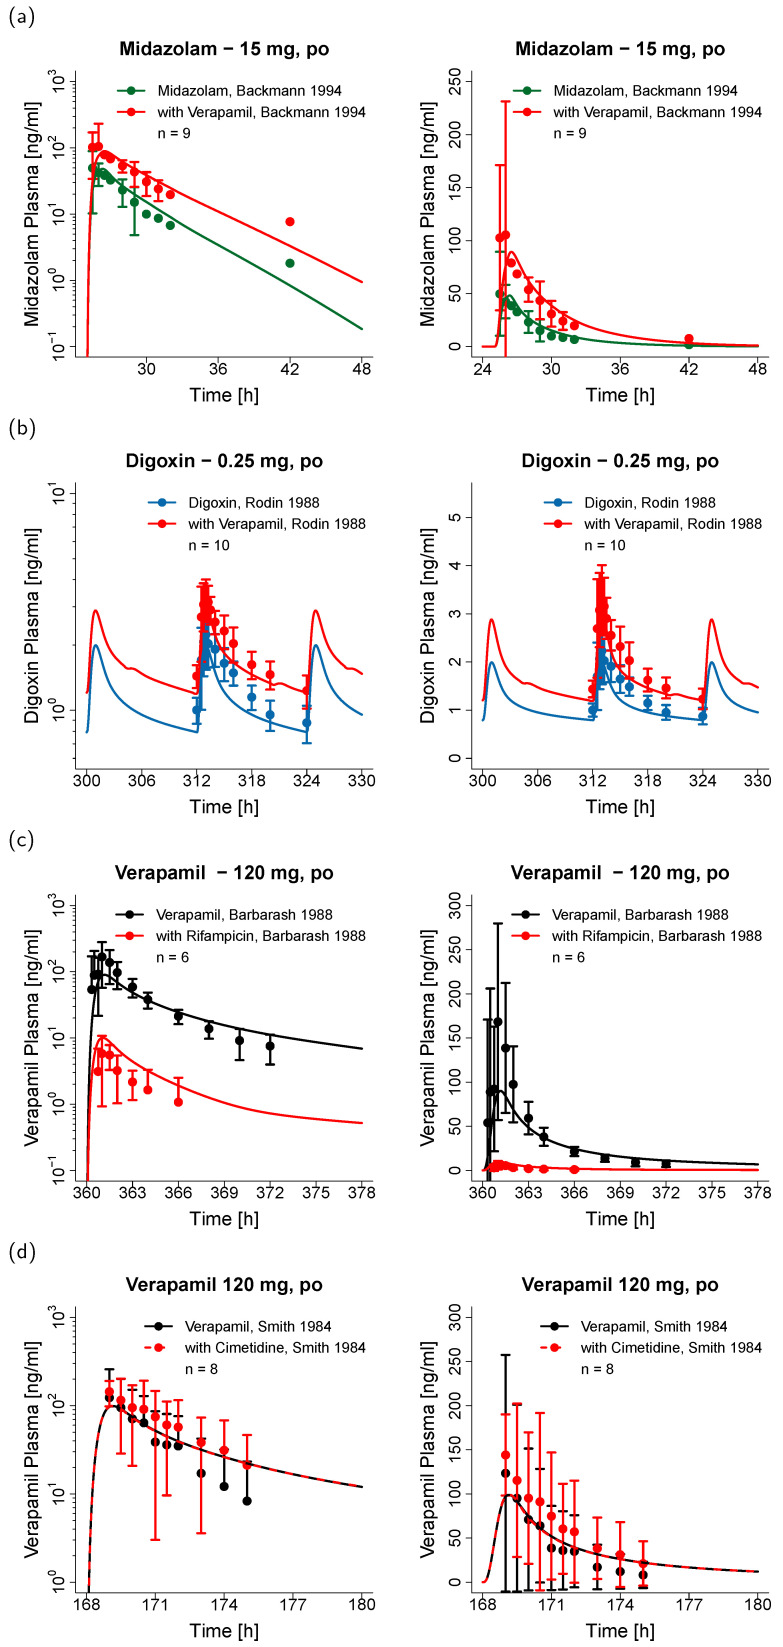
The calcium channel blocker and antiarrhythmic agent verapamil is recommended by the FDA for drug-drug interaction (DDI) studies as a moderate clinical CYP3A4 index inhibitor and as a clinical Pgp inhibitor. The purpose of the presented work was to develop a mechanistic whole-body physiologically based pharmacokinetic (PBPK) model to investigate and predict DDIs with verapamil. The model was established in PK-Sim®, using 45 clinical studies (dosing range 0.1-250 mg), including literature as well as unpublished Boehringer Ingelheim data. The verapamil R- and S-enantiomers and their main metabolites R- and S-norverapamil are represented in the model. The processes implemented to describe the pharmacokinetics of verapamil and norverapamil include enantioselective plasma protein binding, enantioselective metabolism by CYP3A4, non-stereospecific Pgp transport, and passive glomerular filtration. To describe the auto-inhibitory and DDI potential, mechanism-based inactivation of CYP3A4 and non-competitive inhibition of Pgp by the verapamil and norverapamil enantiomers were incorporated based on in vitro literature. The resulting DDI performance was demonstrated by prediction of DDIs with midazolam, digoxin, rifampicin, and cimetidine, with 21/22 predicted DDI AUC ratios or Ctrough ratios within 1.5-fold of the observed values. The thoroughly built and qualified model will be freely available in the Open Systems Pharmacology model repository to support model-informed drug discovery and development.

Keywords: P-glycoprotein (Pgp); cytochrome P450 3A4 (CYP3A4); drug–drug interactions (DDIs); mechanism-based inactivation (MBI); model-informed drug discovery and development (MID3); non-competitive inhibition; norverapamil; physiologically based pharmacokinetic (PBPK) modeling; verapamil.


Conflict of interest statement

Sabrina Wiebe, Éric Fernandez, Peter Stopfer, and Valerie Nock are employees of Boehringer Ingelheim Pharma GmbH & Co. KG. Thorsten Lehr has received research grants from Boehringer Ingelheim Pharma GmbH & Co. KG. and from the German Federal Ministry of Education and Research (grants 03XP0196 and 031L0161C). Nina Hanke, Denise Türk, and Dominik Selzer declare no conflict of interest. The funders had no role in the design of the study; in the collection, analyses, or interpretation of data; in the writing of the manuscript, or in the decision to publish the results.

Figures

Figure 1
Figure 1
Verapamil metabolism and CYP3A4 inactivation. R-verapamil, S-verapamil, R-norverapamil, and S-norverapamil are either metabolized by CYP3A4 or they destroy a CYP3A4 molecule in an irreversible mechanism-based inactivation, depleting the CYP3A4 pool until new enzyme is synthesized. R- and S-verapamil are metabolized via two different CYP3A4-mediated pathways: N-demethylation (to produce R- and S-norverapamil) or N-dealkylation. The metabolites that are not modeled as stand-alone compounds (D617 and D620) are assumed to be no inhibitors of CYP3A4 and Pgp according to literature reports [8,11].
Figure 2
Figure 2
Verapamil plasma concentrations. Model predictions of verapamil and norverapamil plasma concentration-time profiles of representative (ac) intravenous and (di) oral studies, compared to observed data [22,42,43,44,45,46,47,48]. Predictions are shown as lines, observed data are shown as dots ± SD. Black = total verapamil, grey = total norverapamil, orange = R-verapamil, yellow = R-norverapamil, green = S-verapamil, blue = S-norverapamil. Details on the study protocols and model predictions of the remaining studies used for model building and evaluation are provided in the Supplementary Materials. iv: intravenous, po: oral.
Figure 3
Figure 3
Goodness-of-fit plots illustrating the model performance for the training dataset (left) and the test dataset (right). Shown are predicted compared to observed values of (a,b) all measured verapamil and norverapamil plasma concentrations, (c,d) all AUClast values, and (e,f) all Cmax values. The solid line marks the line of identity, dotted lines indicate 1.25-fold, dashed lines indicate 2-fold deviation. Details on all studies are provided in the Supplementary Materials. iv: intravenous, po: oral.
Figure 4
Figure 4
Schematic illustration of the modeled drug–drug interactions. Verapamil acts as the perpetrator in the drug–drug interactions (DDIs) with midazolam and digoxin, whereas it is the victim drug in the DDIs with rifampicin and cimetidine. Metabolism and transport of the victim drugs are shown as black arrows. Mechanism-based inactivation is shown as a red line, non-competitive inhibition as an orange line, competitive inhibition as purple lines, and induction as green dashed arrows.
Figure 5
Figure 5
Victim drug plasma concentrations of the modeled drug-drug interactions. (a) Verapamil-midazolam DDI model performance; (b) verapamil-digoxin DDI model performance; (c) rifampicin-verapamil DDI model performance, and (d) cimetidine-verapamil DDI model performance for representative studies, shown in semilogarithmic (left) and linear plots (right) and compared to the corresponding observed data [14,15,43,54]. Predictions are shown as lines, observed data are shown as dots ± SD. Green, blue, and black = victim drug plasma concentrations without perpetrator co-administration, red = victim drug plasma concentrations during perpetrator treatment. Details on the study protocols and model predictions of the remaining DDI studies are provided in the Supplementary Materials. po: oral.
Figure 6
Figure 6
Correlation of predicted and observed DDI ratios. Model predicted (a) DDI AUClast ratios, (b) DDI Cmax ratios, and (c) DDI Ctrough ratios, compared to the corresponding clinically observed ratios of all 22 analyzed DDI studies. The different colors indicate the verapamil-midazolam DDI (blue), the verapamil-digoxin DDI (orange), the rifampicin-verapamil DDI (grey), and the cimetidine-verapamil DDI (green). The straight solid line marks the line of identity, the curved solid lines show the prediction acceptance limits proposed by Guest et al. [55]. Dotted lines indicate 1.25-fold, dashed lines indicate 2-fold deviation. Details on the study protocols and the values of the plotted DDI ratios are provided in the Supplementary Materials. iv: intravenous, po: oral.

References

    1. ClinCalc LLC. ClinCalc DrugStats Database. [(accessed on 25 March 2020)]; Available online: https://clincalc.com/DrugStats/
    1. Echizen H., Brecht T., Niedergesäss S., Vogelgesang B., Eichelbaum M. The effect of dextro-, levo-, and racemic verapamil on atrioventricular conduction in humans. Am. Heart J. 1985;109:210–217. doi: 10.1016/0002-8703(85)90585-X. - DOI - PubMed
    1. Echizen H., Vogelgesang B., Eichelbaum M. Effects of D,L-verapamil on atrioventricular conduction in relation to its stereoselective first-pass metabolism. Clin. Pharmacol. Ther. 1985;38:71–76. doi: 10.1038/clpt.1985.137. - DOI - PubMed
    1. Belpomme D., Gauthier S., Pujade-Lauraine E., Facchini T., Goudier M.J., Krakowski I., Netter-Pinon G., Frenay M., Gousset C., Marié F.N., et al. Verapamil increases the survival of patients with anthracycline-resistant metastatic breast carcinoma. Ann. Oncol. Off. J. Eur. Soc. Med. Oncol. 2000;11:1471–1476. doi: 10.1023/A:1026556119020. - DOI - PubMed
    1. Tolcher A.W., Cowan K.H., Solomon D., Ognibene F., Goldspiel B., Chang R., Noone M.H., Denicoff A.M., Barnes C.S., Gossard M.R., et al. Phase I crossover study of paclitaxel with r-verapamil in patients with metastatic breast cancer. J. Clin. Oncol. 1996;14:1173–1184. doi: 10.1200/JCO.1996.14.4.1173. - DOI - PubMed

LinkOut - more resources