. 2020 Jun 17;12(6):1599.
doi: 10.3390/cancers12061599.

Whole Exome Sequencing of Multi-Regional Biopsies from Metastatic Lesions to Evaluate Actionable Truncal Mutations Using a Single-Pass Percutaneous Technique

Affiliations

Whole Exome Sequencing of Multi-Regional Biopsies from Metastatic Lesions to Evaluate Actionable Truncal Mutations Using a Single-Pass Percutaneous Technique

Valerie Heong et al. Cancers (Basel). .

Abstract

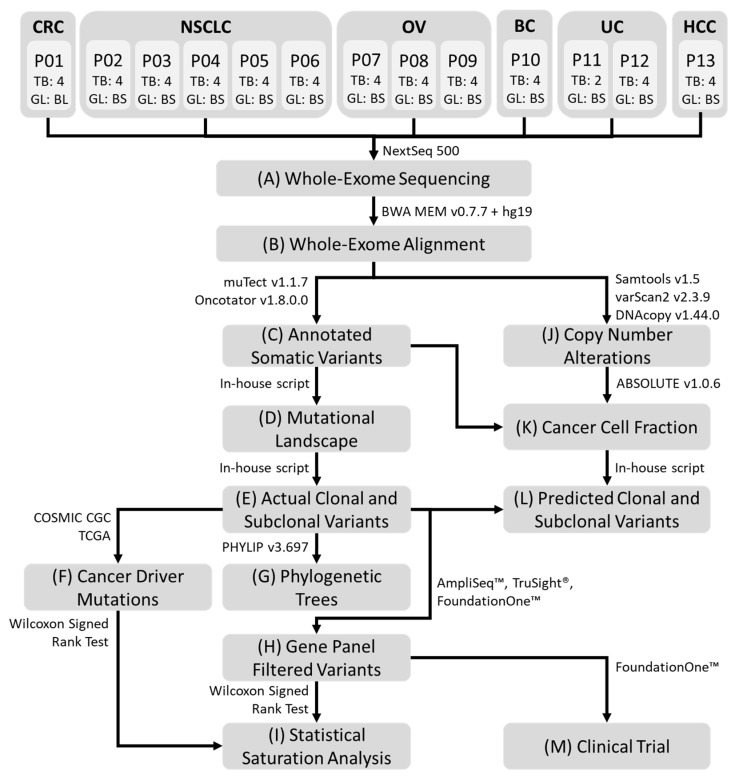
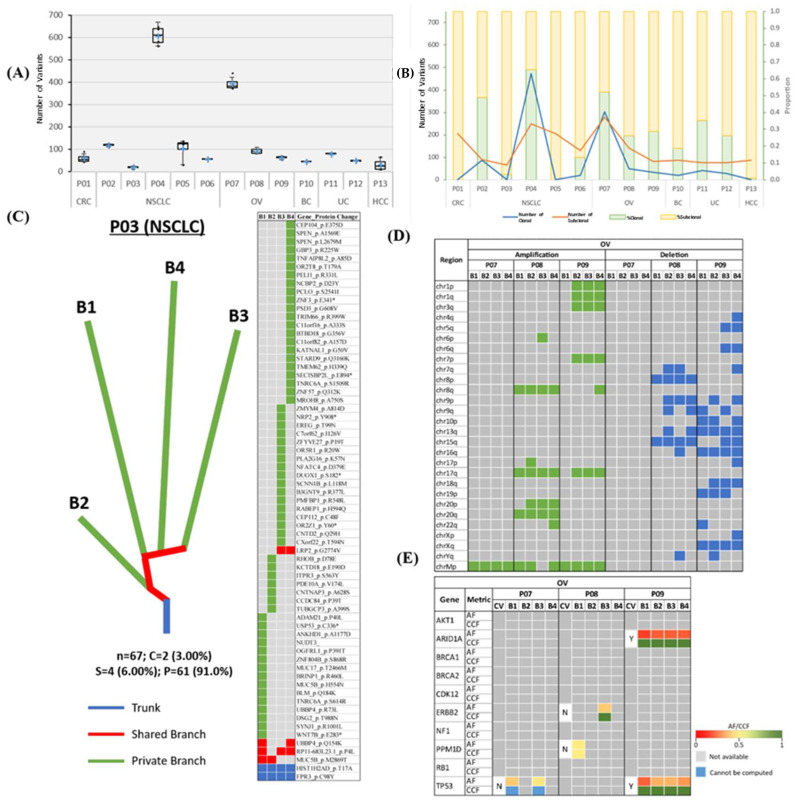
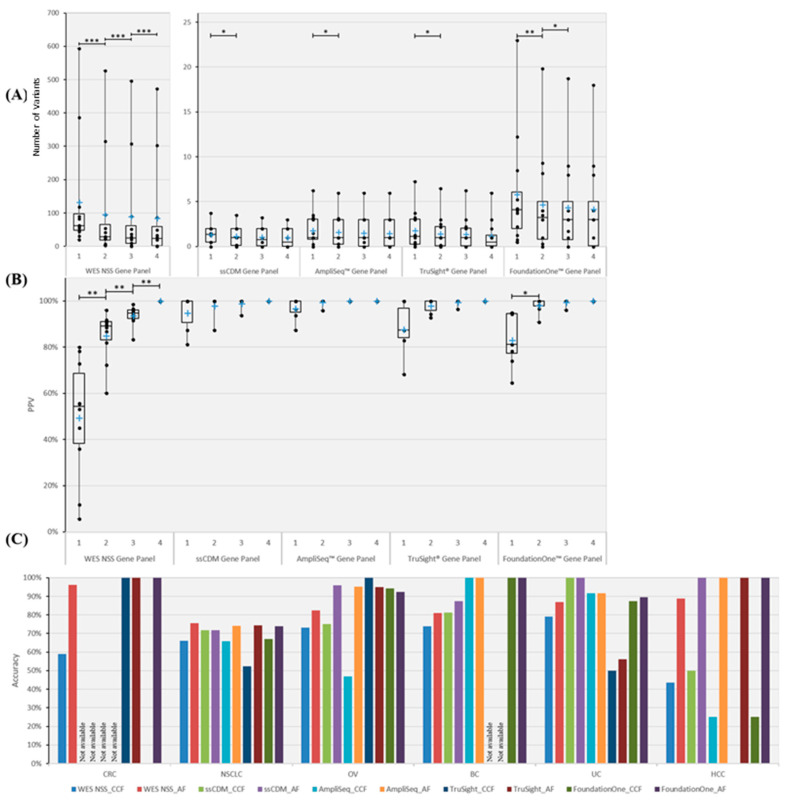
We investigate the feasibility of obtaining multiple spatially-separated biopsies from a single lesion to explore intratumor heterogeneity and identify actionable truncal mutations using whole exome sequencing (WES). A single-pass radiologically-guided percutaneous technique was used to obtain four spatially-separated biopsies from a single metastatic lesion. WES was performed to identify putative truncal variants (PTVs), defined as a non-synonymous somatic (NSS) variant present in all four spatially separated biopsies. Actionable truncal mutations-filtered using the FoundationOne panel-were defined as clinically relevant PTVs. Mutational landscapes of each biopsy and their association with patient outcomes were assessed. WES on 50 biopsied samples from 13 patients across six cancer types were analyzed. Actionable truncal mutations were identified in 9/13 patients; 31.1 ± 5.12 more unique NSS variants were detected with every additional multi- region tumor biopsy (MRTB) analyzed. The number of PTVs dropped by 16.1 ± 17.9 with every additional MRTB, with the decrease most pronounced (36.8 ± 19.7) when two MRTB were analyzed compared to one. MRTB most reliably predicted PTV compared to in silico analysis of allele frequencies and cancer cell fraction based on one biopsy sample. Three patients treated with actionable truncal mutation-directed therapy derived clinical benefit. Multi-regional sampling for genomics analysis is feasible and informative to help prioritize precision-therapy strategies.

Keywords: clonality classification; intratumor heterogeneity; multiple biopsies; strategic therapeutic intervention; tumor evolution.


Conflict of interest statement

D. Tan consultancy fees from Astra Zeneca, Roche, MSD, Merck Serono, Tessa Therapeutics, Eisai and Genmab. Reasearch funding from AstraZeneca, Bayer and Karyopharm and V. Heong consult on the advisory board for Astra Zeneca and Pfizer; the sponsor had no involvement in the design and conduct of the study; collection, management, analysis and interpretation of the data; preparation, review, or approval of the manuscript; or the decision to submit the manuscript for publication.

Figures

Figure 1
Figure 1
Representative workflow of the processing pipeline. (A) Whole-exome sequencing was performed on all germline and MRTB samples obtained from each patient. Bioinformatics analysis was subsequently performed: (B) alignment of sequence reads; (C) somatic variant calling and variant annotation; (D) generation of non-synonymous somatic mutational landscape across all patients; (E) identification of truncal and branch variants present in each patient; (F) curation of statistically significant somatic cancer driver mutations; (G) construction of phylogenetic trees from non-synonymous somatic variants; (H) filtering of genetic variants using AmpliSeq™, TruSight® and FoundationOne™ cancer gene panels; (I) statistical saturation analysis to determine the minimum number of MRTB samples needed (to alleviate challenges associated with ITH) in relation to the gene panel used; (J) copy number alterations analysis; (K) estimation of cancer cell fraction (CCF); (L) prediction of putative truncal variants using two different threshold metrics, namely variant allele frequency and CCF; (M) informed targeted therapies were performed based on patients’ mutational profile that reflects genes from the AmpliSeq™ cancer gene panel. MRTB: multi- region tumor biopsy; ITH: intratumor heterogeneity; TB: the number of MRTB samples resected from the patient; GL: the type of germline sample; BL: whole blood sample; BS: buccal swab sample. CRC: Colorectal cancer; NSCLC: Non-small cell lung cancer; OV: Ovarian Cancer; BC: Breast cancer; UC: Uterine Cancer; HCC: Hepatocellular Carcinoma; P: Patient.
Figure 2
Figure 2
Mutational landscape of patients across six cancer types. (A) Boxplot illustrating nssML. A cross (+) represents the mean value of the data. (B) Line chart and stacked bar chart representing the number and proportion of truncal/branch variants, respectively. (C) Representative phylogenetic tree and mutation heatmap for patient P03. Trunk, branch and private branches of the tree signify mutations that occur in all, in some but not all, and only one MRTB sample(s) resected from the patient, respectively. Heatmap demonstrates the presence (green: private; red: branch; blue: trunk) or absence (gray) of NSS mutations in each MRTB sample. Bx denotes an MRTB sample with identification number x. The total number of NSS, truncal (percentage), branch (percentage), and private (percentage) mutations are denoted by ‘n’, ‘C’, ‘S’, and ‘P’, respectively. (D) Heatmap illustrating the presence and absence (gray) of CNAs for patients with OV. Large-scale amplifications and deletions are represented with areas filled with green and blue, respectively. (E) ssCDMs for OC and their associated AF and CCF. CV: clonal (truncal) variant; Y: yes; N: no; AF: allele frequency; CCF: cancer cell fraction.
Figure 3
Figure 3
Number, PPV and in silico prediction accuracy of truncal variants across different gene panels. Five gene panels were scrutinized, namely WES NSS, CGC, AmpliSeq™, TruSight® and FoundationOne™ cancer gene panels. (A) Boxplot illustrating the number of PTVs across different numbers of MRTB samples analyzed concurrently. (B) PPV of PTVs in relation to the number of MRTB samples interrogated simultaneously. (C) Best average prediction accuracy of PTVs across different cancer types. Two types of thresholds were used to classify variants into either truncal or branch, namely AF and CCF. Based on the respective threshold, the best average prediction accuracy achievable (within the defined search domain) among all patients with the same cancer type (across different gene panels) is portrayed above. A single asterisk (*) denotes p < 0.05, double asterisks (**) signify p < 0.01, while triple asterisks (***) indicate p < 0.001. A cross (+) represents the mean value of the data. ‘Not available’ signifies that no variants that are associated with the specific gene panel were found.

References

    1. Jamal-Hanjani M., Wilson G.A. Tracking the Evolution of Non–Small-Cell Lung Cancer. N. Engl. J. Med. 2017;376:2109–2121. doi: 10.1056/NEJMoa1616288. - DOI - PubMed
    1. Greaves M. Evolutionary determinants of cancer. Cancer Discov. 2015;5:806–820. doi: 10.1158/2159-8290.CD-15-0439. - DOI - PMC - PubMed
    1. Burrell R.A., McGranahan N. The causes and consequences of genetic heterogeneity in cancer evolution. Nature. 2013;501:338–345. doi: 10.1038/nature12625. - DOI - PubMed
    1. Gerlinger M., Rowan A.J. Intratumor Heterogeneity and Branched Evolution Revealed by Multiregion Sequencing. N. Engl. J. Med. 2012;366:883–892. doi: 10.1056/NEJMoa1113205. - DOI - PMC - PubMed
    1. Dagogo-Jack I., Shaw A.T. Tumour heterogeneity and resistance to cancer therapies. Nat. Rev. Clin. Oncol. 2018;15:81–94. doi: 10.1038/nrclinonc.2017.166. - DOI - PubMed

LinkOut - more resources