. 2020 Jun 17;21(12):4322.
doi: 10.3390/ijms21124322.

Expression Changes and Impact of the Extracellular Matrix on Etoposide Resistant Human Retinoblastoma Cell Lines

Affiliations

Expression Changes and Impact of the Extracellular Matrix on Etoposide Resistant Human Retinoblastoma Cell Lines

Jacqueline Reinhard et al. Int J Mol Sci. .

Abstract

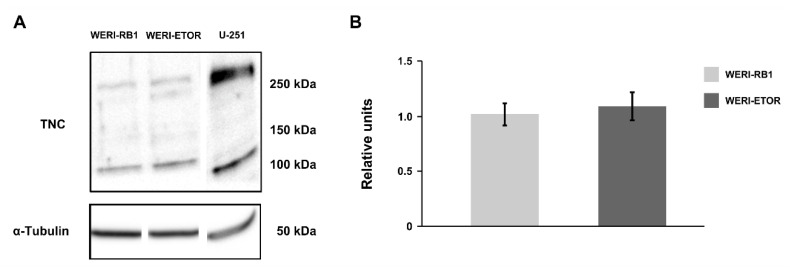
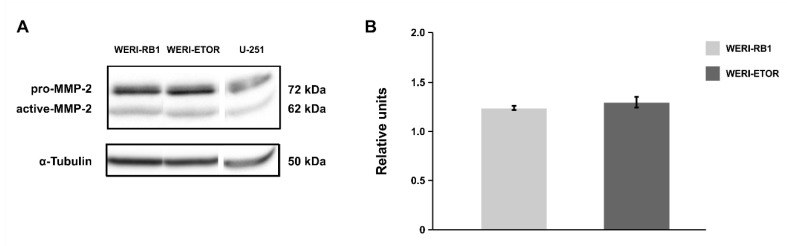
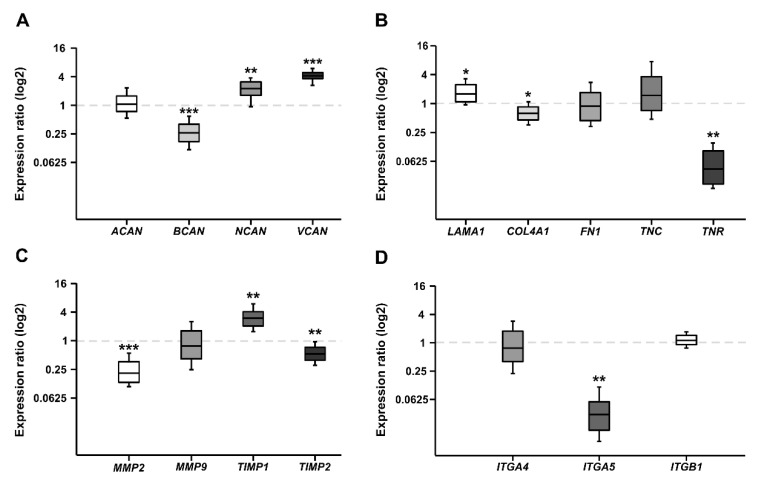
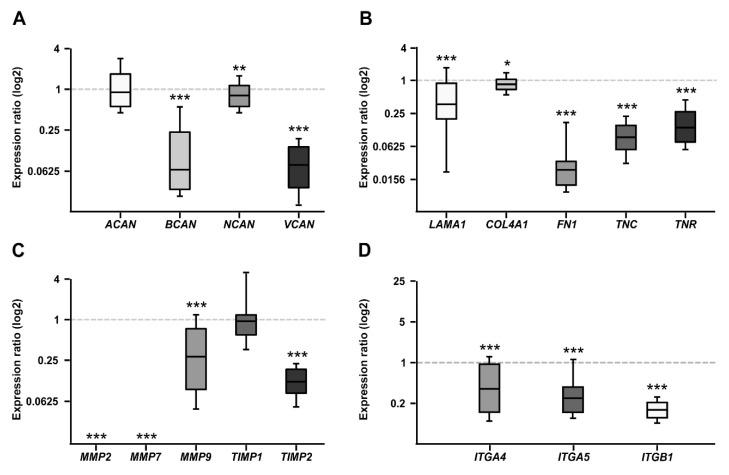
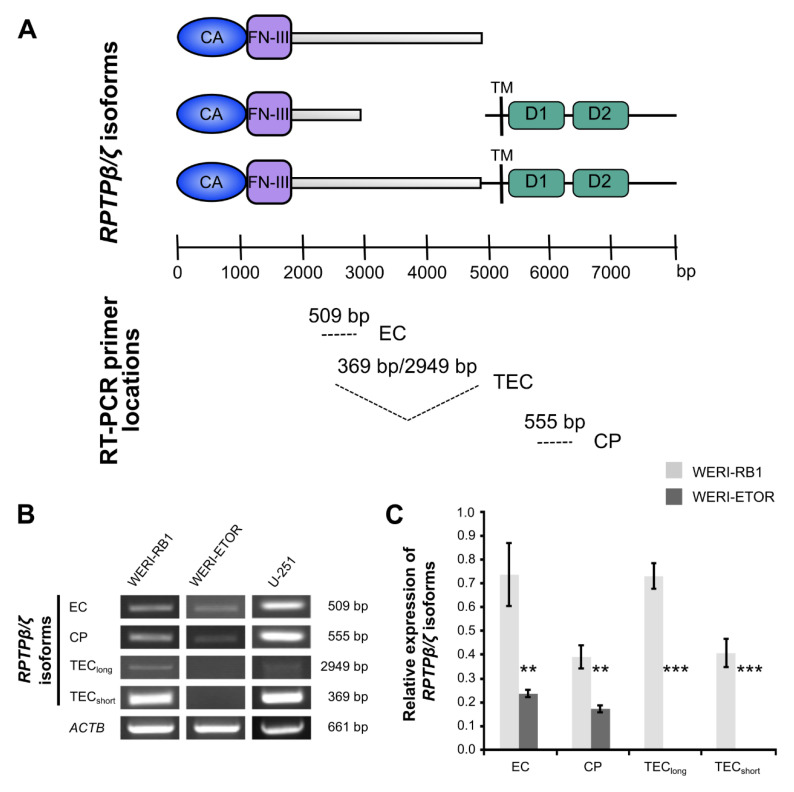
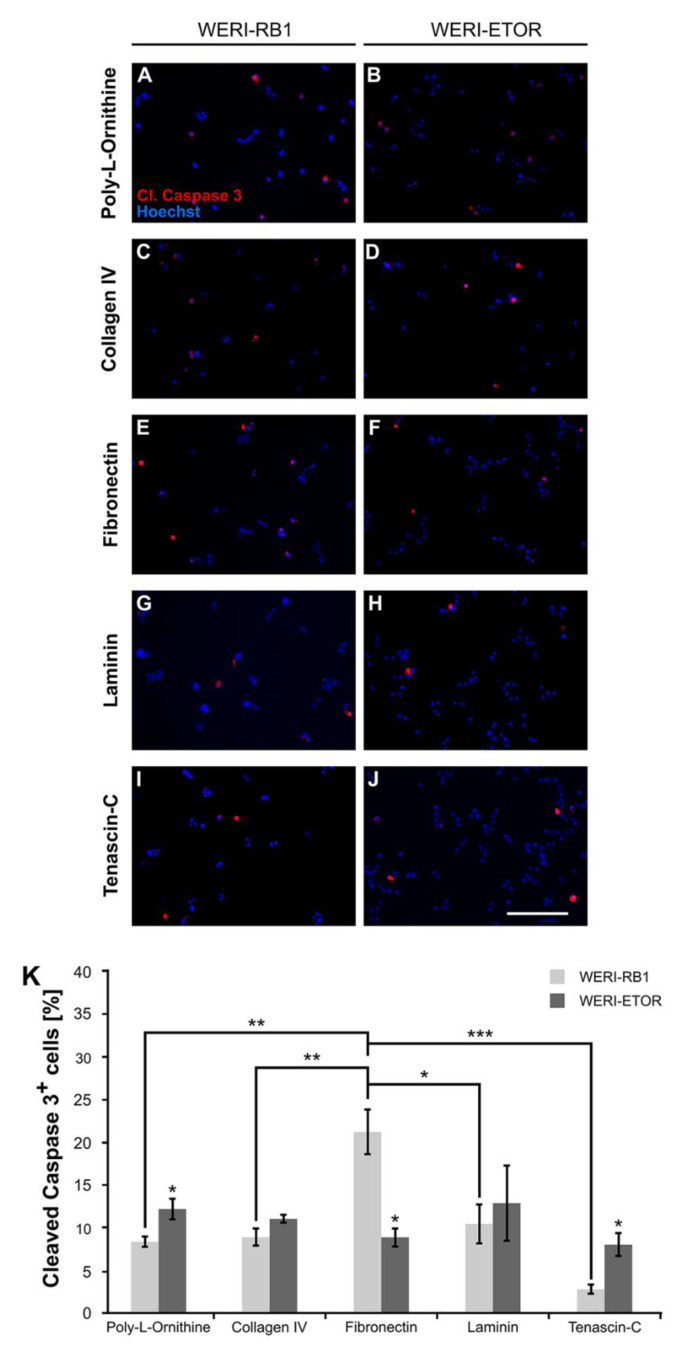
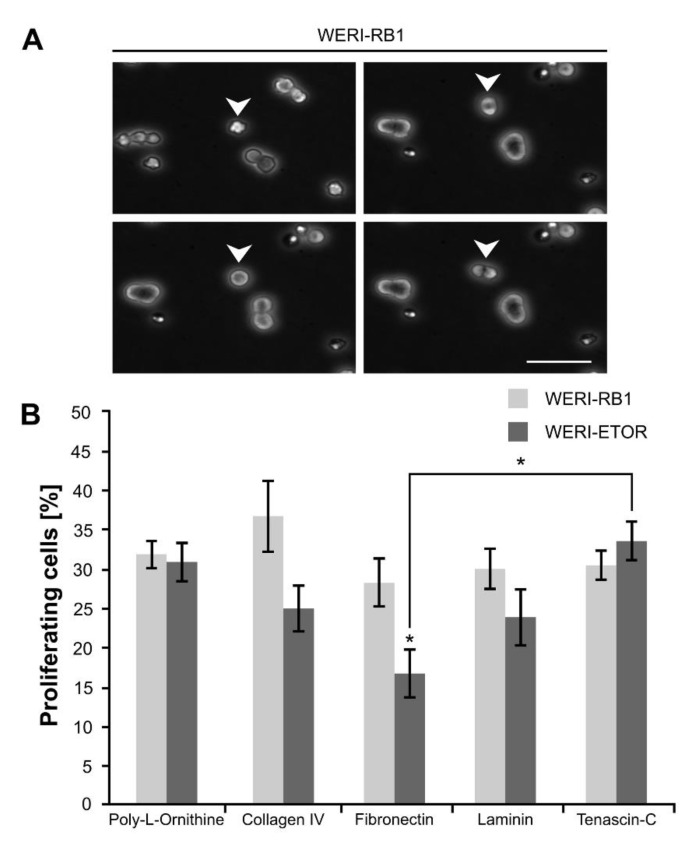
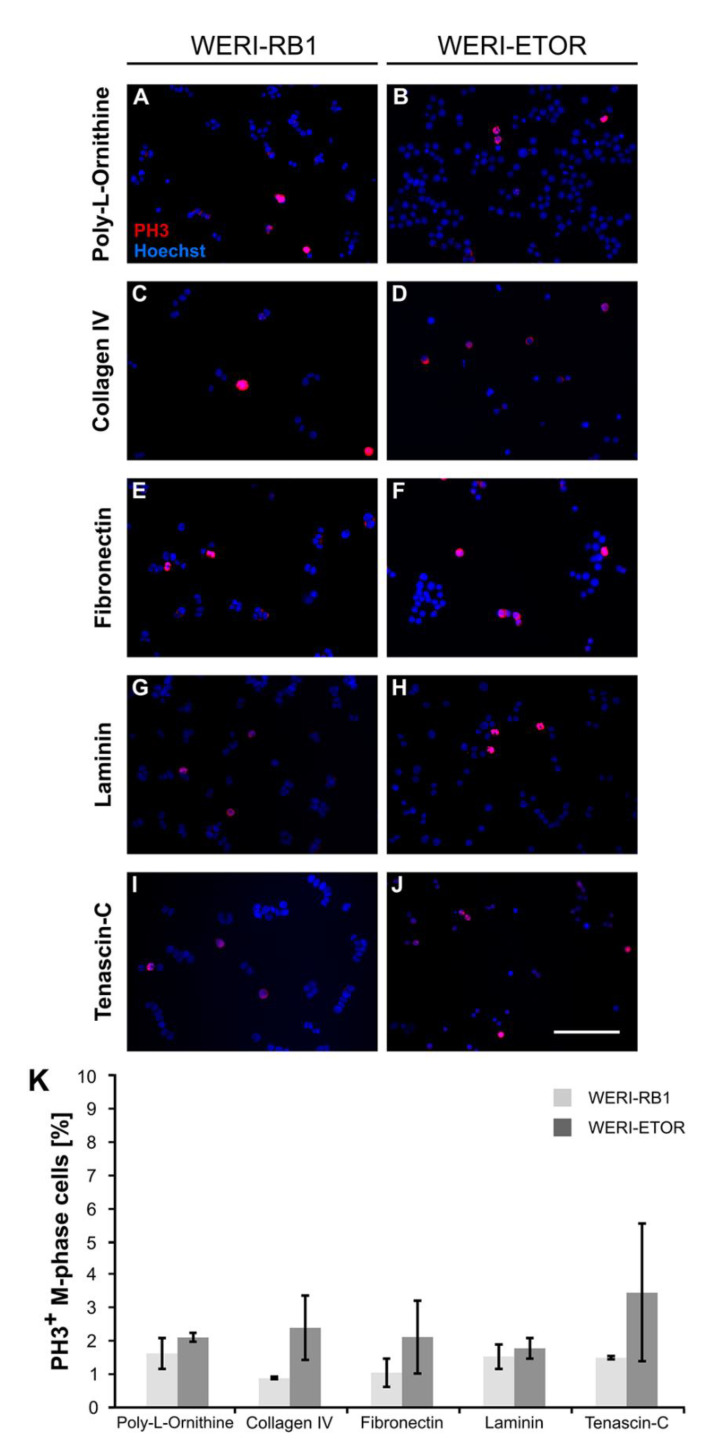
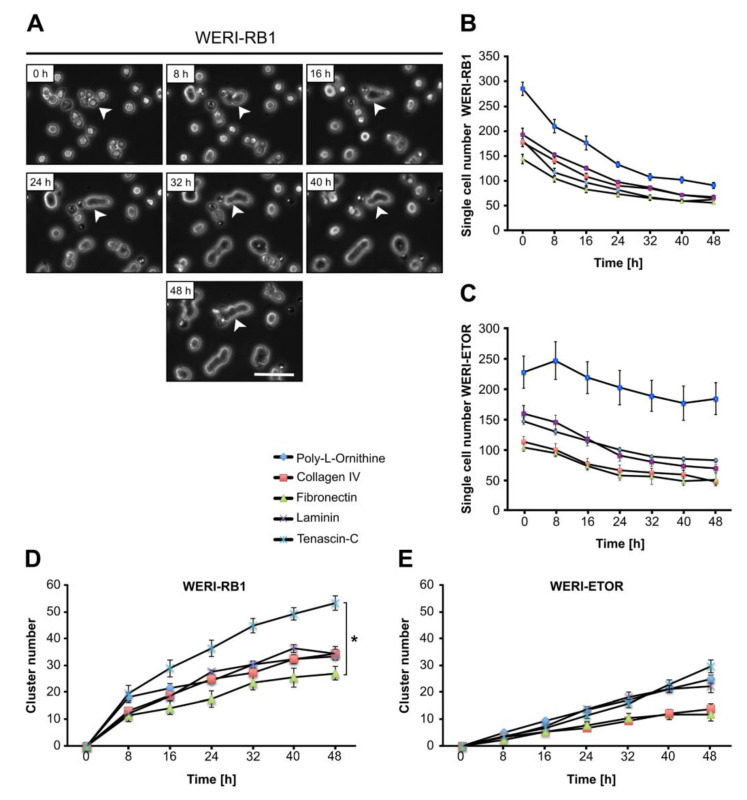
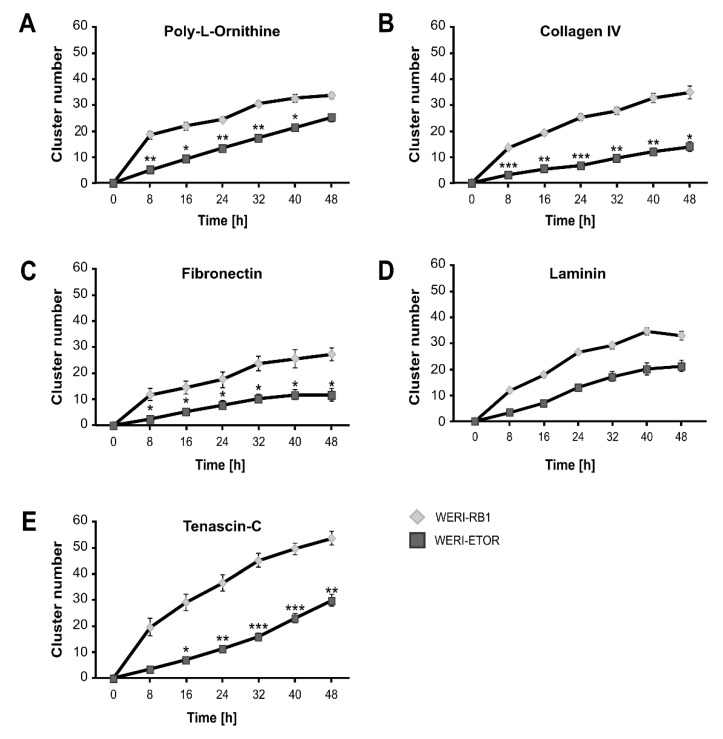
Retinoblastoma (RB) represents the most common malignant childhood eye tumor worldwide. Several studies indicate that the extracellular matrix (ECM) plays a crucial role in tumor growth and metastasis. Moreover, recent studies indicate that the ECM composition might influence the development of resistance to chemotherapy drugs. The objective of this study was to evaluate possible expression differences in the ECM compartment of the parental human cell lines WERI-RB1 (retinoblastoma 1) and Y79 and their Etoposide resistant subclones via polymerase chain reaction (PCR). Western blot analyses were performed to analyze protein levels. To explore the influence of ECM molecules on RB cell proliferation, death, and cluster formation, WERI-RB1 and resistant WERI-ETOR cells were cultivated on Fibronectin, Laminin, Tenascin-C, and Collagen IV and analyzed via time-lapse video microscopy as well as immunocytochemistry. We revealed a significantly reduced mRNA expression of the proteoglycans Brevican, Neurocan, and Versican in resistant WERI-ETOR compared to sensitive WERI-RB1 cells. Also, for the glycoproteins α1-Laminin, Fibronectin, Tenascin-C, and Tenascin-R as well as Collagen IV, reduced expression levels were observed in WERI-ETOR. Furthermore, a downregulation was detected for the matrix metalloproteinases MMP2, MMP7, MMP9, the tissue-inhibitor of metalloproteinase TIMP2, the Integrin receptor subunits ITGA4, ITGA5 and ITGB1, and all receptor protein tyrosine phosphatase β/ζ isoforms. Downregulation of Brevican, Collagen IV, Tenascin-R, MMP2, TIMP2, and ITGA5 was also verified in Etoposide resistant Y79 cells compared to sensitive ones. Protein levels of Tenascin-C and MMP-2 were comparable in both WERI cell lines. Interestingly, Fibronectin displayed an apoptosis-inducing effect on WERI-RB1 cells, whereas an anti-apoptotic influence was observed for Tenascin-C. Conversely, proliferation of WERI-ETOR cells was enhanced on Tenascin-C, while an anti-proliferative effect was observed on Fibronectin. In WERI-ETOR, cluster formation was decreased on the substrates Collagen IV, Fibronectin, and Tenascin-C. Collectively, we noted a different ECM mRNA expression and behavior of Etoposide resistant compared to sensitive RB cells. These findings may indicate a key role of ECM components in chemotherapy resistance formation of RB.

Keywords: WERI-RB1; Y79; chemotherapy resistance; etoposide; extracellular matrix; integrins; retinoblastoma.


Conflict of interest statement

The authors declare no conflict of interest.

Figures

Figure A1
Figure A1
Western blot analyses of TNC in the WERI-RB1 and WERI-ETOR cell line. (A) Representative Western blot analysis using protein lysates of WERI-RB1 and WERI-ETOR cells. Lysate of the glioblastoma cell line U-251 was used as positive control. Distinct bands at > 250, > 150, and > 100 kDa were detectable for TNC. α-Tubulin was detectable at ~50 kDa. (B) A comparable TNC protein level was noted in both WERI cell lines. Data are shown as mean ± SEM. n = 4/group.
Figure A2
Figure A2
Western blot analyses of the MMP-2 protein in the WERI-RB1 and WERI-ETOR cell line. (A) Representative Western blot analysis using protein lysates of WERI-RB1 and WERI-ETOR cells. Lysate of the glioblastoma cell line U-251 was used as positive control. Pro- and active-MMP-2 protein was detectable at 72 and 62 kDa, respectively. α-Tubulin was detectable at ~50 kDa. (B) A comparable MMP-2 protein concentration was measured in both WERI cell lines. Data are shown as mean ± SEM. n = 4/group.
Figure A3
Figure A3
RT-qPCR analyses of relative CSPG, ECM glycoprotein, MMP, TIMP, and Integrin mRNA expression in Etoposide sensitive and resistant Y79 cell lines. (A) A similar ACAN expression was observed in both Y79 cell lines. Significantly reduced BCAN levels were found in resistant compared to sensitive Y79 cells. In contrast, NCAN and VCAN expression levels were significantly higher in the resistant Y79 cell line. (B) The expression of LAMA1 was significantly upregulated in the resistant Y79 cell line. While COL4A1 and TNR were significantly downregulated in resistant Y79 cells. A comparable FN1 and TNC mRNA level was observed in both Y79 cell lines. (C) Significantly reduced expression levels were found for MMP2 and TIMP2. While MMP9 mRNA expression was comparable in both cell lines. TIMP1 was significantly upregulated in the resistant cell line. (D) The resistant Y79 cells showed a significantly reduced ITGA5 expression. ITGA4 and ITGB1 expression was similar in both groups. Values are median ± quartile + maximum/minimum. The dotted line in the graphs represents the relative expression level of the Etoposide sensitive Y79 cell line. * p < 0.05; ** p < 0.01; *** p < 0.001; n = 6/group.
Figure 1
Figure 1
RT-qPCR analyses of relative CSPG, extracellular matrix (ECM) glycoprotein, matrix metalloproteinases (MMPs), tissue-inhibitor of metalloproteinases (TIMPs), and Integrin mRNA expression in the WERI-ETOR compared to the WERI-RB1 cell line. (A) In the resistant WERI-ETOR cell line, significantly reduced levels of Brevican (BCAN), Neurocan (NCAN), and Versican (VCAN) were observed. In contrast, Aggrecan (ACAN) expression was comparable in both WERI cell lines. (B) A significant downregulation was observed for all ECM glycoproteins (α1-Laminin (LAMA1), Fibronectin (FN1), Tenascin-C (TNC), and Tenascin-R (TNR)) as well as for Collagen IV (COL4A1). (C) Significant lower expression levels were detected for MMP2, MMP7, MMP9, and TIMP2. While TIMP1 expression was similar in both WERI cell lines. (D) In the WERI-ETOR cell line, significantly reduced levels of integrin receptor subunits ITGA4, ITGA5, and ITGB1 were noted. Values are median ± quartile + maximum/minimum. The dotted line in the graphs represents the relative expression level of the WERI-RB1 cell line. * p < 0.05; ** p < 0.01; *** p < 0.001; n = 10/group.
Figure 2
Figure 2
Semi-quantitative RT-PCR analyses of RPTPβ/ζ isoforms in WERI-RB1 compared to WERI-ETOR cells using various primer sets. (A) Scheme displays binding sites of specific RPTPβ/ζ (PTPRZ1) primer pairs for isoform amplification. All three of the RPTPβ/ζ isoforms, which were generated by alternative splicing, exhibit an extracellular carbonic anhydrase-like (CA) domain and Fibronectin-type-III (FN-III) repeats. A set of three distinct primers pairs (EC, TEC, and CP) marks the corresponding nucleotide sequence to demonstrate the resulting amplicon (modified according to Norman and colleagues [45]). (B) Using a set of three different primer pairs, the expression of RPTPβ/ζ isoforms was evaluated in both cell lines. The glioblastoma multiforme cell line U-251 served as positive control. The primer pair termed EC amplified a 509 bp product. This amplified product is part of all RPTPβ/ζ isoforms. A second primer pair, termed CP, amplified a 555 bp product, which corresponds to both RPTPβ/ζ receptor isoforms. Using this primer pair, expression of RPTPβ/ζlong/short was verified in WERI-RB1 cells. In contrast, only little, if any expression, was observed in WERI-ETOR cells. A third primer pair, termed TEC, amplified a 369 bp (RPTPβ/ζshort) as well as a 2949 bp (RPTPβ/ζlong) fragment. Both transcripts were verified in the WERI-RB1 line but were absent in the WERI-ETOR cell line. (C) Densitometric measurements of band intensities followed by semi-quantitative analyses and relative quantification (normalized to ACTB expression) revealed a significant downregulation of all RPTPβ/ζ isoforms in WERI-ETOR compared to WERI-RB1 cells. Values are shown as mean ± SD. ** p < 0.01; *** p < 0.001; n = 5/group.
Figure 3
Figure 3
Immunocytochemical detection of apoptotic WERI-RB1 and WERI-ETOR cells cultivated on various ECM substrates. (A–J) Apoptotic cells were identified by cleaved Caspase 3 (cl. Caspase 3) immunostaining (red) and nuclear Hoechst co-staining (blue) in WERI-RB1 (A,C,E,G,I) and WERI-ETOR cells (B,D,F,H,J). (K) Significantly more cleaved Caspase 3+ cells were identified for the WERI-ETOR compared to the WERI-RB1 cell line when cultivated on the non-ECM control Poly-L-Ornithine or the ECM glycoprotein Tenascin-C. On Collagen IV and Laminin, the percentage of apoptotic WERI-RB1 and WERI-ETOR cells was comparable. In contrast, on Fibronectin, a significantly reduced percentage of cleaved Caspase 3+ cells was observed for WERI-ETOR compared to WERI-RB1 cells. Furthermore, our analyses of the WERI-RB1 cell line revealed a significant increased number of apoptotic cells on Fibronectin when compared to the other substrates. Data are shown as mean ± SEM. * p < 0.05; ** p < 0.01; *** p < 0.001; n = 3/group. Scale bar = 100 µm.
Figure 4
Figure 4
Proliferation analyses via time-lapse video microscopy of WERI-RB1 and WERI-ETOR cells cultivated on various ECM substrates. (A) Representative phase contrast images of proliferative WERI-RB1 cells documented via time-lapse video microscopy. White arrowheads indicate cell division. (B) The percentage of proliferative WERI-RB1 was comparable to the percentage of proliferative WERI-ETOR cells when cultivated on Poly-L-Ornithine (non-ECM control), Collagen IV, Laminin, and Tenascin-C. In contrast, on Fibronectin, a significant reduced percentage of proliferative WERI-ETOR cells was observed. Furthermore, regarding the WERI-ETOR cell line, a significant lower percentage of proliferative cells was found on Fibronectin compared to Tenascin-C. Values are shown as mean ± SEM. * p < 0.05; n = 5/group. Scale bar = 50 µm.
Figure 5
Figure 5
Immunocytochemical detection of PH3+ M-phase WERI-RB1 and WERI-ETOR cells cultivated on various ECM substrates. (A–J) Proliferative WERI-RB1 (A,C,E,G,I) and WERI-ETOR (B,D,F,H,J) M-phase cells were identified by PH3 immuno- (red) and nuclear Hoechst co-staining (blue). (K) In both cell lines, counts revealed that the percentage of M-phase cells was comparable when cultivated on Poly-L-Ornithine (non-ECM control), Collagen IV, Fibronectin, Laminin, and Tenascin-C. Values are shown as mean ± SEM. n = 3/group. Scale bar = 100 µm.
Figure 6
Figure 6
Single cell number and cell cluster formation analyses of WERI-RB1 and WERI-ETOR cells cultivated on various ECM substrates via time-lapse microscopy. (A) Representative phase contrast images of WERI-RB1 cell cluster formation (white arrowhead) as revealed by time-lapse video microscopy over 48 h. (B,C) The number of single WERI-RB1 and WERI-ETOR cells cultivated on Poly-L-Ornithine (non-ECM control), Collagen IV, Fibronectin, Laminin, and Tenascin-C decreases over time. (D,E) Over 48 h, the number of WERI-RB1 and WERI-ETOR cell clusters was increased when plated on various substrates. Importantly, at 48 h the WERI-RB1 cells displayed a significantly higher cluster number on Tenascin-C compared to Fibronectin. Data are shown as mean ± SEM. * p < 0.05; n = 5/group. Scale bar = 50 µm.
Figure 7
Figure 7
Cell cluster number of WERI-RB1 and WERI-ETOR cells cultivated on various ECM substrates via time-lapse microscopy. (A) In comparison to the WERI-RB1 cell line, WERI-ETOR showed a significantly decreased cluster number between 8 and 40 h when cultivated on Poly-L-Ornithine (non-ECM control). (B) On Collagen IV, WERI-ETOR cells displayed a lower cluster number from 8 to 48 h. (C) Also, on Fibronectin, WERI-ETOR cells displayed a reduced cluster number from 8 to 48 h. (D) In contrast, both RB cell lines exhibited a similar cluster number on Laminin. (E) On Tenascin-C, WERI-ETOR showed a significantly reduced cluster number from 16 to 48 h. Data are shown as mean ± SEM. * p < 0.05; ** p < 0.01; *** p < 0.001; n = 3/group.

Similar articles

Cited by

References

    1. Dimaras H., Corson T.W., Cobrinik D., White A., Zhao J., Munier F.L., Abramson D.H., Shields C.L., Chantada G.L., Njuguna F., et al. Retinoblastoma. Nat. Rev. Dis. Primers. 2015;1:15021. doi: 10.1038/nrdp.2015.21. - DOI - PMC - PubMed
    1. Fabian I.D., Onadim Z., Karaa E., Duncan C., Chowdhury T., Scheimberg I., Ohnuma S.I., Reddy M.A., Sagoo M.S. The management of retinoblastoma. Oncogene. 2018;37:1551–1560. doi: 10.1038/s41388-017-0050-x. - DOI - PubMed
    1. Dimaras H., Kimani K., Dimba E.A., Gronsdahl P., White A., Chan H.S., Gallie B.L. Retinoblastoma. Lancet. 2012;379:1436–1446. doi: 10.1016/S0140-6736(11)61137-9. - DOI - PubMed
    1. Kivela T. The epidemiological challenge of the most frequent eye cancer: Retinoblastoma, an issue of birth and death. Br. J. Ophthalmol. 2009;93:1129–1131. doi: 10.1136/bjo.2008.150292. - DOI - PubMed
    1. Jain M., Rojanaporn D., Chawla B., Sundar G., Gopal L., Khetan V. Retinoblastoma in Asia. Eye (Lond.) 2019;33:87–96. doi: 10.1038/s41433-018-0244-7. - DOI - PMC - PubMed

LinkOut - more resources