. 2020 Sep:173:107228.
doi: 10.1016/j.nlm.2020.107228. Epub 2020 Jun 17.

Prefrontal oscillations modulate the propagation of neuronal activity required for working memory

Affiliations

Prefrontal oscillations modulate the propagation of neuronal activity required for working memory

Jason Sherfey et al. Neurobiol Learn Mem. 2020 Sep.

Abstract

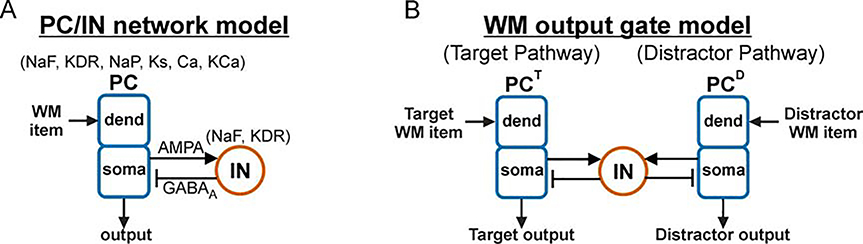
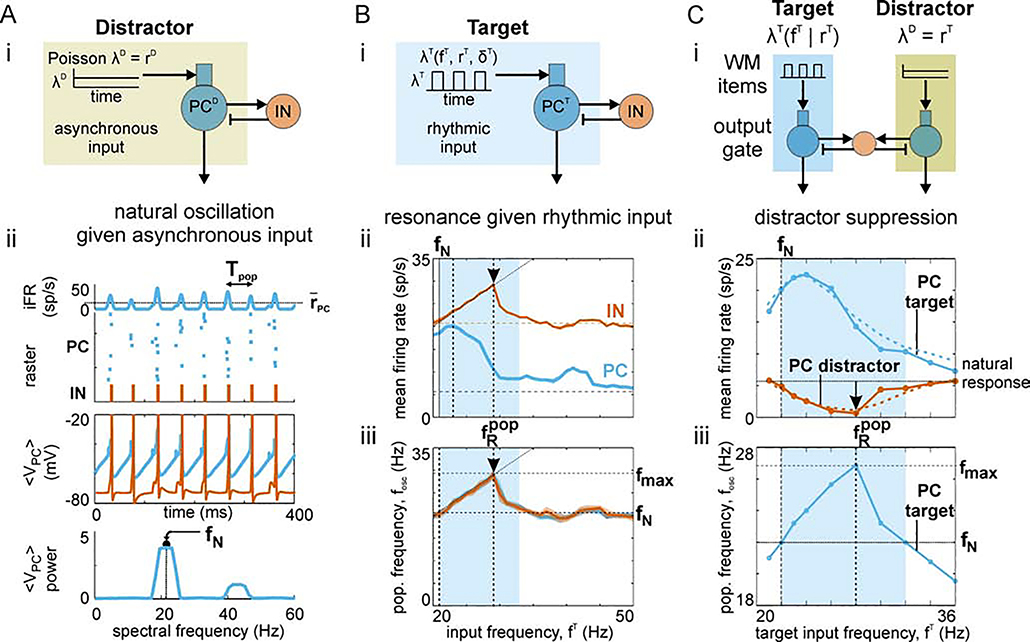
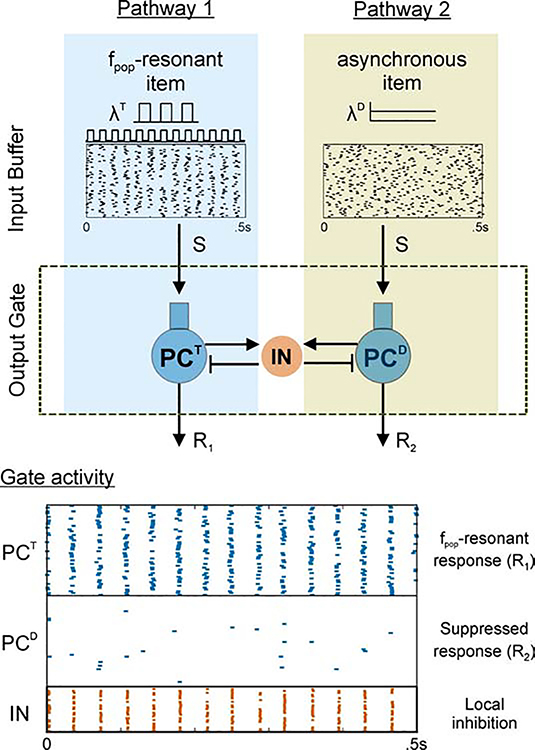
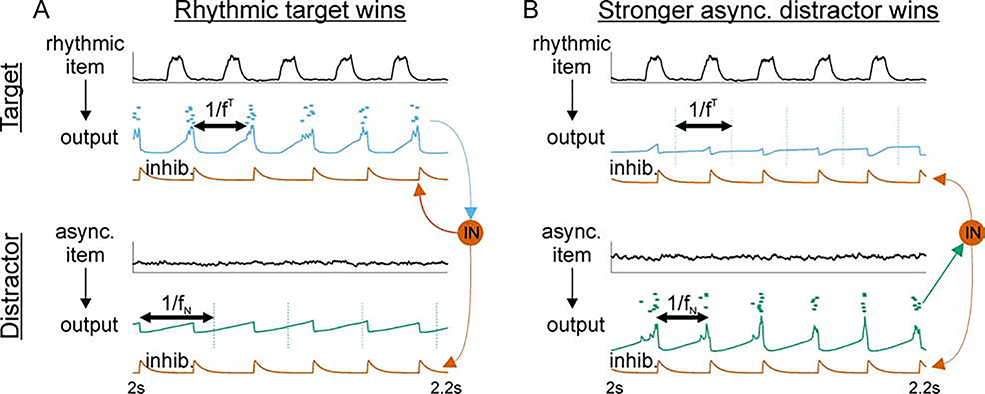
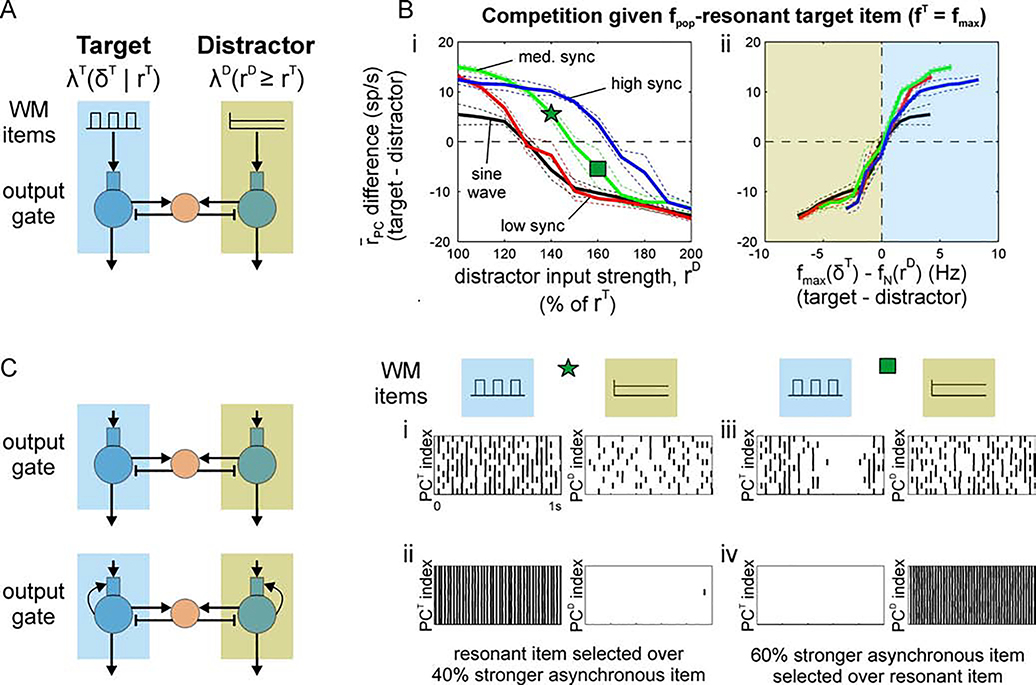
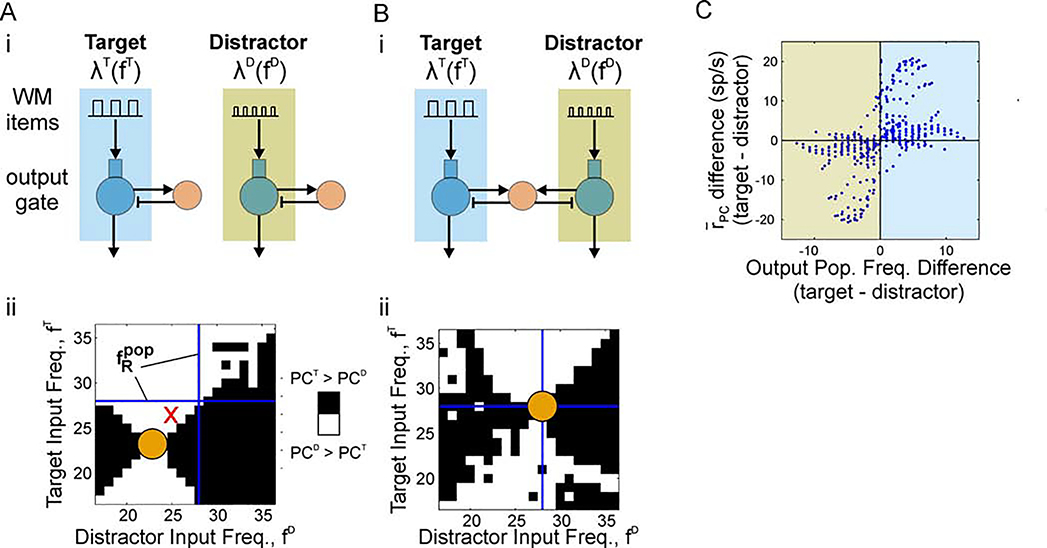
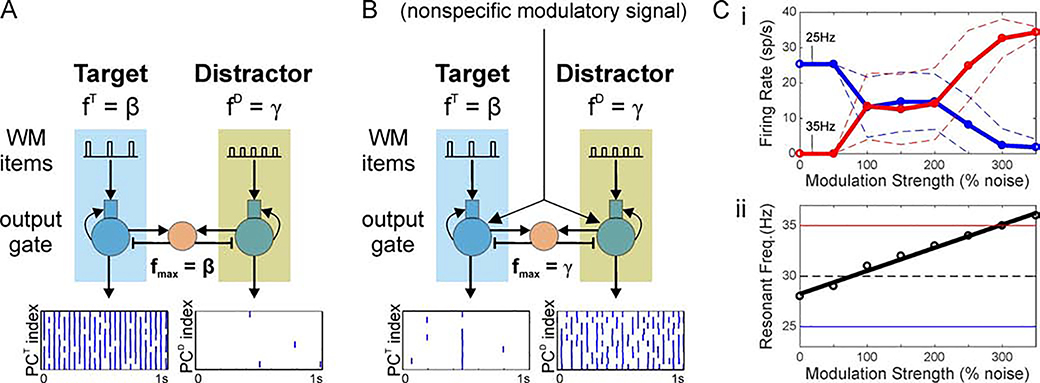
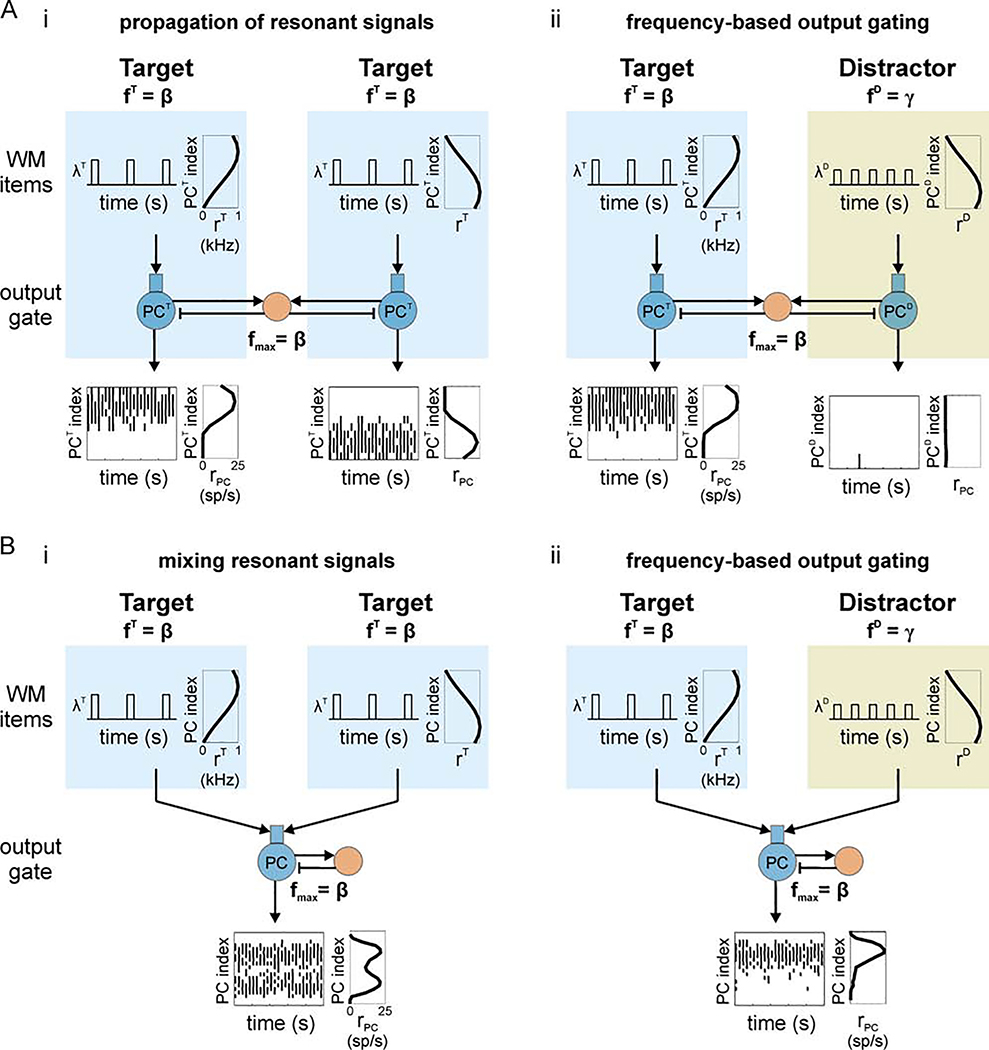
Cognition involves using attended information, maintained in working memory (WM), to guide action. During a cognitive task, a correct response requires flexible, selective gating so that only the appropriate information flows from WM to downstream effectors that carry out the response. In this work, we used biophysically-detailed modeling to explore the hypothesis that network oscillations in prefrontal cortex (PFC), leveraging local inhibition, can independently gate responses to items in WM. The key role of local inhibition was to control the period between spike bursts in the outputs, and to produce an oscillatory response no matter whether the WM item was maintained in an asynchronous or oscillatory state. We found that the WM item that induced an oscillatory population response in the PFC output layer with the shortest period between spike bursts was most reliably propagated. The network resonant frequency (i.e., the input frequency that produces the largest response) of the output layer can be flexibly tuned by varying the excitability of deep layer principal cells. Our model suggests that experimentally-observed modulation of PFC beta-frequency (15-30 Hz) and gamma-frequency (30-80 Hz) oscillations could leverage network resonance and local inhibition to govern the flexible routing of signals in service to cognitive processes like gating outputs from working memory and the selection of rule-based actions. Importantly, we show for the first time that nonspecific changes in deep layer excitability can tune the output gate's resonant frequency, enabling the specific selection of signals encoded by populations in asynchronous or fast oscillatory states. More generally, this represents a dynamic mechanism by which adjusting network excitability can govern the propagation of asynchronous and oscillatory signals throughout neocortex.

Keywords: Beta rhythm; Cognition; Gamma rhythm; Gating; Resonance; Working memory.


Conflict of interest statement

Conflict of Interest Statement: The authors declare no competing financial interests.

Figures

Figure 1.
Figure 1.. Architecture of output networks.
(A) Diagram showing feedforward excitation from external independent Poisson spike trains to the dendrites of 20 two-compartment (soma, dend) principal cells (PCs) receiving feedback inhibition from a population of 5 fast spiking interneurons (INs). All PC and IN cells have biophysics based on prefrontal neurons (Durstewitz and Seamans, 2002) (Ion channel key: NaF = fast sodium channel; KDR = fast delayed rectifier potassium channel; NaP = persistent sodium channel; Ks = slow (M-type) potassium channel; Ca = high-threshold calcium channel; KCa = calcium-dependent potassium channel). (B) Diagram showing a rhythmically-driven target population of PCs (PCT) competing with an asynchronously-driven distractor population (PCD) through a shared population of inhibitory IN cells. This figure was adapted from Sherfey et al. (2018a).
Figure 2.
Figure 2.. Dynamics of PC/IN network.
(A) Natural oscillation. (i) Schematic showing asynchronous Poisson spike trains driving the dendrites of two-compartment principal cells (PCs) coupled to interneurons (INs) providing strong feedback inhibition. (ii) The response of the asynchronously-driven PC/IN network is an inhibition-paced, pulsatile oscillation of periodic spike volleys occurring at a natural frequency, fN. (B) Resonant response. (i) Schematic showing rhythmically-modulated Poisson spike trains driving the PC/IN network. The input has square wave rate-modulation with a 10 ms pulse width; i.e., all input spikes occur within 10 ms on a given cycle. (ii) The impact of the frequency of input rate-modulation, fT, on mean output firing rates (averaged over time, population, and 10 realizations) for PC (blue) and IN (red) populations. (iii) The impact of the input frequency on the frequency of output rate-modulation, fpop, for PC (blue) and IN (red) populations. Vertical dashed lines mark the resonant input frequencies. Horizontal dashed lines indicate the natural response to asynchronous input. The interval with blue shading highlights the range of input frequencies that yield an output oscillation that is faster than the natural frequency. (C) Distractor suppression. (i) Schematic showing a rhythmically-driven target population of PCs (PCT) competing with an asynchronously-driven distractor population (PCD) through a shared pool of inhibitory INs. Strong feedback inhibition causes each output to be rhythmic; the shared INs induce competitive interactions between them. (ii) Mean firing rate outputs for target (blue) and distractor (red) as target input frequency is increased; results for detailed and simplified models are shown using dashed and solid lines, respectively. Peak target output, maximal distractor suppression, and the range of target input frequencies that suppressed the distractor response were the same in both models. Blue shading highlights the range of input frequencies yielding an output oscillation that is faster than the natural frequency; the range increases with input synchrony and strength (not shown). (iii) Output population frequency of the target (blue) and the natural frequency of an asynchronously-driven PC/IN network (horizontal dashed line). The vertical dashed line marks the peak output frequency of the target and corresponds to the target input frequency at which the distractor output is maximally suppressed. Parts of (A) and the simplified model in (C) were adapted from Sherfey et al. (2018a).
Figure 3.
Figure 3.. Resonant bias supports rule-based stimulus-response mapping.
Example simulation of the more-detailed model showing two pathways (i.e., alternative stimulus-response mappings) with superficial layer inputs and deep layer outputs. One pathway has a resonant input that drives its output population while the other pathway has an asynchronous input and an output that is suppressed by interneuron-mediated lateral inhibition.
Figure 4.
Figure 4.. Oscillatory gating: control of periodic inhibition determines gate output.
(A) Rhythmic WM item dominates the output gate. The response to the oscillatory input has a shorter period than the natural response to the asynchronous item (compare horizontal double arrows). Consequently, the target engages local inhibition to suppress the distractor response before it can reach threshold. Black curves show the excitatory postsynaptic potentials produced by (top) a rhythmic input item and (bottom) an asynchronous input item. Summed voltages and spikes for the (top) target and (bottom) distractor PC populations are shown beneath their inputs. Red curves show the inhibitory postsynaptic potentials produced by the INs onto (top) target and (bottom) distractor PCs. Vertical dashed lines on distractor output mark when spikes would have occurred in absence of lateral inhibition. (B) A stronger asynchronous WM item dominates the output gate. The response to a stronger asynchronous input produces a natural oscillation with a shorter period than that of the oscillatory input. Consequently, the distractor output engages local inhibition and suppresses the response to the oscillatory item. Vertical dashed lines on target output mark when spikes would have occurred in absence of lateral inhibition.
Figure 5.
Figure 5.. Effect of item synchrony on strength of resonant bias.
(A) Schematic showing target output (PCT) receiving an oscillatory input with synchrony varied across simulations in competition with a distractor output (PCD) receiving asynchronous input with strength varied 1–2x the strength of oscillatory input across simulations. Oscillatory inputs were either sinusoidal or square wave with high synchrony (1 ms pulse width), medium synchrony (10 ms pulse width), or low synchrony (19 ms pulse width). (B) Differential output firing rates (target-distractor) for target input frequencies maximizing output population frequency (i.e., for inputs at the fpop-resonant frequency) and distractor inputs with increasing strength (i.e., asynchronous input rate, rD). Differential output is plotted against (i) the strength of distractor input and (ii) the difference in population frequencies expected in the absence of competition (i.e., in an isolated PC/IN network). The blue shaded region highlights the range of responses where target output frequency exceeds the natural frequency expected for the distractor output; the green shaded region highlights the range where distractor output oscillates faster. The star and square in Bi mark distractor strengths that produce greater target and distractor outputs, respectively, and are used to investigate the effects of recurrent excitation. In all cases, the output with higher spike rate was the output with higher population frequency (i.e., a shorter period between spike volleys). (C) Recurrent excitation amplifies output differences for winner-take-all selection. (i) Without recurrent excitation, target output is greater despite the distractor receiving a 40% stronger input. This simulation corresponds to the point marked with a star in Bi. (ii) Recurrent excitation amplifies resonant bias producing winner-take-all dynamics that select the output driven by a weaker resonant input. (iii) Without recurrent excitation, distractor output is greater when it receives an asynchronous input that is 60% stronger than an opposing resonant input. This simulation corresponds to the point marked with a square in Bi. (iv) The response to an oscillatory target is suppressed when the stronger asynchronous input elicits a faster natural frequency.
Figure 6.
Figure 6.. Competition between oscillatory items: the most fpop-resonant item wins.
(A) Without lateral inhibition, relative spike outputs are determined by r¯PCT tuning curves in Figure 2Bii. (i) Circuit diagram showing two independent PC/IN networks without lateral inhibition. Both PC populations received oscillatory WM inputs with different modulation frequencies. The modulation frequency of items delivered to each PC population was varied from 18–36 Hz across simulations. Each pathway was arbitrarily labeled “Target” or “Distractor”. (ii) A binary image indicating whether the Target or Distractor PC population outputs more spikes across the simulation given oscillatory inputs at different frequencies. A black pixel indicates the Target population produced more spikes, whereas a white pixel indicates the Distractor population output more spikes. The circle marks the intersection of inputs at the r¯PCT-resonant frequency. The blue lines mark the fpop-resonant frequency. Whichever output is closer to peak r¯PCT produces more spikes when the circuits are disconnected. (B) With lateral inhibition, relative spike outputs are determined by fpop tuning curves in Figure 2Biii. (i) Circuit diagram showing two PC populations competing through lateral inhibition. The inputs were the same as in (A). (ii) Same plot as (Aii). Whichever output is closer to peak fpop produces more spikes when the output populations are connected through shared inhibitory interneurons. (C) Relative spike outputs with competition plotted against the relative population frequencies without competition. In most cases, the population with higher population frequency produces more spikes.
Figure 7.
Figure 7.. Nonspecific inputs can tune output resonance for switching between specific beta- and gamma-rhythmic pathways.
(A) A resonant beta input suppresses the response to a less resonant gamma-frequency input. (B) A nonspecific asynchronous input to both output populations shifts their resonant frequency to the gamma-range, causing the output layer to select the gamma-rhythmic input and suppress response to the less resonant beta input. (C) Tuning the network by varying modulation strength. (i) Firing rate of two, competing PC populations: one driven by a 25Hz oscillation (blue) and the other driven by a 35Hz oscillation (red). Solid and dashed lines show the mean and mean ± standard deviation, respectively. The strength of a nonspecific, modulatory (asynchronous) signal to both populations is increased from 0% to 350% of the background spiking. Without the signal, the 25Hz signal is exclusively propagated (i.e., always wins the competition). With strong modulation, the 35Hz signal is exclusively propagated. For intermediate levels of modulation, there may be spiking in either population at different points in time. (ii) Resonant frequency of the output gate plotted against nonspecific modulation to PCs of the gate. The thick solid line shows a linear fit. The thin horizontal lines mark the two input frequencies (solid) and the midpoint between them (dashed).
Figure 8.
Figure 8.. Oscillatory gating for population-coded signals.
(A) Resonant bias supports frequency-based gating of population rate-coded signals among parallel pathways. (i) Outputs of two pathways reflect the spatial pattern of firing rates across their inputs when both inputs are embedded in resonant oscillations. PC index represents linear indices of cells in a given output PC population. The spatial pattern of time-averaged firing rates across cells of the population is assumed to encode item information. Individual cells have low firing rates while the collective population is modulated at a faster frequency. Both WM items have the same modulation frequency. (ii) Frequency-based output gating: More resonant rate-coded signals suppress less-resonant rate-coded signals. WM items have the same spatial pattern of time-averaged firing rates as in (Ai), but now the frequency of faster time scale modulation differs between the two items; only the Target item has a modulation frequency that is resonant with the output gate. (B) Resonant bias supports frequency-based gating of rate-coded signals among convergent pathways. (i) Similar to (A) except both inputs converge on a single output population that reflects the approximate sum of the input signals in its spatial pattern of firing rates. (ii) A less resonant gamma-frequency signal is blocked from the output population.

References

    1. Adams NE, Sherfey JS, Kopell NJ, Whittington MA, and LeBeau FE (2017). Hetereogeneity in Neuronal Intrinsic Properties: A Possible Mechanism for Hub-Like Properties of the Rat Anterior Cingulate Cortex during Network Activity. eNeuro, 4(1). - PMC - PubMed
    1. Akam T and Kullmann DM (2010). Oscillations and Filtering Networks Support Flexible Routing of Information. Neuron, 67(2):308–320. - PMC - PubMed
    1. Amiez C, Joseph J-P, and Procyk E (2005). Anterior cingulate error-related activity is modulated by predicted reward. The European Journal of Neuroscience, 21(12):3447–3452. - PMC - PubMed
    1. Ardid S, Sherfey JS, McCarthy MM, Hass J, Pittman-Polletta BR, and Kopell N (2019). Biased competition in the absence of input bias revealed through corticostriatal computation. Proceedings of the National Academy of Sciences, 116(17):8564–8569. - PMC - PubMed
    1. Ardid S and Wang X-J (2013). A Tweaking Principle for Executive Control: Neuronal Circuit Mechanism for Rule-Based Task Switching and Conflict Resolution. Journal of Neuroscience, 33(50):19504–19517. - PMC - PubMed

Publication types