. 2020 Jun 19;5(48):eabc4466.
doi: 10.1126/sciimmunol.abc4466.

Rate of replenishment and microenvironment contribute to the sexually dimorphic phenotype and function of peritoneal macrophages

Affiliations

Rate of replenishment and microenvironment contribute to the sexually dimorphic phenotype and function of peritoneal macrophages

C C Bain et al. Sci Immunol. .

Abstract

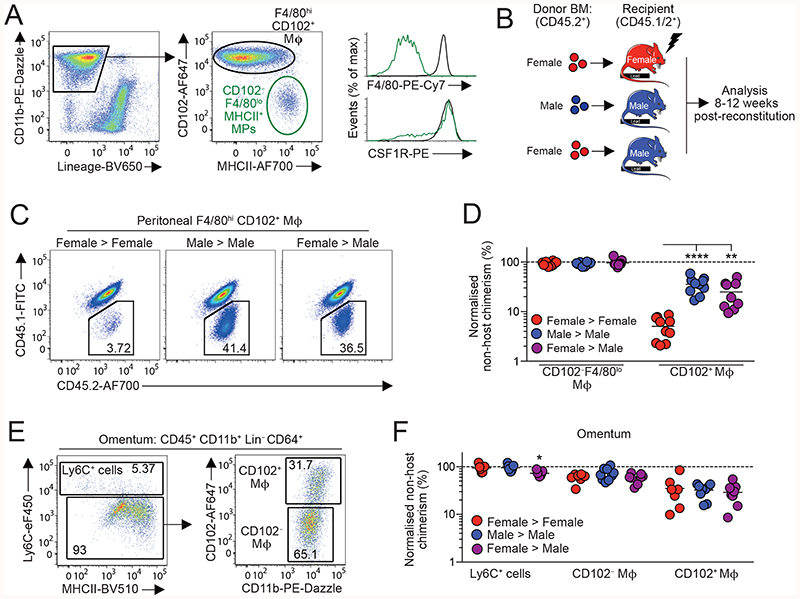
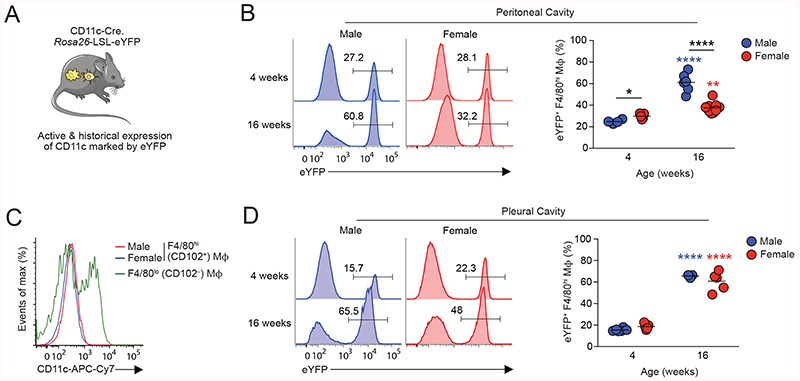
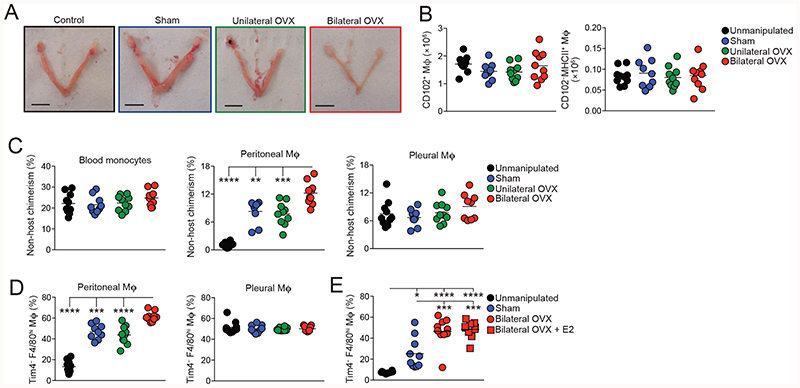
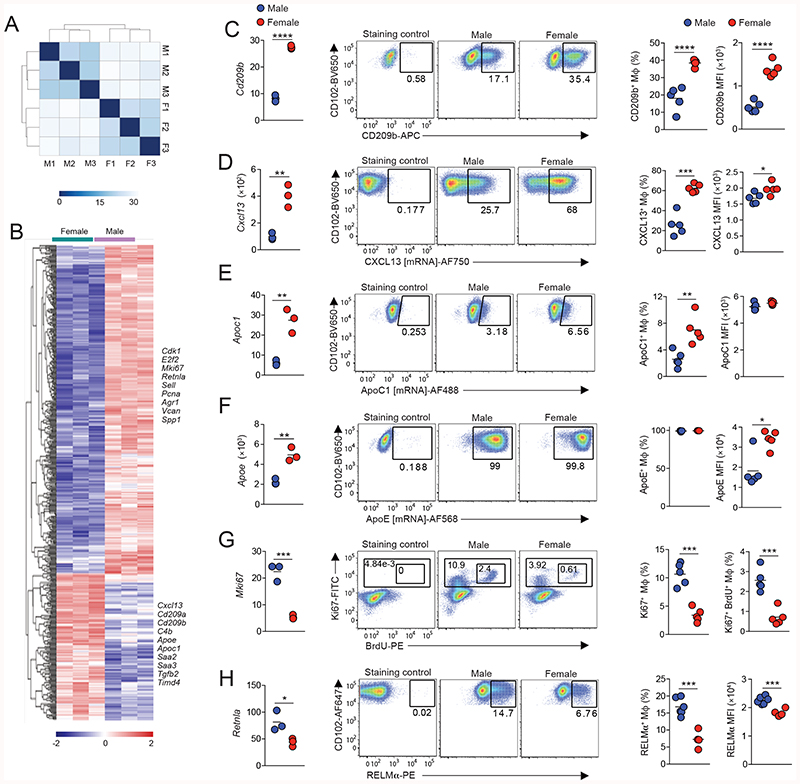
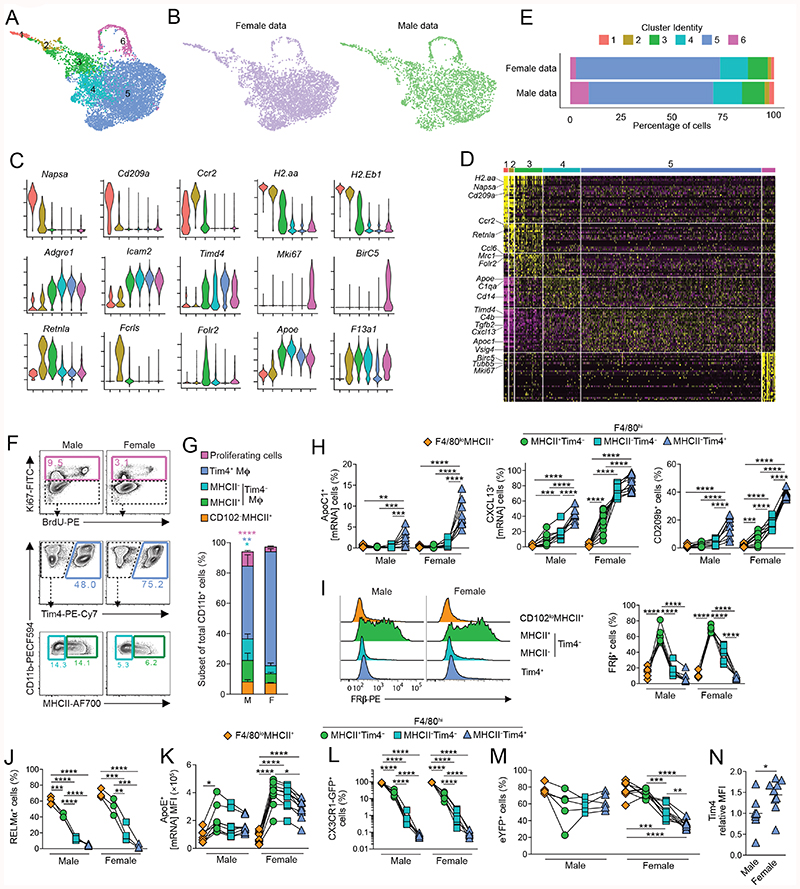
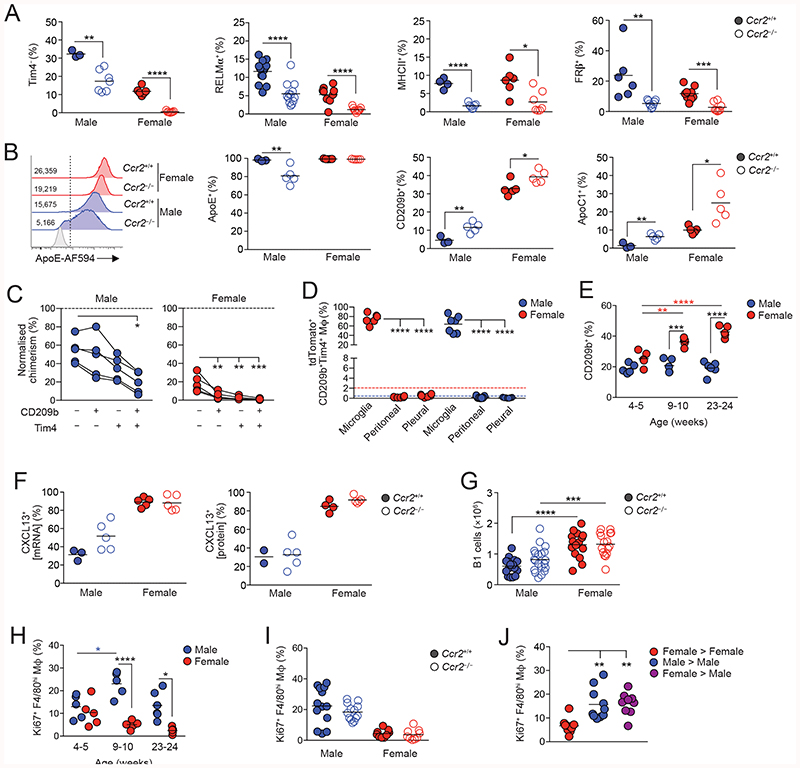
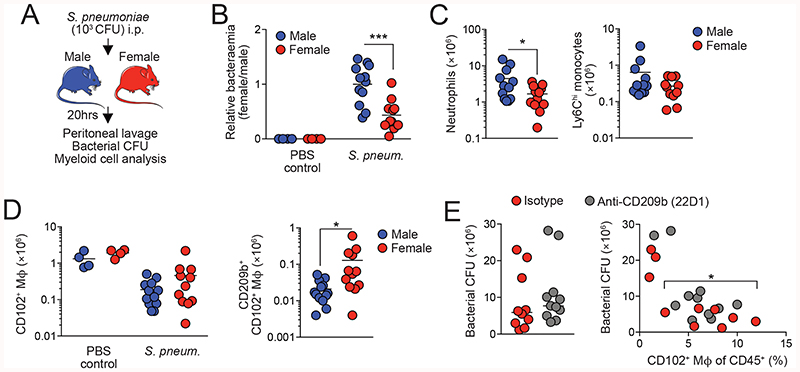
Macrophages reside in the body cavities where they maintain serosal homeostasis and provide immune surveillance. Peritoneal macrophages are implicated in the etiology of pathologies including peritonitis, endometriosis, and metastatic cancer; thus, understanding the factors that govern their behavior is vital. Using a combination of fate mapping techniques, we have investigated the impact of sex and age on murine peritoneal macrophage differentiation, turnover, and function. We demonstrate that the sexually dimorphic replenishment of peritoneal macrophages from the bone marrow, which is high in males and very low in females, is driven by changes in the local microenvironment that arise upon sexual maturation. Population and single-cell RNA sequencing revealed marked dimorphisms in gene expression between male and female peritoneal macrophages that was, in part, explained by differences in composition of these populations. By estimating the time of residency of different subsets within the cavity and assessing development of dimorphisms with age and in monocytopenic Ccr2 -/- mice, we demonstrate that key sex-dependent features of peritoneal macrophages are a function of the differential rate of replenishment from the bone marrow, whereas others are reliant on local microenvironment signals. We demonstrate that the dimorphic turnover of peritoneal macrophages contributes to differences in the ability to protect against pneumococcal peritonitis between the sexes. These data highlight the importance of considering both sex and age in susceptibility to inflammatory and infectious diseases.


Conflict of interest statement

Competing Interests:

The authors declare that they have no competing interests.

Figures

Figure 1
Figure 1. Environment drives sexual dimorphism in macrophage replenishment in the peritoneal cavity
(A) Expression of CD11b and CD3, CD19, Ly6G and SiglecF (‘Lineage’) by live CD45+ peritoneal leukocytes (left) and expression of CD102 and MHCII by CD11b+ Lin- cells (centre) from adult C57Bl/6 female mice. Histograms show expression of F4/80 and CSF1R by CD102+ and CD102-MHCII+ cells (also see Fig. S1A). (B) Scheme for the generation of sex mis-matched, tissue-protected bone marrow (BM) chimeric mice. (C-D) Representative chimerism (C) and normalized non-host chimerism (D) of peritoneal F4/80hiCD102+ macrophages from sex matched or mismatched tissue protected BM chimeric mice 8-12 weeks post-reconstitution (also see Fig. S1B). Data are normalised to the non-host chimerism of Ly6Chi monocytes. **P<0.01, ****P<0.0001 One-way ANOVA. Data represent 9 (female>male) or 10 (sex matched) mice per group pooled from two independent experiments. (E) Gating strategy to identify macrophages amongst omental isolates (also see Fig. S1D). (F) Normalized non-host chimerism of omental Ly6C+ monocytes and CD102-defined macrophages from mice in (D). Data are normalised to the non-host chimerism of Ly6Chi monocytes. Data represent 7 (female > female), 8 (female > male) or -9 (male > male) mice per group pooled from two independent experiments. *P<0.05. One-way ANOVA. Symbols represent individual animals and horizontal bars represent the mean.
Figure 2
Figure 2. Sexual dimorphism in peritoneal macrophage replenishment occurs following sexual maturity
(A) Experimental scheme of CD11cCre.Rosa26 LSL-eYFP fate-mapping mice. (B) Representative expression of eYFP by peritoneal F4/80hiCD102+ macrophages from male and female CD11cCre.Rosa26 LSL-eYFP fate-mapping mice at 4 and 16 weeks of age. Right, frequency of eYFP+ cells amongst F4/80hiCD102+ macrophages in male and female mice at the indicated ages. Symbols represent individual animals and horizontal bars represent the mean. Data represent 4 (male 4 weeks), 5 (female 4 weeks), 6 (male 16 weeks) or 9 (female 16 weeks) mice per group pooled from two independent experiments. For upstream gating strategy see Fig. S2A. (C) Expression of CD11c by peritoneal F4/80hiCD102+ macrophages from male and female and CD102- MHCII+ cells from female mice. (D) Representative expression of eYFP by pleural F4/80hiCD102+ macrophages from male and female CD11cCre.Rosa26 LSL-eYFP fate-mapping mice at 4 and 16 weeks of age. Right, frequency of eYFP+ cells amongst pleural F4/80hiCD102+ macrophages in male and female mice at the indicated ages. Symbols represent individual animals and horizontal bars represent the mean. Data represent 3 (male 16 weeks), 5 (female 4 & 16 weeks) or 6 (male 4 weeks) per group pooled from two independent experiments.
Figure 3
Figure 3. Ovariectomy leads to increased macrophage replenishment
(A) Representative images of the uterine horns of tissue-protected BM chimeric mice that had received unilateral or bilateral oophorectomy (OVX), sham surgery or were completely unmanipulated (control). (B) Absolute number of F4/80hiCD102+ macrophages and CD102-MHCII+ cells obtained from the peritoneal cavity of tissue-protected BM chimeric mice that had received surgery 8 weeks earlier. Symbols represent individual animals and horizontal bars represent the mean. Data represent 9 (sham) or 10 (control, unilateral, bilateral) mice per group pooled from two independent experiments. For upstream gating strategy see Fig. S2B. (C) Non-host chimerism of blood Ly6Chi blood monocytes (left) and F4/80hiCD102+ macrophages obtained from the peritoneal (centre) or pleural (right) cavity of tissue-protected BM chimeric mice that had received surgery 8 weeks earlier. Symbols represent individual animals and horizontal bars represent the mean. Data represent 9 (sham) or 10 (control, unilateral, bilateral) mice per group pooled from two independent experiments. **P<0.01, ***P<0.001, ****P<0.0001. One-way ANOVA with Tukey’s multiple comparisons test. (D) Frequency of Tim4- cells amongst F4/80hiCD102+ macrophages obtained from the peritoneal (centre) or pleural (right) cavity of mice in (B). ***P<0.001, ****P<0.0001. One-way ANOVA with Tukey’s multiple comparisons test. For representative FACS plots see Fig. S2C. (E) Frequency of Tim4- cells amongst F4/80hiCD102+ macrophages obtained from the peritoneal cavity of unmanipulated C57Bl/6 female mice (controls) or age-matched females that received bilateral OVX or sham surgery 4 weeks earlier. One group received exogeneous estradiol (E2) thrice weekly for 3 weeks. Symbols represent individual animals and horizontal bars represent the mean. Data represent 8 (control) or 10 (sham, bilateral, bilateral + E2) mice per group pooled from two independent experiments. *P<0.05, **P<0.01, ***P<0.001, ****P<0.0001. One-way ANOVA with Tukey’s multiple comparisons test.
Figure 4
Figure 4. Sex determines the transcriptional signature of peritoneal macrophages
(A) Heatmap showing distance between samples of male (M) and female (F) CD102+F4/80hi macrophages FACS-purified from the peritoneal cavity of 10-12 week old mice. (B) Gene expression profile of the 148 differentially expressed (>1.5 fold) genes between male and female peritoneal macrophages with selected genes highlighted. (C) Expression of Cd209b from RNAseq (FPKM; left panel), representative expression of CD209b protein (middle panels) and frequency of CD209b+ cells amongst CD102+F4/80hi peritoneal macrophages obtained from 10-12-week-old male or female C57BL/6 mice (right panel) and the mean fluorescence intensity (MFI) of CD209b expression by these cells (far right panel). Symbols represent individual animals and horizontal bars represent the mean. RNAseq data represent 3 mice per group and protein analysis represents 5 mice per group from one of five independent experiments. ****P<0.0001. Student’s t test. For gating strategy see Fig. S5C. (D) Expression of Cxcl13 from RNAseq (FPKM; left panel), representative expression of CXCL13 mRNA (middle panels) and frequency of CXCL13+ cells amongst CD102+F4/80hi peritoneal macrophages obtained from 10-12-week-old male or female C57BL/6 mice (right panel) and the mean fluorescence intensity (MFI) of CXCL13 mRNA expression by these cells (far right panel). Symbols represent individual animals and horizontal bars represent the mean. RNAseq data represent 3 mice per group and flow cytometric analysis represents 5 mice per group from one of three independent experiments. *P<0.05, ***P<0.001. Student’s t test. (E) Expression of Apoc1 from RNAseq (FPKM; left panel), representative expression of ApoC1 mRNA (middle panels) and frequency of ApoC1+ cells amongst CD102+F4/80hi peritoneal macrophages obtained from 10-12-week-old male or female C57BL/6 mice (right panel) and the mean fluorescence intensity (MFI) of ApoC1 mRNA expression by these cells (far right panel). Symbols represent individual animals and horizontal bars represent the mean. RNAseq data represent 3 mice per group and flow cytometric analysis represents 5 mice per group from one of three independent experiments. *P<0.05, ***P<0.001. Student’s t test. (F) Expression of Apoe from RNAseq (FPKM; left panel), representative expression of ApoE mRNA (middle panels) and frequency of ApoE+ cells amongst CD102+F4/80hi peritoneal macrophages obtained from 10-12-week-old male or female C57BL/6 mice (right panel) and the mean fluorescence intensity (MFI) of ApoE mRNA expression by these cells (far right panel). Symbols represent individual animals and horizontal bars represent the mean. RNAseq data represent 3 mice per group and flow cytometric analysis represents 5 mice per group from one of three independent experiments. *P<0.05, ***P<0.001. Student’s t test. (G) Expression of Mki67 from RNAseq (FPKM; left panel), representative expression of Ki67 protein and BrdU incorporation (middle panels) and the frequency of BrdU+Ki67+ cells amongst CD102+F4/80hi peritoneal macrophages obtained from 10-12-week-old male or female C57BL/6 mice. Symbols represent individual animals and horizontal bars represent the mean. Data represent 5 mice per group from one of two experiments. ***P<0.001. Student’s t test. (H) Expression of Retnla from RNAseq (FPKM; left panel), representative expression of RELMa protein (middle panels) and the frequency of RELMa+ cells amongst CD102+F4/80hi peritoneal macrophages obtained from 10-12-week-old male or female Rag1-/- C57BL/6 mice. Symbols represent individual animals and horizontal bars represent the mean. *P<0.05, ***P<0.001. Student’s t test.
Figure 5
Figure 5. scRNAseq analysis reveals dimorphic macrophage heterogeneity
(A) UMAP dimensionality reduction analysis of 4341 and 2564 number of cells from the peritoneal cavity of 19 week-old male or female mice identifying 6 clusters. (B) UMAP profile of female and male peritoneal cells. (C) Feature plots displaying expression of individual genes by merged female/male cells. (D) Heatmap displaying the 10 most differentially expressed genes by each cluster from A (select genes highlighted). (E) Relative frequency of each cluster in the female and male dataset. (F) Representative expression of Ki67 and BrdU incorporation by CD102+ macrophages (top panels), expression of Tim4 by Ki67- CD102+ macrophages (middle panels), and expression of MHCII by Tim4- CD102+ peritoneal macrophages from 10–12 week old male or female C57BL/6 mice. (G) Relative frequency of each cluster as a proportion of all CD11b+ cells determined by flow cytometry in F. (H) Expression of Apoc1 (mRNA), CXCL13 (mRNA) and CD209b protein by CD102loMHCII+ and Tim4/MHCII-defined CD102+ peritoneal macrophages from 10-12 week old male or female C57BL/6 mice. Data represent 8 (male) and 10 (female) mice per group pooled from three independent experiments. *P<0.05, **P<0.01, ***P<0.001, ****P<0.0001. One-way ANOVA with Tukey’s multiple comparisons test. (I) Histograms show representative expression of FRβ by CD102loMHCII+ and Tim4-defined CD102+ peritoneal macrophages from 10-12 week old male or female C57BL/6 mice. Scatter plot show frequency of FRβ+ cells amongst CD102loMHCII+ and Tim4/MHCII-defined CD102+ peritoneal macrophages. Data represent 6 (female) or 7 (male) mice per group pooled from two independent experiments. *P<0.05, **P<0.01, ***P<0.001, ****P<0.0001. One-way ANOVA with Tukey’s multiple comparisons test. (J) Expression of RELMa by CD102loMHCII+ and Tim4/MHCII-defined CD102+ peritoneal macrophages from 10 week old male or female C57BL/6 mice. Data represent 3 mice per group from one of at least 5 independent experiments **P<0.01, ***P<0.001, ****P<0.0001. One-way ANOVA with Tukey’s multiple comparisons test. (K) Frequency of ApoE+ (mRNA) cells amongst CD102loMHCII+ and Tim4/MHCII-defined CD102+ peritoneal macrophages (left) and mean fluorescence intensity of ApoE by these subsets (right) from 10-12 week old male or female C57BL/6 mice. Data represent 8 (male) and 10 (female) mice per group pooled from three independent experiments. *P<0.05, **P<0.01, ***P<0.001, ****P<0.0001. One-way ANOVA with Tukey’s multiple comparisons test. (L) Expression of CX3CR1-GFP by CD102loMHCII+ and Tim4/MHCII-defined CD102+ peritoneal macrophages from 15 week old male or female Cx3cr1+/gfp mice. Data represent 5 (female) or 7 (male) mice per group pooled from three independent litters. ****P<0.0001. One-way ANOVA with Tukey’s multiple comparisons test. (M) Frequency of eYFP+ cells amongst F4/80, MHCII and Tim4-defined macrophages obtained from 16- week-old male and female CD11cCre.Rosa26 LSL-eYFP mice. Symbols represent individual animals and horizontal bars represent the mean. Data represent 5 (male) or 9 (female) mice per group pooled from two independent experiments. (N) Relative mean fluorescence intensity of Tim4 expression by Tim4+ CD102+ peritoneal macrophages from 10-12 week old male or female C57BL/6 mice. Data represent 8 (male) or 11 (female) mice per group pooled from three independent experiments. *P<0.05. Mann Whitney test.
Figure 6
Figure 6. Differential replenishment and environmental signals drive the dimorphic features of peritoneal macrophages
(A) Frequency of Tim4-, RELMα+, and MHCII+ and RFβ’ cells amongst CD102+ macrophages from the peritoneal cavity of unmanipulated age-matched Ccr2 -/- or Ccr2 -/- mice. Symbols represent individual animals and horizontal bars represent the mean. Data are pooled from two independent experiments. Tim4 data represents 3 (Ccr2+/+ males), 6 (Ccr2 +/+ females) or 7 (Ccr2 -/-) 22-28 week old mice per group. RELMa data represent with 13 male and 9 female 14-18 week old mice per group. MHCII data represent 4 (Ccr2 +/+ males), 6 (Ccr2 +/+ females) or 7 (Ccr2 +/+) 22-28 week old mice per group. FRβ data represent 6 (Ccr2 +/+ males), 8 (Ccr2 +/+ females) or 9 (Ccr2 +/+ females and Ccr2 +/+ males) 13 week old mice per group. *P<0.05, **P<0.01, ****P<0.0001. Student’s t test with Holm-Sidak correction. (B) Representative expression of ApoE by CD102+ macrophages (histograms) and frequency of ApoE-, CD209b+ and ApoC1+ cells from the peritoneal cavity of unmanipulated age-matched Ccr2 +/+ or Ccr2 -/- mice. Symbols represent individual animals and horizontal bars represent the mean. Data are pooled from two independent experiments and represents 3 (Ccr2 +/+ males), 6 (Ccr2 +/+ females) or 7 (Ccr2 -/-) 22-28 week old mice per group. *P<0.05, **P<0.01. Student’s t test with Holm-Sidak correction. (C) Normalized non-host chimerism of CD209/Tim4-defined subsets of CD102+ macrophages from the peritoneal cavity of sex matched tissue-protected BM chimeric mice 8 weeks post-reconstitution. Data are normalised to the non-host chimerism of Ly6Chi monocytes. Data represent 5 mice per group from one experiment. *P<0.05, ***P<0.001. Paired Student’s t test. (D) Proportion of tdTomato+ (Ai14) cells amongst microglia, peritoneal and pleural macrophages from 15- week-old Cdh5 Cre-ERT2.Rosa26 LSL-Ai14.Cx3cr1 +/gfp mice administered 4-hydroxytamoxifen at E7.5. Data represent 6 (female) or 7 (male) mice per group from three independent litters. ****P<0.0001. One-way ANOVA followed by Tukey’s multiple comparisons test. (E) Frequency of cells expressing CD209b amongst CD102+ macrophages obtained from the peritoneal cavity of unmanipulated C57BL/6 mice of indicated ages. Symbols represent individual animals and horizontal bars represent the mean. *P<0.05, **P<0.01, ***P<0.001, ****P<0.0001. Two-way ANOVA with Sidak’s multiple comparisons test. (F) Frequency of cells expressing CXCL13 mRNA (left) or CXCL13 protein (right) amongst CD102+ macrophages obtained from the peritoneal cavity of unmanipulated 22-28 week old Ccr2++ or Ccr2 -/- mice. Symbols represent individual animals and horizontal bars represent the mean. CXCL13 mRNA data represents 3 (Ccr2 +/+ males), 5 (Ccr2 +/+ females) or 5 (Ccr2 -/-) mice per group. CXCL13 protein data represents 2 (Ccr2 +/+ males), 4 (Ccr2 +/+ females) or 5 (Ccr2 -/-) mice per group. (G) The absolute number of B1 cells obtained from the peritoneal cavity of unmanipulated age matched 14-28 week old Ccr2+/+ or Ccr2 -/- mice. Data represent 15 (Ccr22+/+ females), 16 (Ccr2 +/+ females), 17 (Ccr2 +/+ males) or 20 (Ccr2 +/+ females) mice per group pooled from four independent experiments. (H) Frequency of cells expressing Ki67 amongst F4/80hi macrophages obtained from the peritoneal cavity of unmanipulated C57BL/6 mice of indicated ages. Symbols represent individual animals and horizontal bars represent the mean. *P<0.05, ****P<0.0001. Two-way ANOVA with Tukey’s multiple comparisons test. (I) Frequency of Ki67+ cells amongst peritoneal F4/80hi macrophages obtained from the peritoneal cavity of unmanipulated 14-18 week old Ccr2 +/+ or Ccr2 +/+ mice. Data represents 15 (Ccr2 females), 16 (Ccr2 -/- females), 17 (Ccr2+/+ males) or 20 (Ccr2 +/+ females) mice per group pooled from 2 experiments. (J) Frequency of Ki67+ cells amongst peritoneal F4/80hi macrophages obtained from sex matched or mismatched tissue protected BM chimeric mice 8-12 weeks post-reconstitution. Data represent 9 (female > male) or 10 (sex matched groups) mice per group pooled from one of two independent experiments. **P<0.01. One-way ANOVA followed by Tukey’s multiple comparisons test.
Figure 7
Figure 7

Comment in

  • Peritoneal sex differences.
    Minton K. Minton K. Nat Rev Immunol. 2020 Aug;20(8):460-461. doi: 10.1038/s41577-020-0385-3. Nat Rev Immunol. 2020. PMID: 32612209 No abstract available.

References

    1. Bain CC, Jenkins SJ. The biology of serous cavity macrophages. Cell Immunol. 2018;330:126–135. - PubMed
    1. Ansel KM, Harris RBS, Cyster JG. CXCL13 is required for B1 cell homing, natural antibody production, and body cavity immunity. Immunity. 2002;16:67–76. - PubMed
    1. Roberts AW, et al. Tissue-Resident Macrophages Are Locally Programmed for Silent Clearance of Apoptotic Cells. Immunity. 2017;47:913–927.:e6. - PMC - PubMed
    1. Wang J, Kubes P. A Reservoir of Mature Cavity Macrophages that Can Rapidly Invade Visceral Organs to Affect Tissue Repair. Cell. 2016;165:668–678. - PubMed
    1. Rana N, et al. Basal and stimulated secretion of cytokines by peritoneal macrophages in women with endometriosis. Fertil Steril. 1996;65:925–930. - PubMed

Publication types