. 2020 Jun 30;117(26):14779-14789.
doi: 10.1073/pnas.2001404117. Epub 2020 Jun 19.

Label-free hematology analysis using deep-ultraviolet microscopy

Affiliations

Label-free hematology analysis using deep-ultraviolet microscopy

Ashkan Ojaghi et al. Proc Natl Acad Sci U S A. .

Abstract

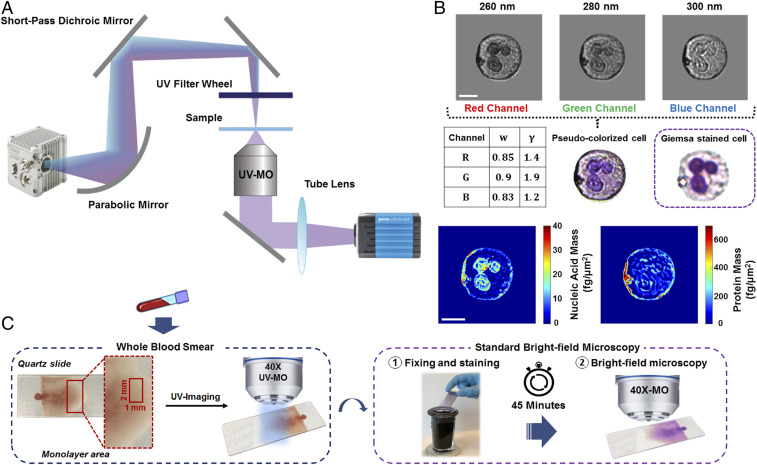
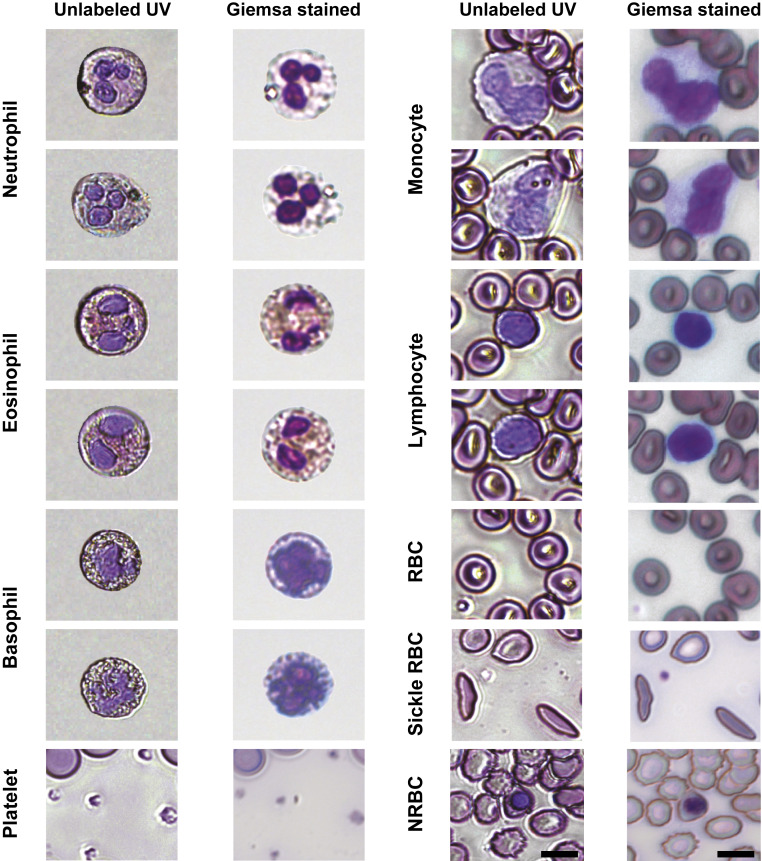
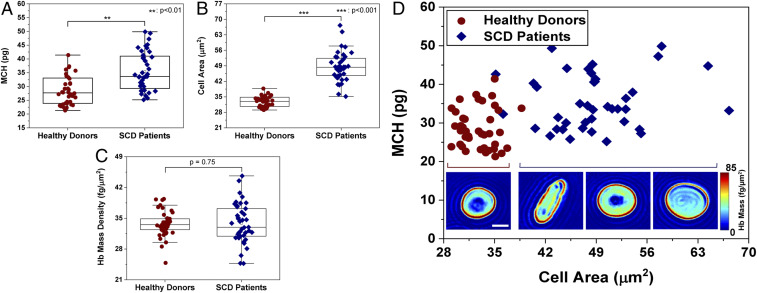
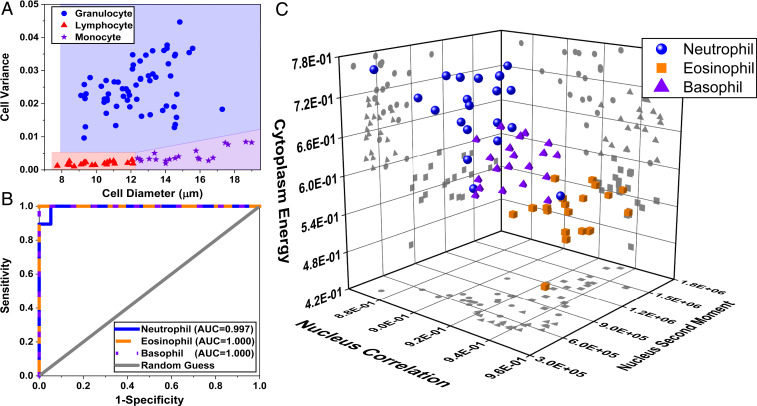
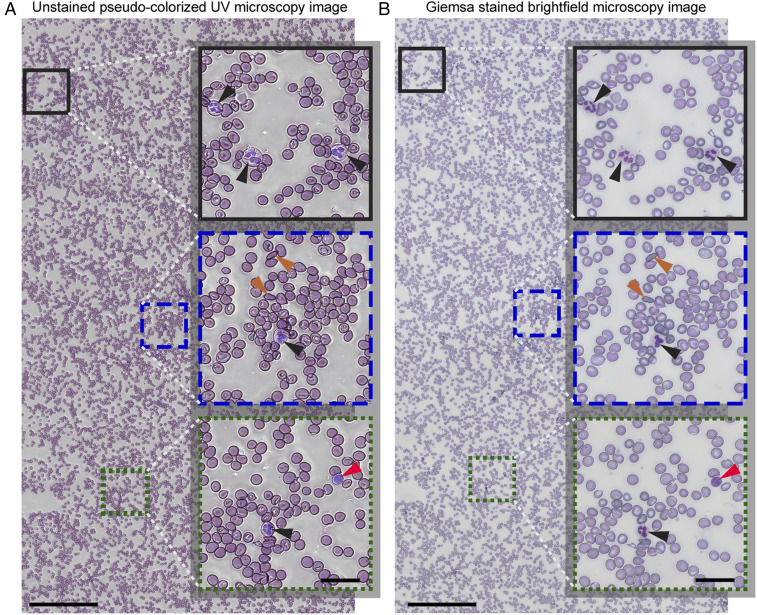
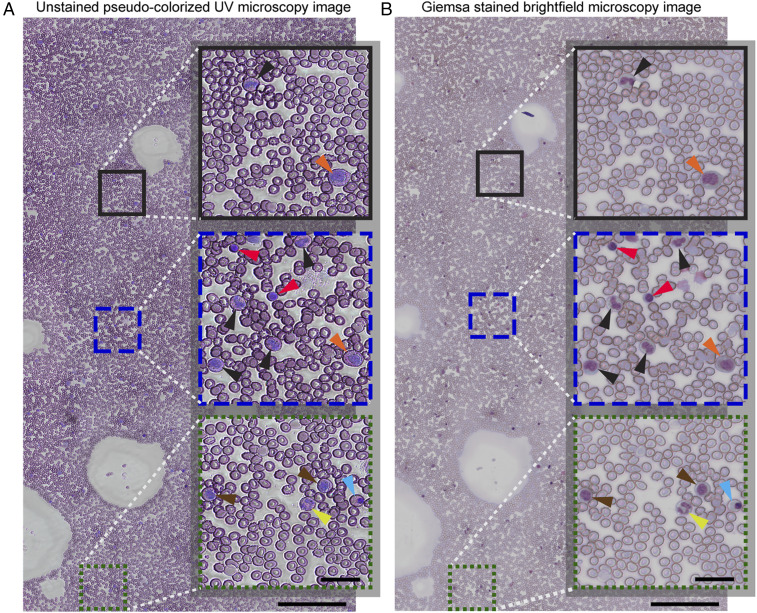
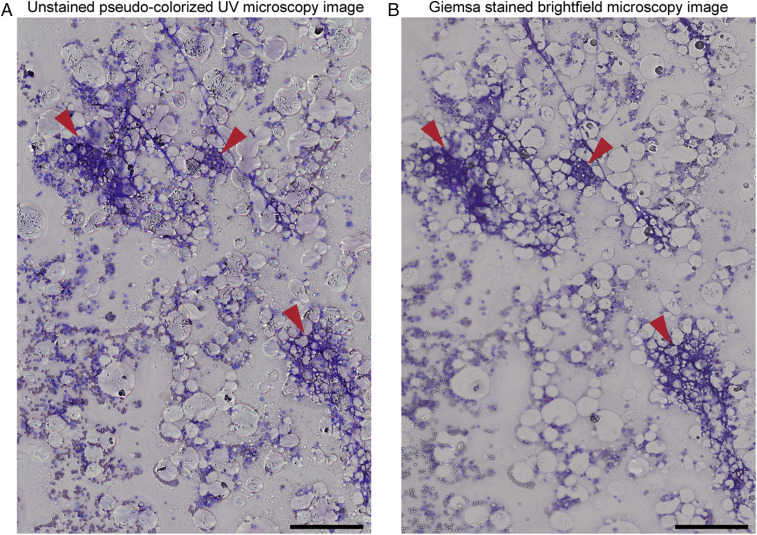
Hematological analysis, via a complete blood count (CBC) and microscopy, is critical for screening, diagnosing, and monitoring blood conditions and diseases but requires complex equipment, multiple chemical reagents, laborious system calibration and procedures, and highly trained personnel for operation. Here we introduce a hematological assay based on label-free molecular imaging with deep-ultraviolet microscopy that can provide fast quantitative information of key hematological parameters to facilitate and improve hematological analysis. We demonstrate that this label-free approach yields 1) a quantitative five-part white blood cell differential, 2) quantitative red blood cell and hemoglobin characterization, 3) clear identification of platelets, and 4) detailed subcellular morphology. Analysis of tens of thousands of live cells is achieved in minutes without any sample preparation. Finally, we introduce a pseudocolorization scheme that accurately recapitulates the appearance of cells under conventional staining protocols for microscopic analysis of blood smears and bone marrow aspirates. Diagnostic efficacy is evaluated by a panel of hematologists performing a blind analysis of blood smears from healthy donors and thrombocytopenic and sickle cell disease patients. This work has significant implications toward simplifying and improving CBC and blood smear analysis, which is currently performed manually via bright-field microscopy, and toward the development of a low-cost, easy-to-use, and fast hematological analyzer as a point-of-care device and for low-resource settings.

Keywords: deep-UV microscopy; hematology analysis; label-free cell classification; molecular imaging; point-of-care diagnosis.


Conflict of interest statement

The authors declare no competing interest.

Figures

Fig. 1.
Fig. 1.
System setup and method for UV microscopy of blood samples. (A) Schematic of the deep-UV microscope consisting of an ultrabroadband plasma source, short-pass dichroic mirror, UV band-pass filters, UV microscope objective, and UV-sensitive camera. (B) Pseudocolorization scheme with optimized weights and gamma values for each channel along with an example colorized UV and its respective Giemsa-stained bright-field image. Nucleic acid and protein mass maps of the same cell are also shown. (Scale bar: 5 µm.) (C) Schematic of the blood smear sample preparation and imaging protocol. Blood smears were imaged immediately with the UV system, then the smears were fixed, stained, and imaged with a conventional bright-field microscope for comparison.
Fig. 2.
Fig. 2.
Mosaic collection of different blood cell types as depicted by the label-free pseudocolorized UV images and the Giemsa-stained images of the same cells. (Scale bars: 7 µm.)
Fig. 3.
Fig. 3.
Hb characterization in healthy and sickled RBCs. (A) MCH values obtained from two healthy (n = 40) and two SCD patients (n = 40). (B) Cell area from healthy and SCD donors. (C) Average Hb mass per square area for healthy and SCD RBCs. (D) Scatter plot of MCH vs. cell area for healthy and SCD samples, with insets showing example RBC Hb mass maps (in femtograms per square micrometer). (Inset scale bar: 5 µm.)
Fig. 4.
Fig. 4.
Five-part WBC differential from label-free UV images. (A) Cellular intensity variance plotted against cell diameter to perform a three-part WBC differential with blue color representing the granulocytes, red for lymphocytes, and purple for monocytes. (B) ROC curves associated with our machine learning-based granulocyte classification, thereby providing a five-part WBC differential. (C) Scatter plot of the granulocyte subtypes based on the three top-ranked features.
Fig. 5.
Fig. 5.
Large-area (1 × 2 mm2) fixative-free, unstained, pseudocolorized UV image of a whole blood sample collected from an SCD patient (A) along with the corresponding bright-field microscopy image after fixing and staining (B). (Scale bars: 200 µm.) The selected magnified insets highlight cellular features with black arrowheads pointing to neutrophils, orange arrowheads showing the sickled RBCs, and the red arrowheads point to lymphocytes. (Inset scale bars: 30 µm.)
Fig. 6.
Fig. 6.
Wide-field unstained pseudocolorized UV image of a sample collected from the bone marrow of a healthy donor (A) along with the corresponding white-light bright-field microscopy image after staining (B). (Scale bars: 200 µm.) The selected magnified insets highlight cellular features of various myelopoietic and erythropoietic cells such as promyelocytes (orange arrowheads), myelocytes (brown arrowheads), metamyeloctes (black arrowheads), band neutrophils (yellow arrowheads), lymphocytes (red arrowheads), and normoblasts (blue arrowheads). (Inset scale bars: 30 µm.)
Fig. 7.
Fig. 7.
Wide-field unfixed and unstained pseudocolorized UV image of a spiculated bone marrow aspirate (A) and the corresponding white-light bright-field microscopy image after fixing and staining (B). The red arrowheads point to spicules present in the smear. (Scale bars: 200 µm.)

Similar articles

Cited by

References

    1. Honda T., Uehara T., Matsumoto G., Arai S., Sugano M., Neutrophil left shift and white blood cell count as markers of bacterial infection. Clin. Chim. Acta 457, 46–53 (2016). - PubMed
    1. van Wolfswinkel M. E. et al. ., Predictive value of lymphocytopenia and the neutrophil-lymphocyte count ratio for severe imported malaria. Malar. J. 12, 101 (2013). - PMC - PubMed
    1. Newman T. B., Draper D., Puopolo K. M., Wi S., Escobar G. J., Combining immature and total neutrophil counts to predict early onset sepsis in term and late preterm newborns: Use of the I/T2. Pediatr. Infect. Dis. J. 33, 798–802 (2014). - PMC - PubMed
    1. Velo-García A., Castro S. G., Isenberg D. A., The diagnosis and management of the haematologic manifestations of lupus. J. Autoimmun. 74, 139–160 (2016). - PubMed
    1. Crawford J., Dale D. C., Lyman G. H., Chemotherapy-induced neutropenia: Risks, consequences, and new directions for its management. Cancer 100, 228–237 (2004). - PubMed

Publication types

MeSH terms