. 2020 Jul 7;117(27):15862-15873.
doi: 10.1073/pnas.2004651117. Epub 2020 Jun 19.

A role for NPY-NPY2R signaling in albuminuric kidney disease

Affiliations

A role for NPY-NPY2R signaling in albuminuric kidney disease

Abigail C Lay et al. Proc Natl Acad Sci U S A. .

Abstract

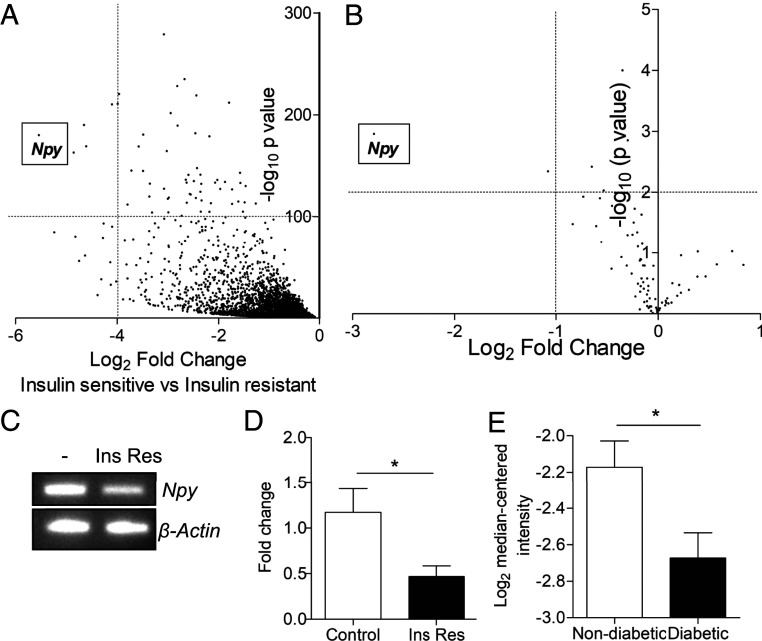
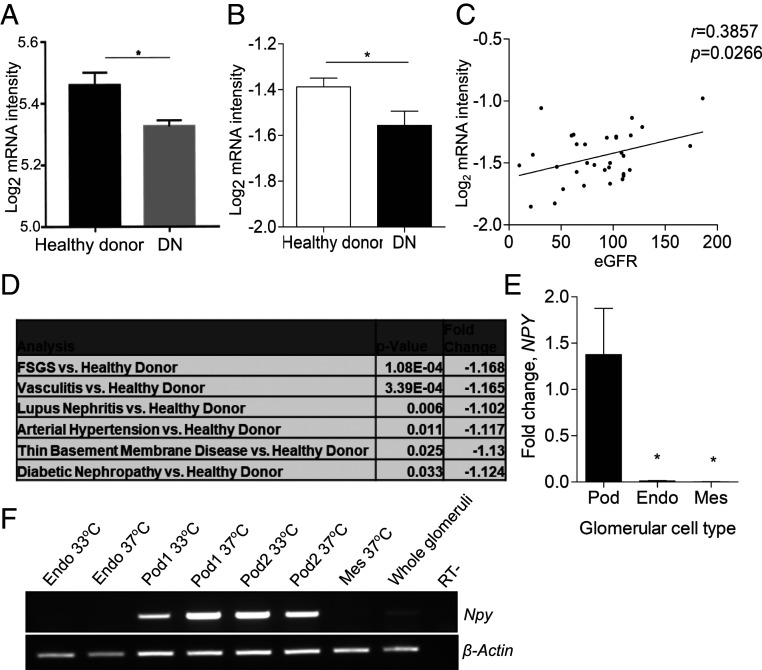
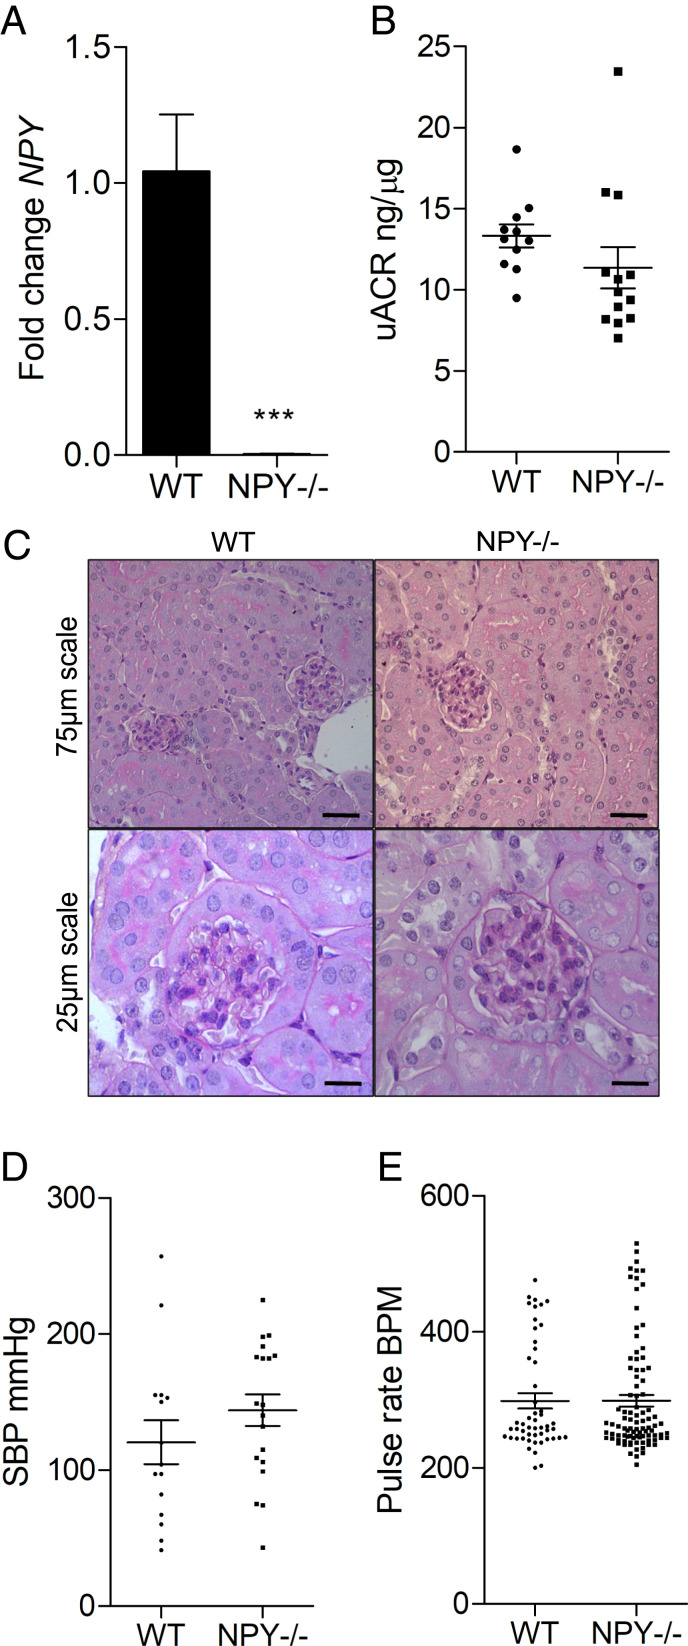
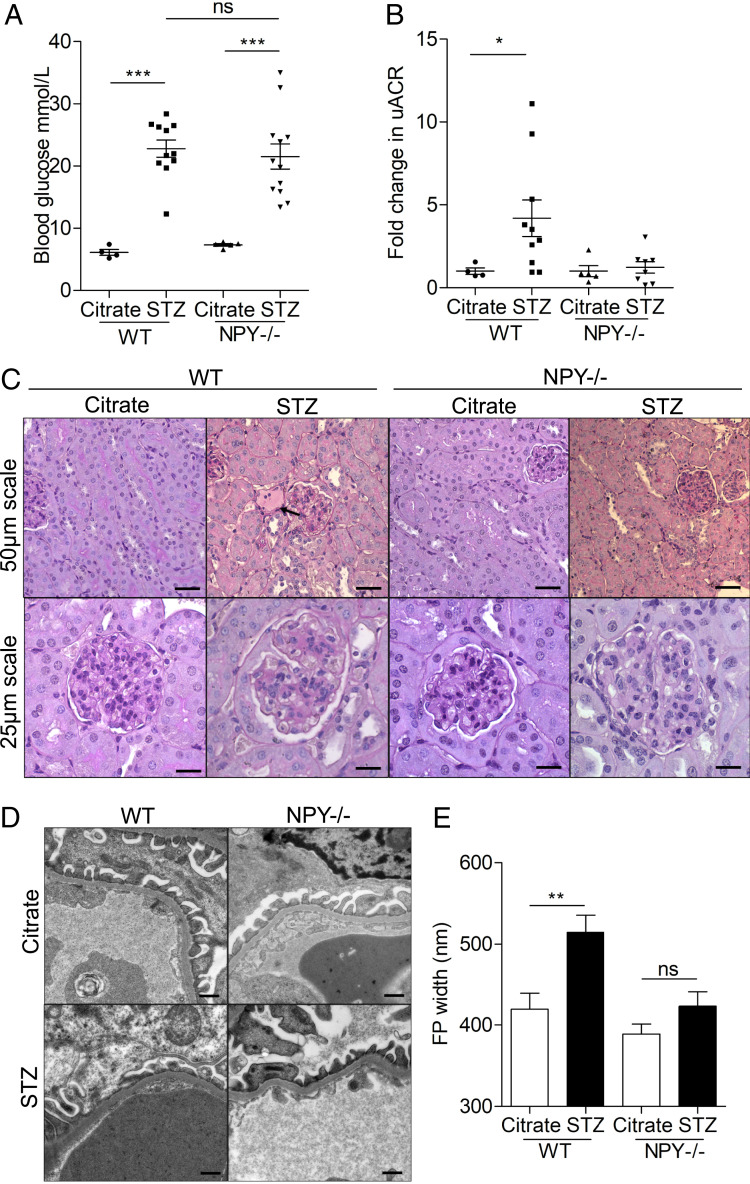
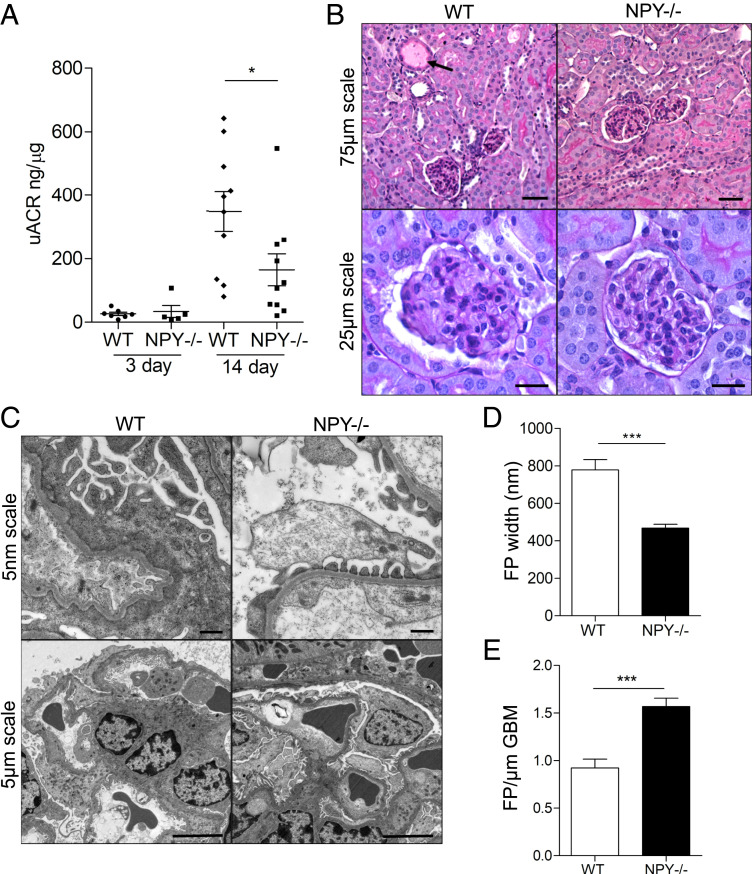
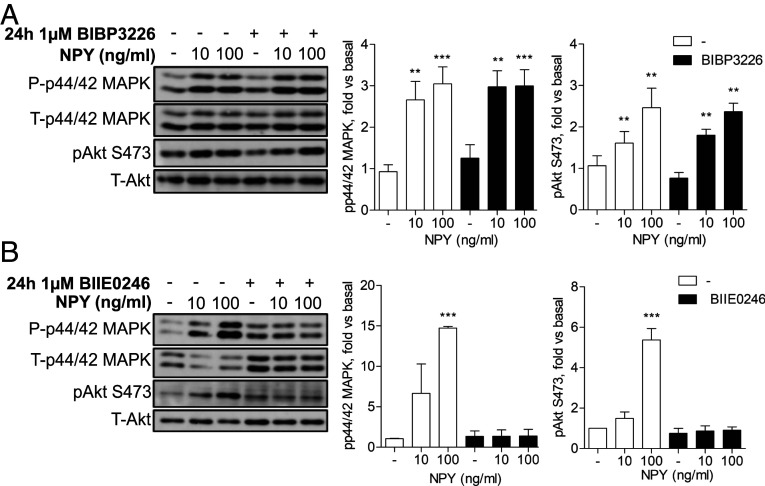
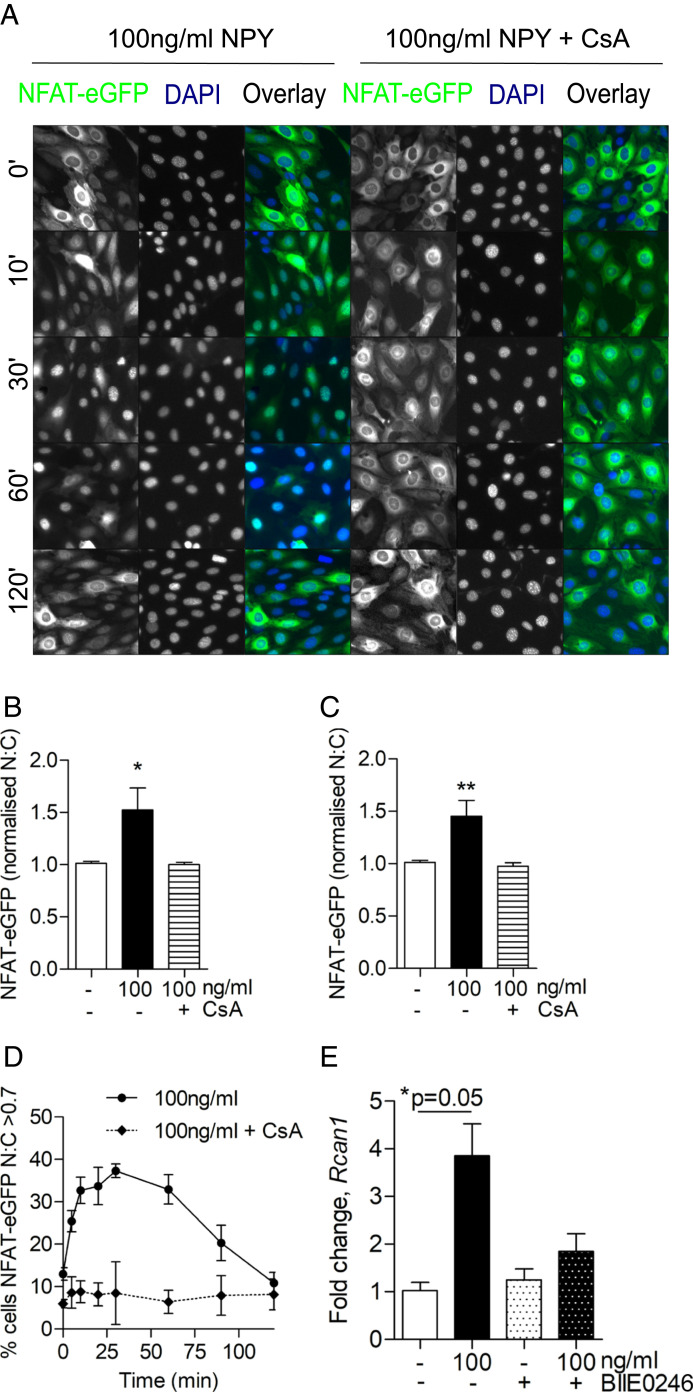
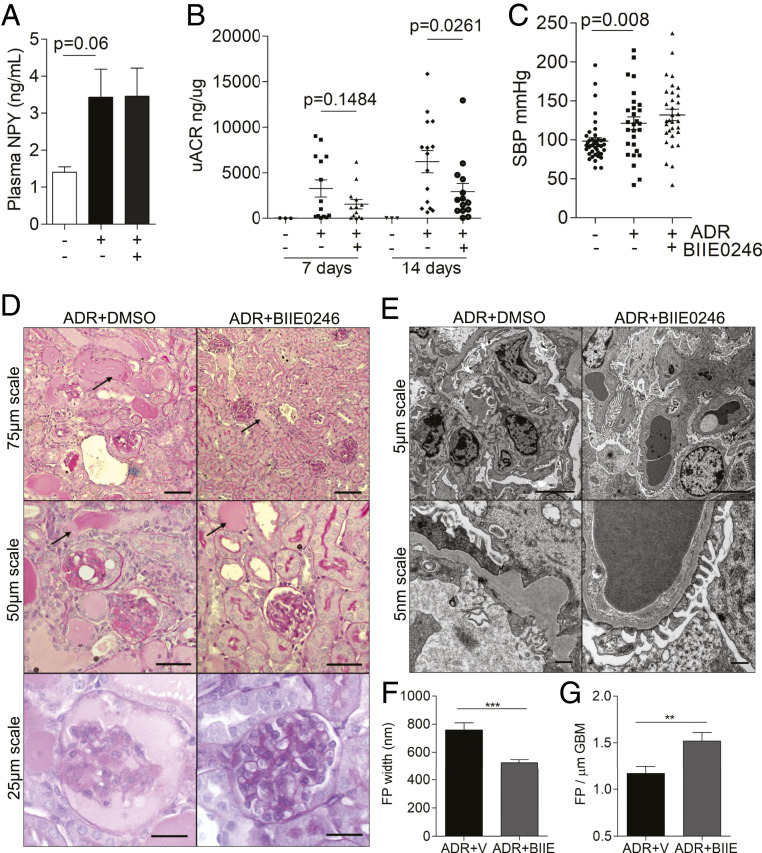
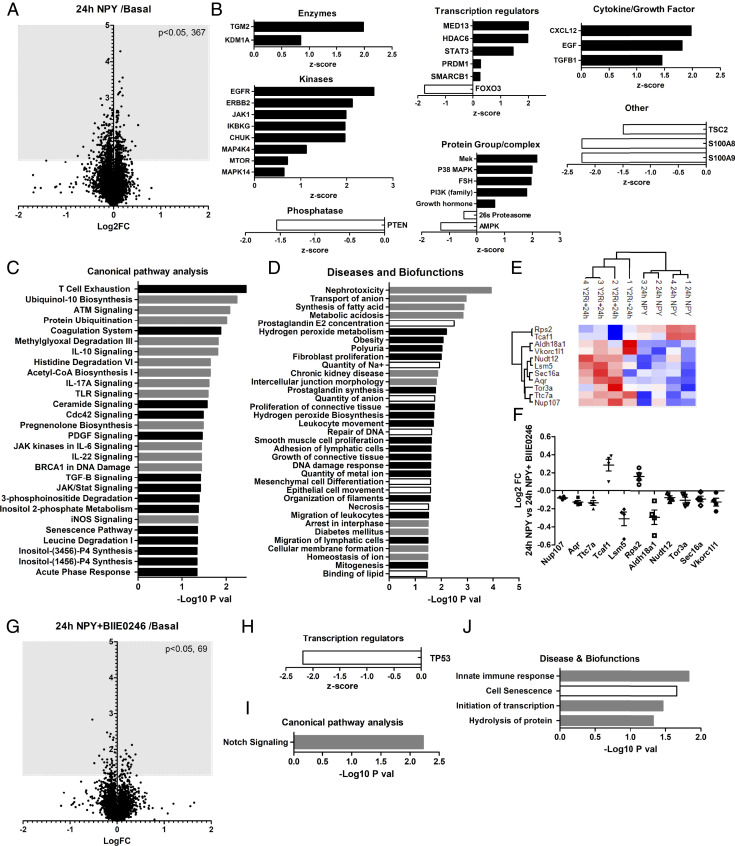
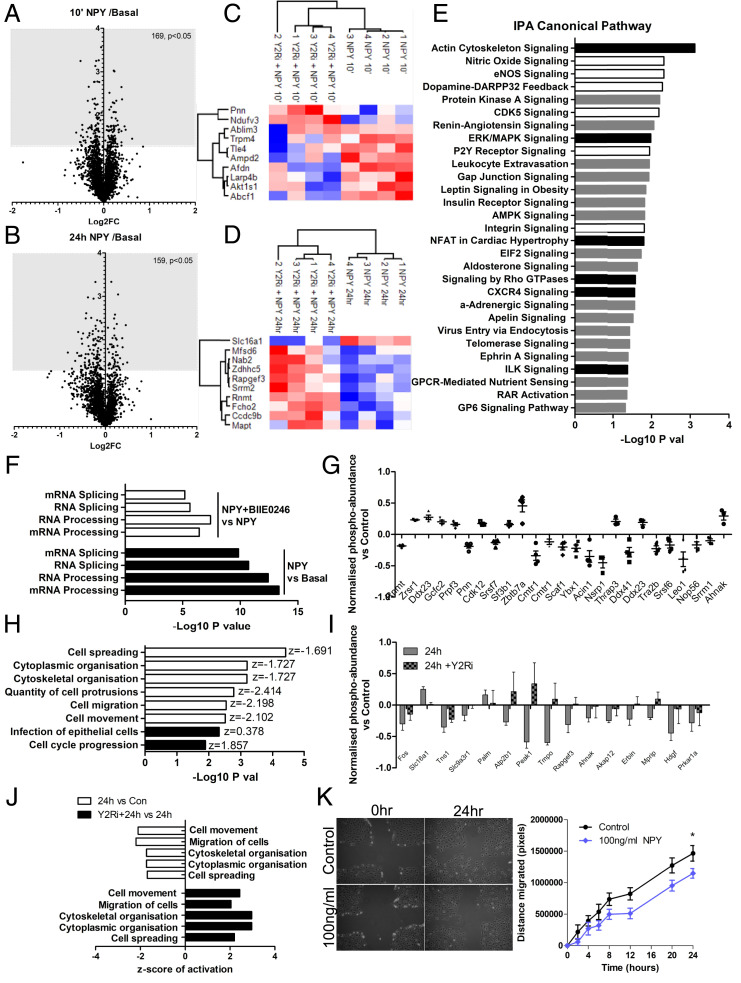
Albuminuria is an independent risk factor for the progression to end-stage kidney failure, cardiovascular morbidity, and premature death. As such, discovering signaling pathways that modulate albuminuria is desirable. Here, we studied the transcriptomes of podocytes, key cells in the prevention of albuminuria, under diabetic conditions. We found that Neuropeptide Y (NPY) was significantly down-regulated in insulin-resistant vs. insulin-sensitive mouse podocytes and in human glomeruli of patients with early and late-stage diabetic nephropathy, as well as other nondiabetic glomerular diseases. This contrasts with the increased plasma and urinary levels of NPY that are observed in such conditions. Studying NPY-knockout mice, we found that NPY deficiency in vivo surprisingly reduced the level of albuminuria and podocyte injury in models of both diabetic and nondiabetic kidney disease. In vitro, podocyte NPY signaling occurred via the NPY2 receptor (NPY2R), stimulating PI3K, MAPK, and NFAT activation. Additional unbiased proteomic analysis revealed that glomerular NPY-NPY2R signaling predicted nephrotoxicity, modulated RNA processing, and inhibited cell migration. Furthermore, pharmacologically inhibiting the NPY2R in vivo significantly reduced albuminuria in adriamycin-treated glomerulosclerotic mice. Our findings suggest a pathogenic role of excessive NPY-NPY2R signaling in the glomerulus and that inhibiting NPY-NPY2R signaling in albuminuric kidney disease has therapeutic potential.


Conflict of interest statement

The authors declare no competing interest.

Figures

Fig. 1.
Fig. 1.
Npy mRNA is significantly down-regulated in insulin-resistant podocytes and diabetic mouse glomeruli. (A) Genes down-regulated in insulin-resistant, compared with insulin-sensitive, mouse podocytes (podocytes exposed to 1 ng/mL TNFα, 1 ng/mL IL-6, 100 nmol/L insulin, and 25 mmol/L glucose or stably expressing the insulin receptor, respectively) identified by RNA sequencing. (B) Results of focused insulin signaling qPCR arrays performed on podocytes treated with 1 ng/mL TNF-α and IL-6, demonstrating a significant reduction in Npy expression following cytokine treatment; n = 3. (C) RT-PCR and (D) qPCR results confirming a reduction in Npy in insulin-resistant podocytes in vitro (Ins Res, following exposure to 1 ng/mL TNFα, 1 ng/mL IL-6, 100 nmol/L insulin, and 25 mmol/L glucose) (n = 5). *P < 0.05. (E) Data from Nephroseq. Npy expression (log2 median-centered intensity) in the Hodgin Diabetes Mouse Glom dataset sorted by fasting blood glucose: nondiabetic, defined as <300 mg/dL (n = 23) vs. diabetic, defined as >300 mg/dL (n = 16); under-expression gene rank 2,840 (in top 20%). *P < 0.05.
Fig. 2.
Fig. 2.
Glomerular NPY expression is significantly down-regulated in human renal disease. (A) NPY expression (log2 mRNA intensity) in Pima early diabetic nephropathy (DN, n = 69) vs. healthy living donors (n = 18). *P < 0.05. (B) Data from Nephroseq: NPY expression (log2 median-centered intensity) in the Ju CKD Glom dataset: healthy living donor (n = 21) and DN (n = 12); under-expression gene rank 3,211 (in top 19%). *P < 0.05. (C) Correlation between glomerular NPY expression (log2 median-centered intensity) and eGFR in the Ju CKD Glom dataset: healthy living donors and diabetic nephropathy, n = 33. (D) NPY expression (log2 median-centered mRNA intensity) in Ju CKD Glom, showing a significant regulation in glomerular NPY in FSGS (n = 46), vasculitis (n = 44), lupus nephritis (n = 53), arterial hypertension (n = 36), and thin basement membrane disease (n = 24) vs. healthy living donors. (E) qPCR results showing relative levels of NPY expression in human glomerular cell lines (Pod, podocytes; Endo, glomerular endothelial cells; Mes, mesangial cells); n = 3 to 5; *P < 0.05. (F) RT-PCR for NPY and β-Actin in human glomerular cell lines under conditions of active (33 °C) and inactive (37 °C) SV40 expression (Endo, glomerular endothelial cells; Pod1 and Pod2, two independent human podocyte cell lines; Mes, mesangial cells) and isolated human glomeruli.
Fig. 3.
Fig. 3.
Glomerular structure and function is normal in NPY−/− mice under basal conditions. (A) No detection of Npy transcript in kidneys from NPY−/− mice, compared with WT control kidney tissue, using qPCR; n = 3 per group. ***P < 0.001. (B) uACRs in WT (n = 11) and NPY−/− mice (n = 13). (C) Periodic acid–Schiff (PAS) staining of kidney tissue from WT and NPY−/− mice at 4 mo of age confirmed no significant histological abnormalities in these animals (n = 4 per group). (D) SBP measurements and (E) pulse rate (beats per minute, BPM) in WT (n = 3) and NPY−/− (n = 4) mice, 5 to 10 inflation cycles per mouse.
Fig. 4.
Fig. 4.
STZ-treated NPY−/− mice are protected from albuminuria and podocyte damage. Diabetes was induced in male NPY knockout (NPY−/−) 129/Sv and WT 129/Sv mice aged 6 to 8 wk with i.p. injections of 50 mg/kg STZ dissolved in sodium citrate buffer (pH 4.5) for 5 consecutive days. Tissue was collected 24 wk after administration of STZ. (A) Nonfasted blood glucose was significantly higher in both WT and NPY−/− animals from 8 wk after STZ injection; ***P < 0.001, with no differences between the two diabetic groups. (B) A significant increase in the uACR in STZ-treated WT mice 24 wk after injection. *P = 0.036 WT STZ (n = 10) vs. WT Citrate (n = 4), no significant increase in STZ-treated NPY−/− animals (n = 8) when compared with NPY−/− citrate-treated mice (n = 5). (C) PAS staining presented evidence of sclerosis in some glomeruli of each diabetic cohort, and small protein casts could be seen in tubules of each model (black arrow). (Scale bar, 25 μm.) (D) Electron microscopy (EM) images of STZ-treated WT and NPY−/− mice. (Scale bar, 500 nm.) (E) Quantification of podocyte FP width as a measurement of effacement; n = 3 mice per experimental group, >20 regions per mouse; **P < 0.01.
Fig. 5.
Fig. 5.
NPY−/− mice are protected from albuminuria and podocyte damage in low-dose adriamycin nephropathy. Adriamycin was administered to male NPY knockout (NPY−/−) 129/Sv and WT 129/Sv mice at 6 mg/kg via a single i.v. injection under mild anesthesia. Tissue was collected 14 d following adriamycin injection. (A) uACRs were significantly lower in the NPY−/− AN group compared with WT AN mice (*P < 0.05, n = 7 WT 3 d, n = 5 NPY−/− 3 d, n = 10 WT 14 d, n = 10 NPY−/− 14 d); (B) PAS staining demonstrated evidence of sclerosis in some glomeruli of each AN group with mild tubular dilation and protein casts in WT AN mice (black arrow). (C) EM images of WT and NPY−/− AN mice. (D) Quantification of podocyte FP width. (E) The number of FPs per glomerular basement membrane (GBM) length as a measurement of effacement, demonstrating a significant reduction in FP effacement in NPY−/− AN compared with WT AN mice (***P < 0.001 n = 3/group, >20 regions per mouse).
Fig. 6.
Fig. 6.
Podocytes respond to NPY in an NPY2R-dependent manner. (A) Representative Western blots and densitometry of differentiated mouse podocytes treated with the Y1 receptor antagonist BIBP3226 at 1 μM for 24 h prior to stimulation with 10 and 100 ng/mL NPY for 15 min, n = 4. **P < 0.01 and ***P < 0.001 vs. unstimulated, one-way ANOVA, Tukey’s multiple comparison. (B) Representative Western blots and densitometry of differentiated mouse podocytes treated with the Y2 receptor antagonist BIIE0246 (1 μM) for 24 h prior to stimulation with 10 and 100 ng/mL NPY for 15 min, n = 4. ***P < 0.001 vs. unstimulated, one-way ANOVA, Tukey’s multiple comparison.
Fig. 7.
Fig. 7.
NPY stimulates calcium-dependent NFAT activation in podocytes. Podocytes were transfected with NFAT-eGFP and stimulated with 100 ng/mL of NPY at indicated time points before fixation and DAPI staining. Where indicated, 10 μM CsA was added 15 min prior to NPY stimulation. Modest changes in brightness and contrast were applied to all images for visual purposes; unmodified images were used for quantification. (A) Representative fluorescent images. (B and C) Population average values for NFAT-eGFP nuclear:cytoplasmic (N:C) ratios derived from arbitrary fluorescence unit measurements of NFAT-eGFP intensity in nuclear and cytoplasmic compartments and normalized to control (time 0), demonstrating a significant increase in N:C NFAT-eGFP at (B) 30 min and (C) 60 min post stimulation. *P < 0.05 and **P < 0.01, Mann–Whitney U test; no significant differences were observed with CsA pretreatment; n = 3; each condition was tested in triplicate. (D) Percentage of activated cells (where N:C of individual cells >0.7) in whole-cell populations over time; n = 3. (E) qPCR results demonstrating fold change in regulator of calcineurin 1 (Rcan1) expression following NPY stimulation, with and without costimulation of the Y2 receptor antagonist, BIIE0246, at 1 μM for 24 h; *P = 0.05, Mann–Whitney U test; n = 3.
Fig. 8.
Fig. 8.
BIIE0246 treatment reduces albuminuria in ADR nephropathy. Adriamycin was administered to male BALB/c mice at 6 mg/kg via a single i.v. injection under mild anesthesia, and the effects of NPY2R inhibition were investigated. Control mice were treated with equivalent volumes of distilled water (adriamycin vehicle) and dimethylsulfoxide (BIIE0246 vehicle). (A) Plasma NPY levels (ng/mL) in male BALB/c mice treated with adriamycin (n = 8) or adriamycin in combination with the NPY2R antagonist BIIE0246 (n = 4). (B) uACRs in mice treated with adriamycin (n = 15), adriamycin plus the NPY2R antagonist BIIE0246 (n = 14), or vehicle (n = 3). A significant reduction in albuminuria is observed in the ADR+BIIE0246 group, compared with ADR+Vehicle group at 14 d. (C) A significant increase in SBP was observed in ADR-treated mice (**P = 0.0087) which was not influenced by NPY2R inhibition (P = 0.3260). (D) PAS staining demonstrating a reduction in the severity and extent of glomerular sclerosis and tubular dilation/protein accumulation in the ADR+BIIE0246 mice, although evidence of tubular dilation and protein casts can be seen in both ADR-treated groups (black arrows). (E) EM images of ADR+Vehicle- and ADR+BIIE0246-treated mice, demonstrating a significant loss of podocyte architecture. (F) Quantification of FP width. ***P < 0.001. (G) Number of FPs per GBM length, indicating a significant reduction in FP effacement in ADR+BIIE0246-treated mice compared to ADR+Vehicle treatment; n = 3 mice >20 regions per mouse. **P < 0.01.
Fig. 9.
Fig. 9.
Total proteomic analysis of mouse glomeruli treated with NPY ex vivo. Glomeruli were isolated and treated with NPY (100 ng/mL for 24 h) with or without NPY2R inhibition (1 μM BIIE0246 for 24 h). (A) Changes in the total glomerular proteome following 24 h of NPY stimulation compared with basal (control) glomeruli; Log2 fold change (FC) vs. −log10 P value of the scaled abundances. (B) Prediction of the upstream regulators of glomerular protein changes after 24 h of NPY treatment determined by IPA; positive z-score: predicted activation; negative z-score: predicted inhibition. (C) Canonical pathway and (D) Diseases and Biofunctions significantly enriched in mouse glomeruli treated with NPY for 24 h, which were not enriched in NPY+BIIE0246-treated glomeruli, determined by IPA. Black bars: predicted activation; white bars: predicted inhibition; gray bars: no activity information predicted. (E) Heat map and hierarchical clustering of z-scored scaled abundances normalized to basal values, demonstrating significant protein changes (24 h NPY) that are inhibited by BIIE0246 treatment. (F) Log2 FC of scaled protein abundances at 24 h NPY relative to NPY+BIIE0246 treatment. (G) Changes in the total glomerular proteome following 24 h of NPY + BIIE0246 treatment compared with basal; Log2 FC vs. −log10 P value of the scaled abundances. Nine proteins found to be significantly regulated by BIIE0246 treatment alone were excluded from the analysis. (H) TP53 was highlighted as a significantly inhibited upstream regulator of protein changes observed in NPY+BIIE0246-treated glomeruli. (I) “Notch signalling” was a significantly enriched canonical pathway. (J) Significantly enriched diseases and biofunctions where three or more molecules were used to make the prediction.
Fig. 10.
Fig. 10.
Phospho-proteomic analysis of NPY-NPY2R signaling in mouse glomeruli. Glomeruli were isolated and treated with NPY (100 ng/mL for 10 min or 24 h) with or without NPY2R inhibition (1 μM BIIE0246 for 24 h). (A) Changes in the glomerular phospho-proteome following 10 min of stimulation (10′ NPY) compared with basal (control) glomeruli, Log2 FC vs. −log10 P value of the normalized phospho-peptide abundances. (B) Changes in the glomerular phospho-proteome following 24 h of NPY stimulation (24 h NPY) compared with basal (control) glomeruli, Log2 FC vs. −log10 P value of the normalized phospho-peptide abundances. (C) Heat map and unsupervised clustering of z-scored normalized phospho-peptide abundances, relative to basal conditions within each experiment, showing the top 10 glomerular proteins significantly phosphorylated at 10 min and (D) 24 h of NPY treatment that was also inhibited by NPY2R inhibition. (E) Significantly enriched Canonical Pathways based on significantly changed phospho-peptides at 10′ NPY compared with basal, which were not enriched in NPY+BIIE0246-treated glomeruli. Black bars: predicted activation; white bars: predicted inhibition; gray bars: no activity information predicted. (F) Disease and Biofunction analysis in IPA predicted a significant enrichment and activation of RNA processing in glomeruli at 10′ NPY (black bars: positive activation z-score) and a significant inhibition in 10′ NPY+BIIE0246-treated glomeruli when compared with 10′ NPY treatment alone (white bars: negative activation z-score). (G) Top 25 proteins with phospho-sites regulated by 10′ NPY that are involved in RNA processing; bar chart demonstrates the normalized phospho-peptide abundance ratios, relative to basal levels. (H) Disease and biofunction predicted to be enriched in glomeruli at both 10 min and 24 h NPY, showing a sustained inhibition of cell migratory responses (white bars, negative z-score). Diseases and biofunctions were filtered to exclude those where fewer than four phospho-peptides were used to make the predictions and where predicted activation/inhibition was inconsistent between 10 min and 24 h. Data presented are for 24-h NPY-treated glomeruli. (I) Top 15 proteins with phospho-sites regulated by 24-h NPY stimulation, which are sensitive to BIIE0246 treatment and are involved in cell motility; bar chart demonstrates the normalized phospho-peptide abundance ratios relative to basal levels. (J) Disease and biofunction predictions showing a significant enrichment and inhibition of cell migratory responses in glomeruli following NPY treatment when compared with basal (white bars: negative z-score) and a significant enrichment and activation in NPY+BIIE0246-treated glomeruli when compared with NPY treatment alone (black bars: positive z-score). (K) Representative images taken at baseline and 24 h following NPY stimulation and quantification of the migratory response. The area of the clear zone was measured in pixels for each condition and compared to the area at time 0; *P < 0.05, one-way ANOVA, Tukey’s multiple comparison; n = 3, 4 replicates per condition.

References

    1. Eckardt K. U., et al. ., Evolving importance of kidney disease: From subspecialty to global health burden. Lancet 382, 158–169 (2013). - PubMed
    1. Matsushita K.et al. .; Chronic Kidney Disease Prognosis Consortium , Association of estimated glomerular filtration rate and albuminuria with all-cause and cardiovascular mortality in general population cohorts: A collaborative meta-analysis. Lancet 375, 2073–2081 (2010). - PMC - PubMed
    1. Mogensen C. E., Microalbuminuria predicts clinical proteinuria and early mortality in maturity-onset diabetes. N. Engl. J. Med. 310, 356–360 (1984). - PubMed
    1. Tryggvason K., Patrakka J., Wartiovaara J., Hereditary proteinuria syndromes and mechanisms of proteinuria. N. Engl. J. Med. 354, 1387–1401 (2006). - PubMed
    1. Pagtalunan M. E., et al. ., Podocyte loss and progressive glomerular injury in type II diabetes. J. Clin. Invest. 99, 342–348 (1997). - PMC - PubMed

Publication types

MeSH terms