. 2020 Jun 19;11(1):3115.
doi: 10.1038/s41467-020-16637-3.

miR2118-dependent U-rich phasiRNA production in rice anther wall development

Affiliations

miR2118-dependent U-rich phasiRNA production in rice anther wall development

Saori Araki et al. Nat Commun. .

Abstract

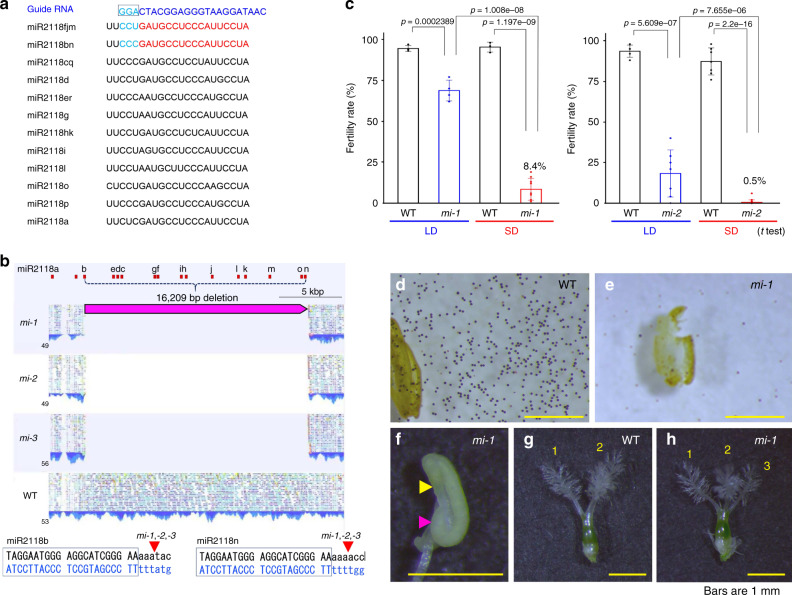
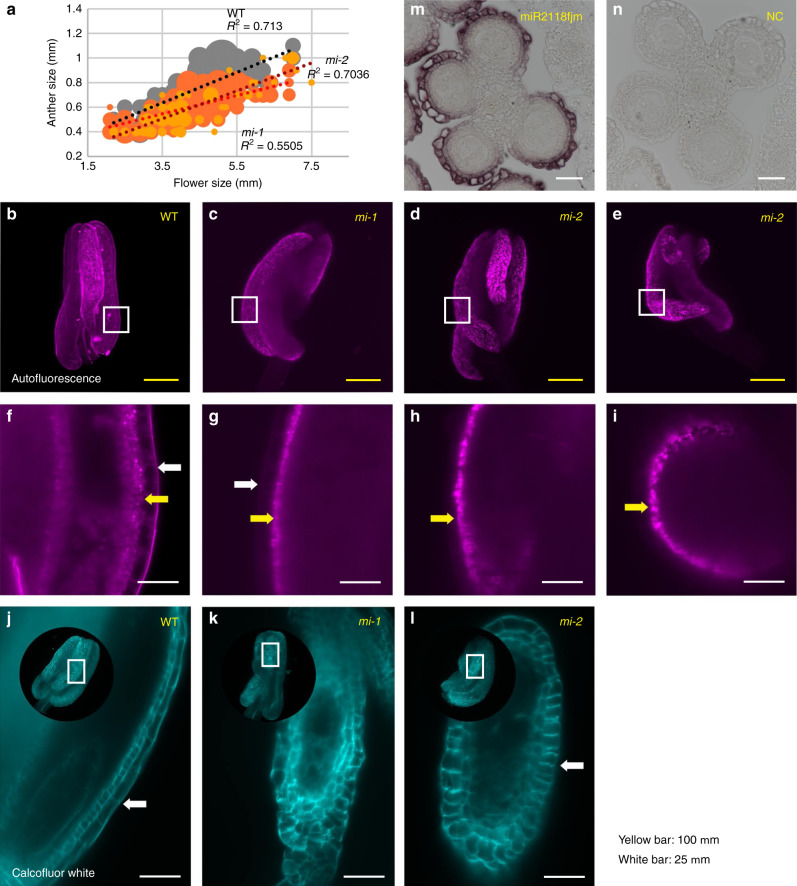
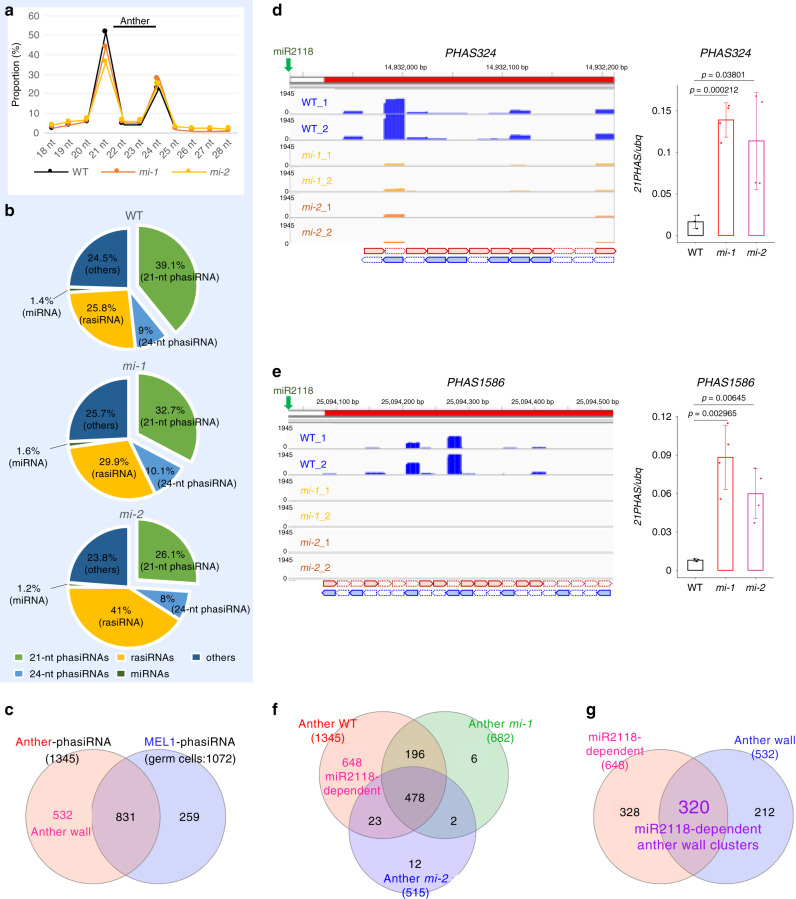
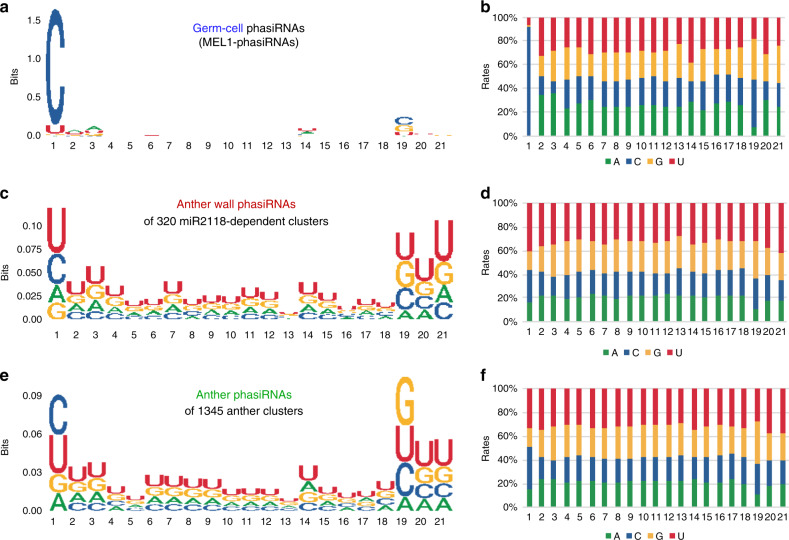
Reproduction-specific small RNAs are vital regulators of germline development in animals and plants. MicroRNA2118 (miR2118) is conserved in plants and induces the production of phased small interfering RNAs (phasiRNAs). To reveal the biological functions of miR2118, we describe here rice mutants with large deletions of the miR2118 cluster. Our results demonstrate that the loss of miR2118 causes severe male and female sterility in rice, associated with marked morphological and developmental abnormalities in somatic anther wall cells. Small RNA profiling reveals that miR2118-dependent 21-nucleotide (nt) phasiRNAs in the anther wall are U-rich, distinct from the phasiRNAs in germ cells. Furthermore, the miR2118-dependent biogenesis of 21-nt phasiRNAs may involve the Argonaute proteins OsAGO1b/OsAGO1d, which are abundant in anther wall cell layers. Our study highlights the site-specific differences of phasiRNAs between somatic anther wall and germ cells, and demonstrates the significance of miR2118/U-phasiRNA functions in anther wall development and rice reproduction.


Conflict of interest statement

The authors declare no competing interests.

Figures

Fig. 1
Fig. 1. miR2118 deletion mutants exhibit male and female sterility.
a Sequence alignment of the 12 mature miR2118 family members in rice, and Cas9-guide RNA used for genome editing. The Cas9-guide RNA complementary sequence (blue) is mostly conserved in miR2118bn and miR2118fjm (red). The PAM sequence is shown in light blue in a black box. b Genome sequence read mapping in the miR2118 cluster region on rice chromosome 4 in the mi-1, mi-2, and mi-3 lines. In all, 16,209 bp from miR2118b to miR2118n were deleted in the mir2118 lines. c Fertility of Nipponbare (WT) and two mir2118 mutants grown under long-day (LD) and short-day (SD) conditions. Data are mean ± SD of more than three biological replicates. Student’s t test. d, e Mature pollens stained with iodine-potassium iodide of the WT and mir2118 line. f An anther of mi-1. Yellow arrowhead indicates the shorter inner locule. Magenta arrowhead indicates the curled outer locule. g, h. Pistils of the WT and mi-1 line. An additional stigma was observed in the mir2118 line. Yellow bars indicate 1 mm.
Fig. 2
Fig. 2. mir2118 exhibits defects in epidermis development in anther wall layers.
a Correlation between anther length and flower size in WT (gray), mi-1 (orange), and mi-2 (light orange). bi Autofluorescence images of 0.5 mm anthers of WT, mi-1, and mi-2, as captured by Lightsheet microscopy. An anther comprises four locules: two outer and two inner locules. Outer locules were curved at Stage 2 in mi-1 (c) and mi-2 (d, e). Enlarged images of the anther wall (fi). Autofluorescence was strongly detected in the epidermis of the WT anther wall, while these epidermis signals were not evident in the mir2118 mutants. White and yellow arrows represent the epidermis and tapetum layers, respectively. jl Images of 0.4 mm anthers of WT, mi-1, and mi-2, as stained with Calcofluor White and captured by Lightsheet microscopy. Cells of the epidermis in inner locules were elongated in WT, and not elongated in the mir2118 mutants. White arrows indicate epidermis cells in inner locules. Yellow and white bars indicate 100 and 25 μm, respectively. m, n. In situ hybridization of miR2118fjm and negative control (NC) probes (miRCURY LNA miRNA detection probe; see Supplementary Table 4) using anthers of 2.0–2.5 mm inflorescence, at Stages 1 and 2. miR2118fjm was strongly expressed at the epidermis in the anther walls. White bar represents 25 μm. Excitation wavelength/fluorescence are 561/LP585 nm for autofluorescence (bi) and 405/420–470 nm for Calcofluor White (jl). Maximum intensity projection was used for the anther overview.
Fig. 3
Fig. 3. miR2118 is involved in the maturation of the anther wall during post meiosis.
al Cross-section images of anthers of WT (ad), mi-1 (eh), and mi-2 (il). Panels depict anthers that were stained with Renaissance 2200 (left) and propidium iodide (right). Stage 1 is pre-meiosis, or primordial germ-cell initiation (a, e, and i); Stages 2–4 are during meiosis (b, f, and j); Stage 5 is the microspore development stage (c, g, and k); and Stage 6 is the bicellular pollen stage (d, h, and l). Tapetum defects were observed in mi-1 and mi-2 at Stages 5 and 6 after meiosis (g, h, k, and l). mo Enlarged images of the anther wall that was stained with Renaissance 2200 of d, h, and l. Middle layers were retained at later stages, even at Stage 6, in both mi-1 and mi-2 compared to the Mi-collapse in the WT anther wall at Stage 5. Ep: Epidermis, En: endothecium, Mi: middle layer, Ta: tapetum, PMC: pollen mother cell, Msp: microspore. The white arrows indicate Mi. Yellow bars represent 10 μm.
Fig. 4
Fig. 4. Identification of miR2118-dependent phasiRNAs in the anther wall.
a Size distribution of small RNAs from the WT (black line) and mi-1 (orange line) and mi-2 (yellow line) lines that were isolated from 0.5 mm anthers. b Pie charts summarizing the source of anther small RNAs from WT, mi-1, and mi-2. Anther small RNAs were mainly 21 nucleotides (nt) and derived from the lincRNAs/PHAS loci. c Venn diagram of overlapping anther 21-nt phasiRNA clusters and MEL1 21-nt phasiRNA clusters (germ-cell clusters). d, e Small RNA-seq reads of WT, mi-1, and mi-2 with two replicates that were mapped to the 21PHAS loci. Schematic alignment of 21-nt phasiRNAs is illustrated at the bottom by thick horizontal arrows with red (sense) and blue (antisense). Right panels depict the qPCR analysis of PHAS324 and PHAS1586  , lincRNAs, in 0.5 mm anthers at Stage 2. Bar represents mean ± SD (N = 3 or 4). Student’s t test. f Venn diagram of overlapping phasiRNA clusters that were identified in the anthers of WT and mi-1 and mi-2 lines. g Venn diagram shows overlapping miR2118-dependent clusters (648; f) and anther wall-specific phasiRNA clusters (532; c). The 320 overlapping clusters were considered miR2118-dependent phasiRNA clusters in the anther wall.
Fig. 5
Fig. 5. U-rich phasiRNAs are enriched in the miR2118-dependent anther wall clusters.
a, c, e Relative nucleotide bias at each position of the 21-nt phasiRNAs. b, d, f Relative frequency of each nucleotide in the 21-nt phasiRNAs. The 5′ terminals of phasiRNAs that interact with MEL1 are mainly “C” (a, b), while miR2118-dependent phasiRNAs from the 320 anther wall phasiRNA clusters are “U” rich, especially at the 5′ and 3′ ends (c, d). In the whole anther phasiRNAs, the 5′-terminal sequence composition of “C” and “U” are comparable (e, f).
Fig. 6
Fig. 6. OsAGO1b/OsAGO1d is highly expressed in the anther wall.
a, b Volcano plots of proteome analysis in 0.5 mm anthers (Stage 2) of WT, mi-1, and mi-2 (WT, three biological replicates; mi-1 and mi-2, two biological replicates). c Western blot analysis of MEL1 in the anther. Total proteins that were extracted from 0.5 mm anthers (lane 1, Stage 2) and 0.6 mm anthers (lane 2, Stage 3). MEL1 protein is reduced in mi-1 and mi-2 at Stages 2 and 3. dj In situ hybridization of MEL1, OsAGO1b, and OsAGO1d in the anther. OsAGO1d expression is abundant in the anther wall, especially at the tapetum (Ta), middle layer (Mi), and endothecium (En) regions. OsAGO1b localization was more enriched in Mi and epidermis (Ep) than Ta. MEL1 is specifically expressed in pollen mother cells (PMC). d, g, j are at Stage 1, and e, h are at Stage 2. NC: Negative controls with the sense strand of OsAGO1d (f) and OsAGO1b (i) at Stage 2 . Bars = 20 μm. k Model of cell-linage-specific phasiRNA production during anther development. During early meiosis, miR2118 expression is increased in the epidermis, and promotes the production of 21-nt phasiRNAs in the anther wall. U-phasiRNAs, whose production is dependent on miR2118, may be sorted into OsAGO1. OsAGO1b/d-miR2118 and/or OsAGO1b/d-U-phasiRNAs may function in anther wall development during early meiotic stages. In contrast, in PMC, C-phasiRNAs that interact with MEL1 regulate meiosis progression. After meiosis, miR2118 may further act to regulate the maturation of Ta and Mi.

References

    1. Czech B, Hannon GJ. Small RNA sorting: matchmaking for Argonautes. Nat. Rev. Genet. 2011;12:19–31. - PMC - PubMed
    1. Ketting RF. The many faces of RNAi. Dev. Cell. 2011;20:148–161. - PubMed
    1. Borges F, Martienssen RA. The expanding world of small RNAs in plants. Nat. Rev. Mol. Cell. Biol. 2015;16:727. - PMC - PubMed
    1. Ma Z, Zhang X. Actions of plant Argonautes: predictable or unpredictable? Curr. Opin. Plant Biol. 2018;45:59–67. - PubMed
    1. Iwakawa HO, Tomari Y. The functions of microRNAs: mRNA decay and translational repression. Trends Cell Biol. 2015;25:651–665. - PubMed

Publication types

MeSH terms