. 2020 Jun 19;10(1):9958.
doi: 10.1038/s41598-020-66604-7.

Genetic basis and identification of candidate genes for salt tolerance in rice by GWAS

Affiliations

Genetic basis and identification of candidate genes for salt tolerance in rice by GWAS

Jie Yuan et al. Sci Rep. .

Abstract

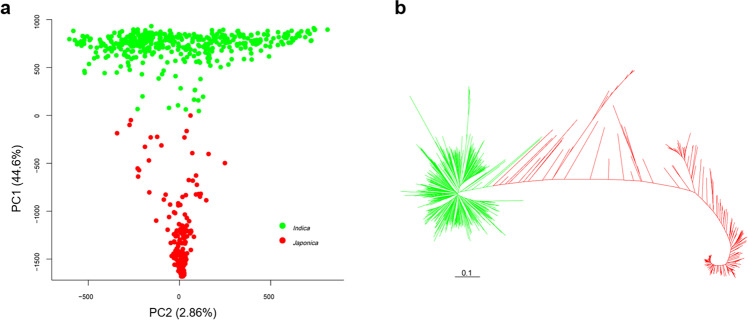
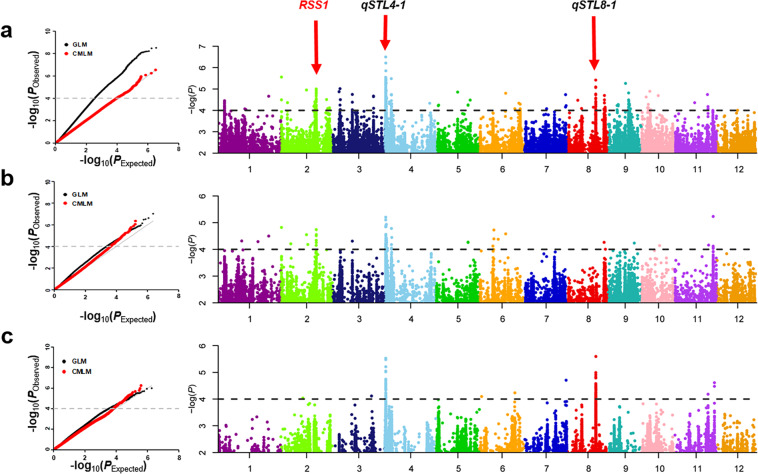
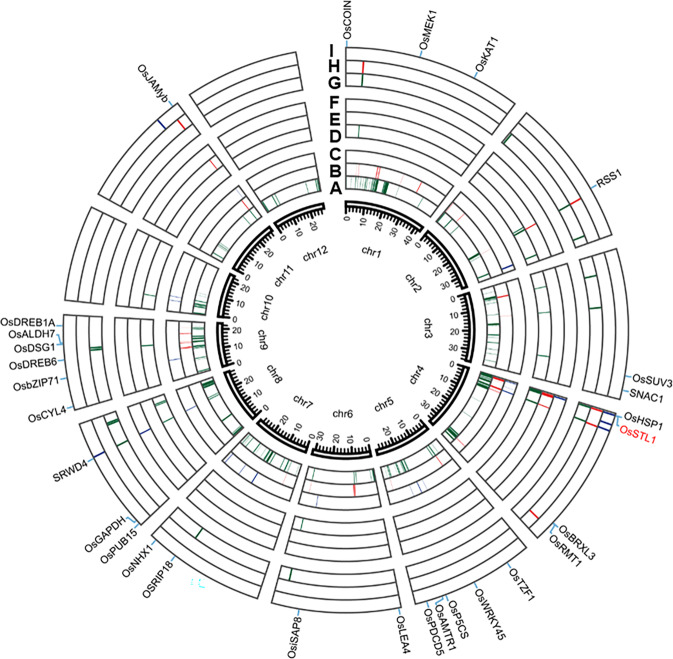
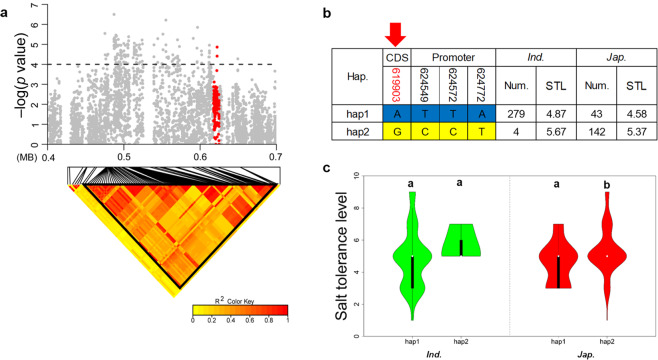
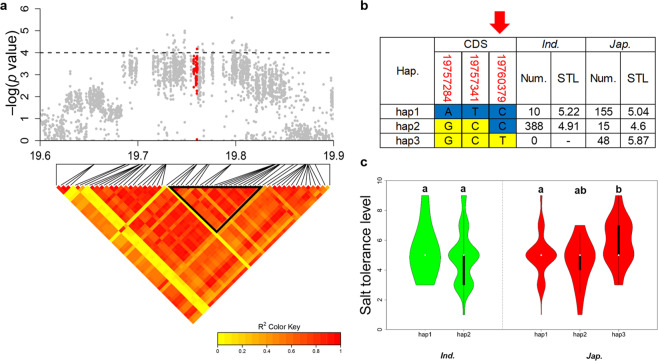
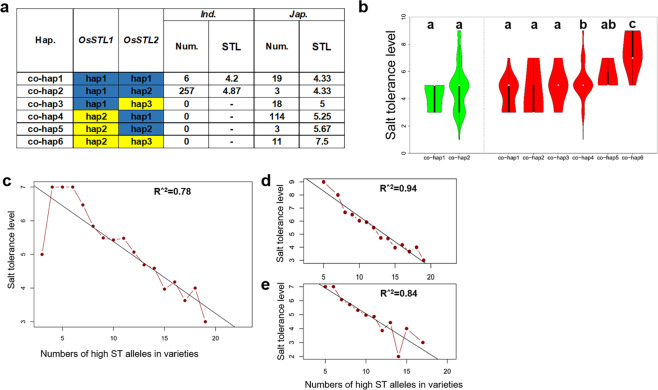
Soil salinity is a major factor affecting rice growth and productivity worldwide especially at seedling stage. Many genes for salt tolerance have been identified and applied to rice breeding, but the actual mechanism of salt tolerance remains unclear. In this study, seedlings of 664 cultivated rice varieties from the 3000 Rice Genome Project (3K-RG) were cultivated by hydroponic culture with 0.9% salt solution for trait identification. A genome-wide association study (GWAS) of salt tolerance was performed using different models of analysis. Twenty-one QTLs were identified and two candidate genes named OsSTL1 (Oryza sativa salt tolerance level 1) and OsSTL2 (Oryza sativa salt tolerance level 2) were confirmed using sequence analysis. Haplotype and sequence analysis revealed that gene OsSTL1 was a homolog of salt tolerance gene SRP1 (Stress associated RNA-binding protein 1) in Arabidopsis. The hap1 of OsSTL1 was identified as the superior haplotype and a non-synonymous SNP was most likely to be the functional site. We also determined that the level of salt tolerance was improved by combining haplotypes of different genes. Our study provides a foundation for molecular breeding and functional analysis of salt tolerance in rice seedlings.


Conflict of interest statement

The authors declare no competing interests.

Figures

Figure 1
Figure 1
Population structure of 664 rice accessions. (a) Principal component analysis and (b) neighbor-joining tree for all accessions; green lines represent indica, and red lines represent japonica. PC analysis was performed using 3.5 million SNPs with missing data rates ≤ 30% and minor allele frequency ≥ 5%. Neighbor-joining tree was constructed using 68,376 SNPs evenly distributed throughout the genome.
Figure 2
Figure 2
GWAS for salt tolerance in rice seedlings. Quantile–quantile plots and Manhattan plots for the GWAS in the full (a), indica (b) and japonica (c) populations using CMLM. In quantile-quantile plots, black dots are for GLM, and red points are for CMLM. In Manhattan plots, the gene in red was previously cloned, and QTLs in black were considered to be important. Dashed horizontal line for each population indicates the suggestive threshold (P = 1.0 × 10−4).
Figure 3
Figure 3
Circos map of all association signals for salt tolerance in the full population, indica and japonica using GLM, CMLM and FaST-LMM. The colored blocks in each layer from inner to outer represent QTLs detected from in the full population (a), indica subpopulation (b), japonica subpopulation (c) using GLM, and in the same populations (d,e,f) using CMLM and (g,h,i) using FaST-LMM, respectively. Twenty-eight known genes are labeled with black script at the outermost layer; red color represents candidate genes detected in this study.
Figure 4
Figure 4
Dissection of OsSTL1 for salt tolerance on chromosome 4. (a) Local Manhattan plot (upper) and LD heatmap (lower) surrounding the lead SNP for STL on chromosome 4. Red dots represent all SNPs within OsSTL1. (b) Different haplotypes of OsSTL1 in indica and japonica. The red number identifies the nonsynonymous mutation; red arrow shows the functional site. (c) Comparison of the STL trait for salt tolerance among OsSTL1 haplotypes in indica and japonica using one-way ANOVA. Green violins represent indica and red violins represent japonica. Different letters indicate significant differences (p < 0.01) detected by one-way ANOVA.
Figure 5
Figure 5
Dissection of OsSTL2 for salt tolerance on chromosome 8. (a) Local Manhattan plot (upper) and LD heatmap (lower) surrounding the lead SNP for STL on chromosome 8. Red dots represent all SNPs within OsOsSTL2. (b) Different haplotypes of OsSTL2 in indica and japonica. The red number identifies the nonsynonymous mutation; red arrow shows the functional site. (c) Comparison of the STL trait for salt tolerance among OsSTL2 haplotypes in indica and japonica using one-way ANOVA. Green violins represent indica and red violins represent japonica. Different letters indicate significant differences (p < 0.01) detected by one-way ANOVA.
Figure 6
Figure 6
Functional validation of haplotype combinations of OsSTL1 and OsSTL2. (a) STL for different haplotype combinations of OsSTL1 and OsSTL2. Blue color represents superior alleles and yellow color represents inferior alleles. (b) Comparison of the STL trait for salt tolerance among haplotype combinations of OsSTL1 and OsSTL2 in indica and japonica using one-way ANOVA. Green violins represent indica and red violins represent japonica. Different letters indicate significant differences (p < 0.05) detected by one-way ANOVA. Pyramiding of lead SNP of high salt tolerance alleles in the full population (c), indica (d) and japonica (e).

References

    1. Wang W, et al. Genomic variation in 3,010 diverse accessions of Asian cultivated rice. Nature. 2018;557:43–49. doi: 10.1038/s41586-018-0063-9. - DOI - PMC - PubMed
    1. Wang Z, et al. Identification of QTLs with main, epistatic and QTL x environment interaction effects for salt tolerance in rice seedlings under different salinity conditions. Theor Appl Genet. 2012;125:807–815. doi: 10.1007/s00122-012-1873-z. - DOI - PubMed
    1. Prasad SR, Bagali PG, Hittalmani S, Shashidhar HE. Molecular mapping of quantitative trait loci associated with seedling tolerance to salt stress in rice (Oryza sativa L.) Current Science. 2000;78:162–164.
    1. Takehisa H, et al. Identification of quantitative trait loci for plant growth of rice in paddy field flooded with salt water. Field Crops Research. 2004;89:85–95. doi: 10.1016/j.fcr.2004.01.026. - DOI
    1. He Y, et al. A quantitative trait locus, qSE3, promotes seed germination and seedling establishment under salinity stress in rice. Plant J. 2019;97:1089–1104. doi: 10.1111/tpj.14181. - DOI - PMC - PubMed

Publication types