. 2020 Jul;39(30):5282-5291.
doi: 10.1038/s41388-020-1358-5. Epub 2020 Jun 19.

Wnt/β-catenin activation cooperates with loss of p53 to cause adrenocortical carcinoma in mice

Affiliations

Wnt/β-catenin activation cooperates with loss of p53 to cause adrenocortical carcinoma in mice

Kleiton Silva Borges et al. Oncogene. 2020 Jul.

Abstract

Adrenocortical carcinoma (ACC) is a rare and aggressive malignancy with limited therapeutic options. The lack of mouse models that recapitulate the genetics of ACC has hampered progress in the field. We analyzed The Cancer Genome Atlas (TCGA) dataset for ACC and found that patients harboring alterations in both p53/Rb and Wnt/β-catenin signaling pathways show a worse prognosis compared with patients that harbored alterations in only one. To model this, we utilized the Cyp11b2(AS)Cre mouse line to generate mice with adrenocortical-specific Wnt/β-catenin activation, Trp53 deletion, or the combination of both. Mice with targeted Wnt/β-catenin activation or Trp53 deletion showed no changes associated with tumor formation. In contrast, alterations in both pathways led to ACC with pulmonary metastases. Similar to ACCs in humans, these tumors produced increased levels of corticosterone and aldosterone and showed a high proliferation index. Gene expression analysis revealed that mouse tumors exhibited downregulation of Star and Cyp11b1 and upregulation of Ezh2, similar to ACC patients with a poor prognosis. Altogether, these data show that altering both Wnt/β-catenin and p53/Rb signaling is sufficient to drive ACC in mouse. This autochthonous model of ACC represents a new tool to investigate the biology of ACC and to identify new treatment strategies.


Conflict of interest statement

The authors declare that they have no conflict of interest.

Figures
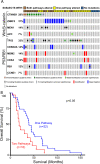
Fig. 1
Fig. 1. Alterations in human ACC of Wnt/β-catenin and P53/RB1 network genes in the C1A molecular subgroup.
a Analysis of 43 ACC samples from cBioPortal showing mutations and copy number gains and losses of indicated genes. Somatic alterations of CTNNB1, ZNFR3, MEN1, and APC genes result in modification of the Wnt/β-catenin pathway and somatic alterations in TP53, CDKN2A, MDM2, CDK4, RB1, and CCNE1 genes affect the p53 apoptosis/Rb1 cell cycle pathway [10]. 88% (38/43) of human ACCs from C1A subgroup harbor at least one altered gene from either pathway, with 37% (16/43) harboring altered genes in both pathways. 12% (5/43) of the patients do not harbor somatic mutations in any of these genes. b Kaplan–Meier analysis showing overall disease-free survival for the set of patients with alterations in one pathway (blue) versus those that show alterations in both pathways (red). P < 0.0001. Log-rank (Mantel–Cox) test.
Fig. 2
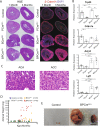
Fig. 2. Combined activation of Wnt/β-catenin and deregulation of p53/RB1 pathway causes adrenocortical neoplastic transformation in mice.
a Histological analysis of the adrenal phenotype. Hematoxylin/eosin (H&E) and β-catenin staining of Controls, PCreAS/+, BCreAS/+, and BPCreAS/+ adrenals at 1 month (n = 4, n = 4, n = 4, n = 5, respectively) and 3 months (n = 6, n = 5, n = 3, n = 7, respectively). All data shown are from female mice. Scale bar: 500 μm. b Quantitative representation of mRNA expression of genes encoding Trp53, Cdkn1a, Axin2, and Lef1 in Control (wild-type), PCreAS/+, BCreAS/+, and BPCreAS/+ adrenals at 3 months. Bars represent the mean ± SEM. *P < 0.05, **P < 0.01, ***P < 0.001, by one-way ANOVA followed by the Bonferroni test. All data shown are from female mice. c Images of H&E staining of a benign adrenocortical adenoma (ACA) (Weiss = 1) and a malignant adrenocortical carcinoma (ACC) (Weiss = 3) from female mice at 3 months of age. Scale bars, 50 μm. d Evaluation of adrenal weight over time from Control, PCreAS/+, BCreAS/+, and BPCreAS/+ mice. BPCreAS/+ mice show an increased tissue weight over one year compared to controls, PCreAS/+, and BCreAS/+ mice. Data shown are from male and female mice. e Gross adrenal anatomy in 10-month-old control (left) and BPCreAS/+ (right) female mice. Scale bars, 1000 μm.
Fig. 3
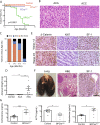
Fig. 3. Wnt/β-catenin activation combined with Trp53 deletion induces the evolution of adrenocortical malignant disease in mice.
a Kaplan–Meier analysis showing the percent tumor free in Controls, PCreAS/+, BCreAS/+, and BPCreAS/+ mice. Only BPCreAS/+ mice give rise to adrenocortical tumors, P < 0.0001, Log-rank (Mantel–Cox). Data shown are from male and female mice. b Examples of Hematoxylin/eosin (H&E) staining of ACA (Weiss = 2, 6.5 month) and ACC (Weiss = 6, 10 months) tumors from female mice. Scale bar = 50 µm. c Histologic progression of adrenocortical tumors using the Weiss criteria. Percentages of BPCre mice with adenomas (ACA), carcinomas (ACC) or no score at age <3 months (n = 11), 3-4.5 months (n = 9), 5-7.5 months (n = 15), and >7.5 months (n = 7). Data from male and female mice. d Average adrenal weight from Control (n = 10) versus ACA (n = 6) or ACC (n = 10) from BPCreAS/+ mice from 3 to 12 months of age. Mean weight ± SEM **P < 0.01, Mann–Whitney test. e IHC staining against the indicated proteins in ACA and ACC tumors. Scale bar = 50 μm. f Macroscopic (left) and microscopic (center, right) images of lung from a BPCreAS/+ mouse. H&E and SF-1 IHC show discrete metastatic nodules. Scale bar = 100 μm. g Quantitative analysis of plasma corticosterone, ACTH, and aldosterone from Control mice (n = 6) and BPCreAS/+ mice with ACC. Bars represent the mean ± SEM from Control (n = 8) and BPCreAS/+ (n = 6–7). Data shown are from male and female mice at 8–9 months of age. Student’s t-test, *P < 0.05, **P < 0.01, ***P < 0.001.
Fig. 4
Fig. 4. ACC in mice exhibit similar gene expression profiles to ACC in humans.
a Analysis reveals increased gene expression for Axin2, Lef1, and Ezh2 in BPCreAS/+ mice (n = 5) with ACC compared to Control mice (n = 5). b Analysis reveals decreased gene expression for Star and Cyp11b1 in BPCreAS/+ mice (n = 5) compared to Control mice (n = 5). c STAR and CYP11B1 expression predicts a worse prognosis in human ACC. All gene expression data are from female mice at 8–9 months of age. Statistical analyses were conducted by Student’s t-test a and b or by Log-rank (Mantel–Cox) c. *P < 0.05, **P < 0.01, ***P < 0.001.

References

    1. Else T, Kim AC, Sabolch A, Raymond VM, Kandathil A, Caoili EM, et al. Adrenocortical carcinoma. Endocr Rev. 2014;35:282–326. - PMC - PubMed
    1. Fassnacht M, Kroiss M, Allolio B. Update in adrenocortical carcinoma. J Clin Endocrinol Metab. 2013;98:4551–64. - PubMed
    1. Fassnacht M, Dekkers O, Else T, Baudin E, Berruti A, de Krijger RR, et al. European Society of Endocrinology Clinical Practice Guidelines on the Management of Adrenocortical Carcinoma in Adults, in collaboration with the European Network for the Study of Adrenal Tumors. Eur J Endocrinol. 2018;179:G1–46. - PubMed
    1. Else T, Williams AR, Sabolch A, Jolly S, Miller BS, Hammer GD. Adjuvant therapies and patient and tumor characteristics associated with survival of adult patients with adrenocortical carcinoma. J Clin Endocrinol Metab. 2014;99:455–61. - PMC - PubMed
    1. Mohan DR, Lerario AM, Hammer GD. Therapeutic targets for adrenocortical carcinoma in the genomics era. J Endocr Soc. 2018;2:1259–74. - PMC - PubMed

Publication types