. 2020 Sep;30(9):745-762.
doi: 10.1038/s41422-020-0355-0. Epub 2020 Jun 19.

A pan-cancer blueprint of the heterogeneous tumor microenvironment revealed by single-cell profiling

Affiliations

A pan-cancer blueprint of the heterogeneous tumor microenvironment revealed by single-cell profiling

Junbin Qian et al. Cell Res. 2020 Sep.

Abstract

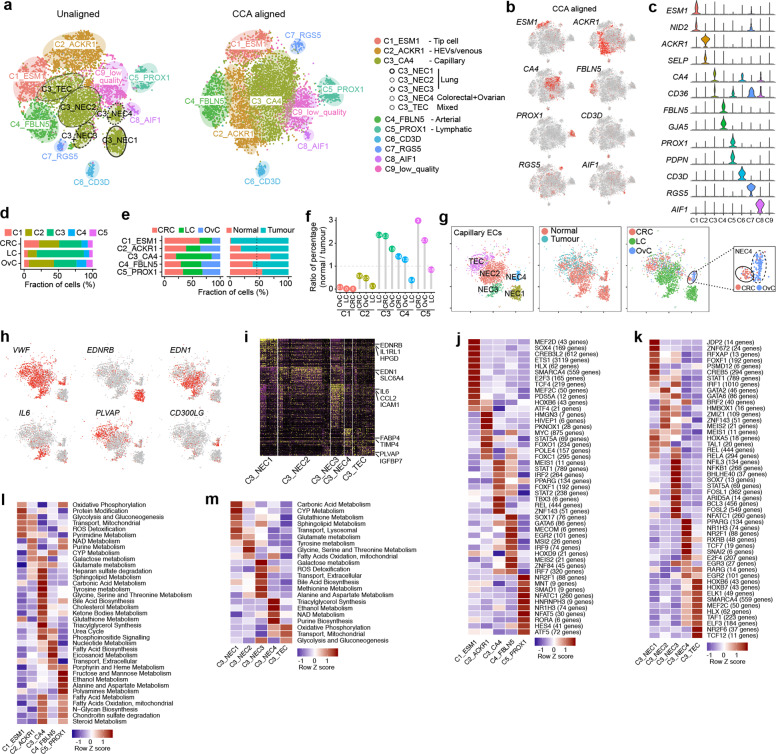
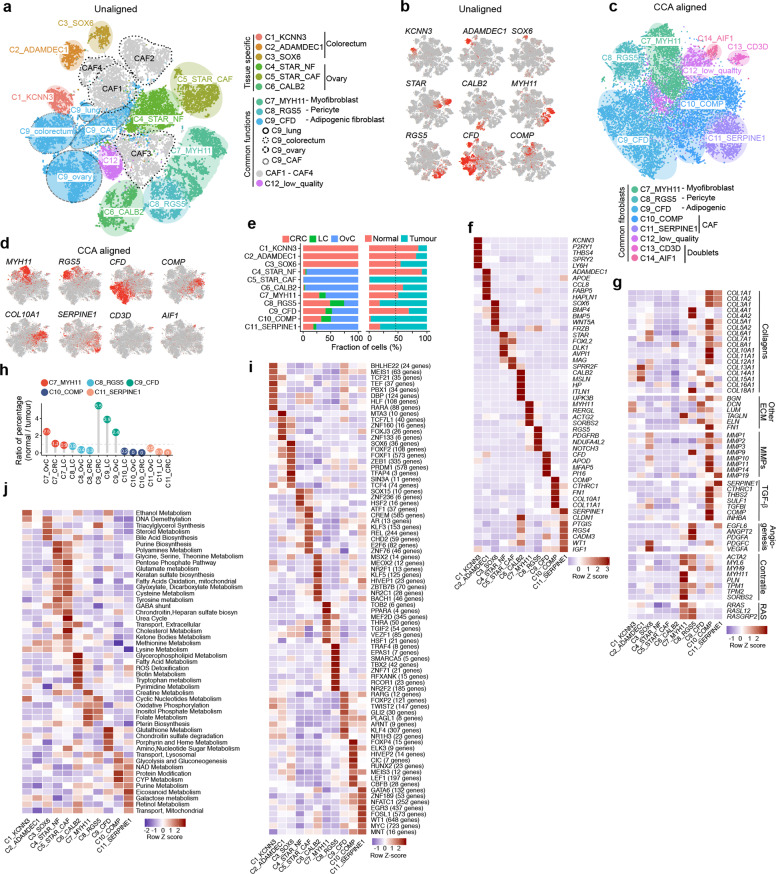
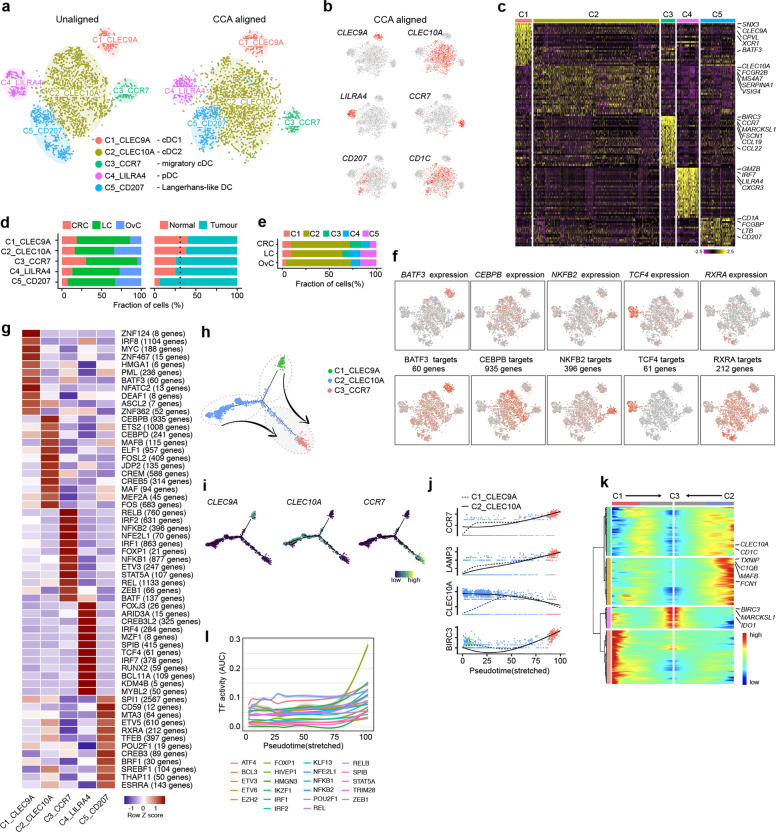
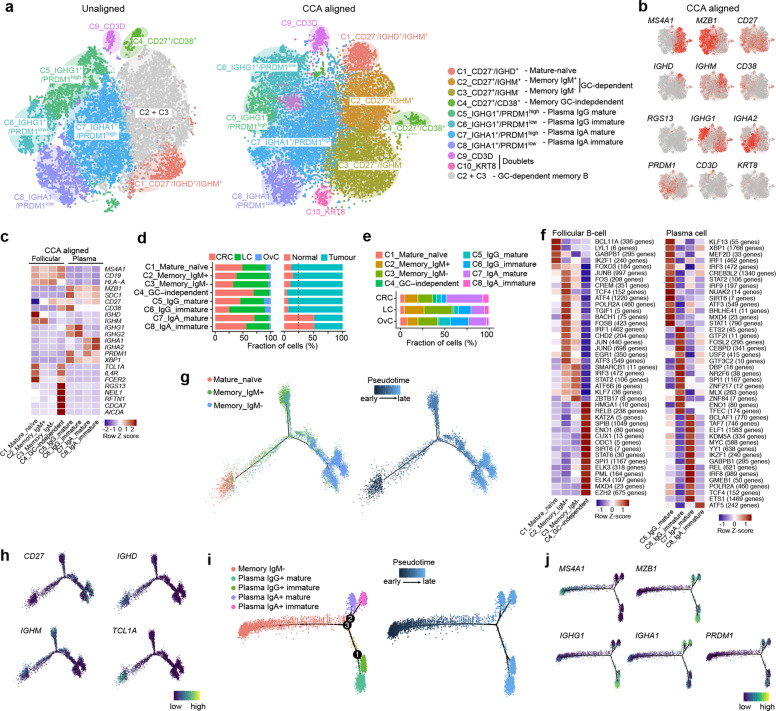
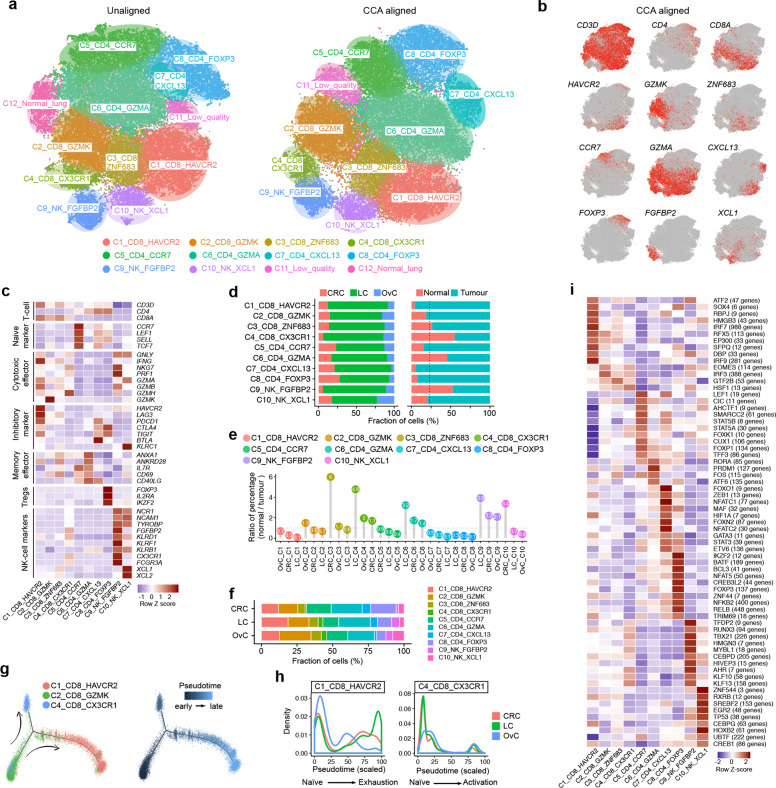
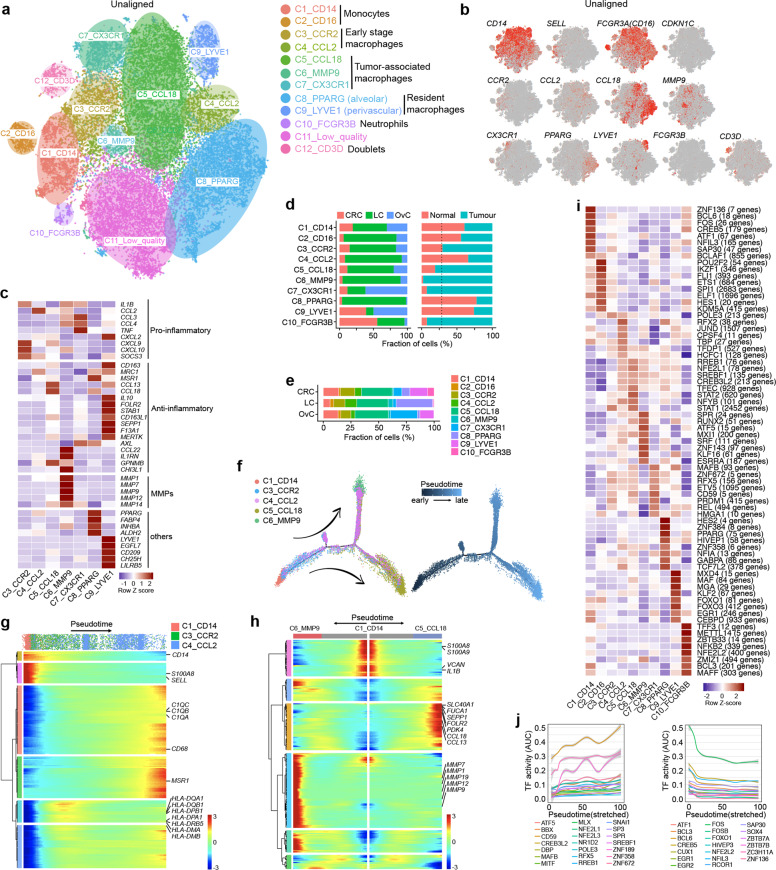
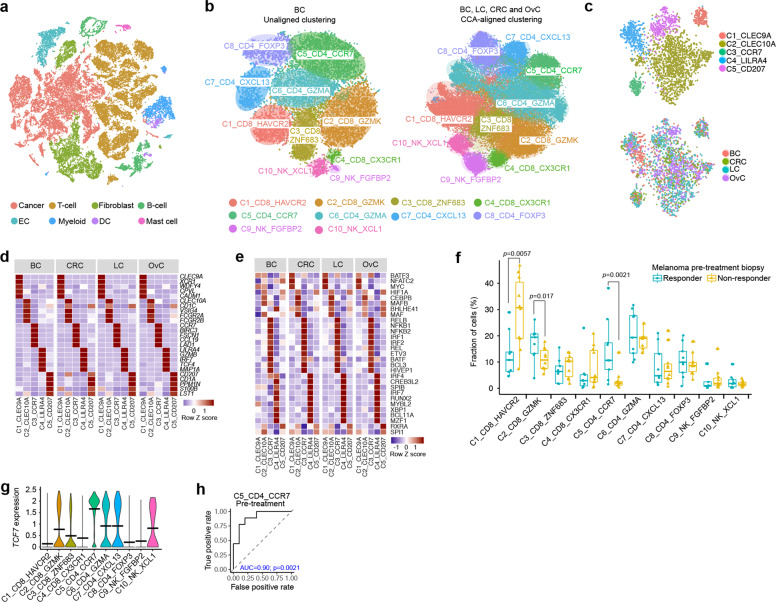
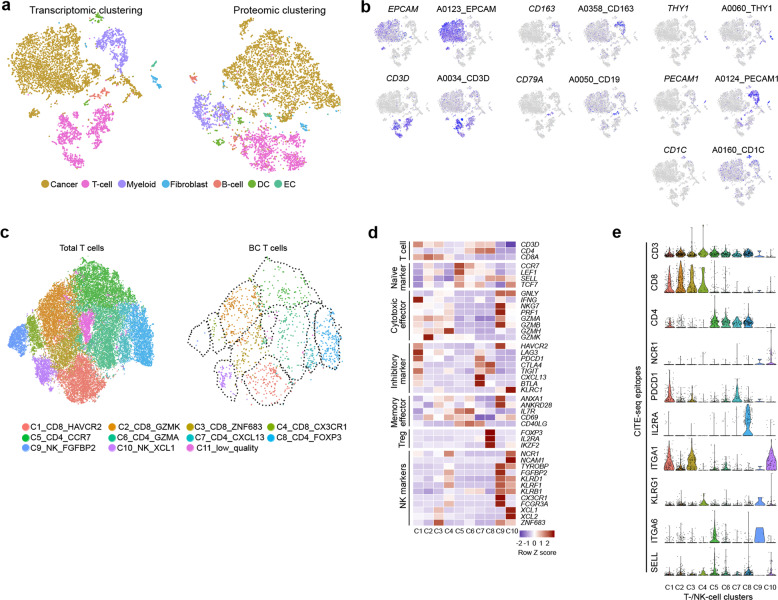
The stromal compartment of the tumor microenvironment consists of a heterogeneous set of tissue-resident and tumor-infiltrating cells, which are profoundly moulded by cancer cells. An outstanding question is to what extent this heterogeneity is similar between cancers affecting different organs. Here, we profile 233,591 single cells from patients with lung, colorectal, ovary and breast cancer (n = 36) and construct a pan-cancer blueprint of stromal cell heterogeneity using different single-cell RNA and protein-based technologies. We identify 68 stromal cell populations, of which 46 are shared between cancer types and 22 are unique. We also characterise each population phenotypically by highlighting its marker genes, transcription factors, metabolic activities and tissue-specific expression differences. Resident cell types are characterised by substantial tissue specificity, while tumor-infiltrating cell types are largely shared across cancer types. Finally, by applying the blueprint to melanoma tumors treated with checkpoint immunotherapy and identifying a naïve CD4+ T-cell phenotype predictive of response to checkpoint immunotherapy, we illustrate how it can serve as a guide to interpret scRNA-seq data. In conclusion, by providing a comprehensive blueprint through an interactive web server, we generate the first panoramic view on the shared complexity of stromal cells in different cancers.


Conflict of interest statement

The authors declare no competing interests.

Figures

Fig. 1
Fig. 1. Experimental design and cell typing.
a Analysis workflow of tumor and matched normal samples from 3 cancer types. b–d t-SNE representation for LC (n = 93,576 cells), CRC (n = 44,685) and OvC (45,115). Colour-coded for cell type (b), sample origin (c) and patient (d). e Bar plots representing per cell type from left to right: the fraction of cells per tissue and per origin, the number of cells, the total number of transcripts. Dendritic cells were transcriptionally most active (P < 1.6 × 10−10). f Fraction of cells for major cell types per cancer type. T-cells were most frequent in LC (P < 0.0047).
Fig. 2
Fig. 2. Clustering 8223 ECs.
a t-SNEs colour-coded for annotated ECs by unaligned and CCA-aligned clustering. b t-SNEs with EC marker gene expression for CCA clusters. c Marker gene expression per EC cluster. d Fraction of cells in each cancer type per EC cluster. e Fraction of EC clusters per cancer type (left) and sample origin (right). f Normal/tumor ratio of relative percentage of EC clusters, < 1 indicates tumor enrichment. Tip ECs (FDR = 1.4 × 10−141) and HEVs (FDR = 2.3 × 10−60) were enriched in tumor. g t-SNEs of cEC clusters by unaligned clustering, colour-coded by cluster, sample origin and cancer type, including a zoom-in of the NEC4 cluster (right). h t-SNE of marker gene expression in cEC clusters. i-k Heatmap of differentially expressed genes in cEC clusters (i), of TF activity by SCENIC for EC (j) or cEC clusters (k). l, m Heatmap showing metabolic activity for EC (l) or cEC clusters (m).
Fig. 3
Fig. 3. Characterization of 24,622 fibroblasts.
a t-SNE colour-coded for annotated fibroblasts by unaligned clustering. b t-SNEs with marker gene expression in unaligned clusters. c t-SNE colour-coded for annotated fibroblasts by CCA. d t-SNE with marker gene expression in CCA clusters. e Fraction of fibroblast clusters per cancer type (left) and sample origin (right). C7–C11s are shared by CRC, LC and OvC. f, g Heatmap of marker gene expression (f) and functional gene sets (g). h Normal/tumor ratio of relative percentage of fibroblast clusters, < 1 indicates tumor enrichment. Pericytes were enriched in tumor (FDR = 7.8 × 10−10). i, j Heatmap of TF activity (i) or metabolic activity (j) in fibroblast clusters.
Fig. 4
Fig. 4. Clustering 2722 DCs.
a t-SNEs colour-coded for annotated DCs by unaligned and CCA-aligned clustering. b t-SNEs with DC marker gene expression in CCA aligned clusters. c Heatmap for differential gene expression in unaligned clusters. d Fraction of DC clusters per cancer type (left) and sample origin (right). Migratory cDCs were depleted in OvC (FDR = 0.017). e Fraction of cells in each cancer type per cluster. f t-SNEs with gene expression (upper) and corresponding TF activity (lower). g Heatmap showing TF activity in CCA-aligned clusters. h Trajectory inference analysis of cDC-related subclusters. i Marker gene expression along the cDC trajectory. j, k Marker gene expression (j) and expression dynamics (k) during cDC maturation. l TF activation dynamics of cDC2 to migratory cDC differentiation.
Fig. 5
Fig. 5. B-cell taxonomy and developmental trajectory.
a t-SNEs colour-coded for annotated B-cells using unaligned and CCA-aligned clustering. b t-SNEs with marker gene expression in CCA clusters. c Heatmap of functional gene sets in CCA clusters. d Fraction of B-cell clusters per cancer type (left) and sample origin (right). e Fraction of cells in each cancer type per cluster. f Heatmap with TF activity by SCENIC, for follicular B-cell (left) or plasma cell clusters (right). g Developmental trajectory for GC-dependent memory B-cells, colour-coded by cell type (left) and pseudotime (right). h Marker gene expression of the GC-memory B-cell trajectory as in g. i Trajectory of IgM memory B to IgG+ or IgA+ plasma cells, colour-coded by branch type (left) and pseudotime (right). j Marker gene expression dynamics during plasma cell differentiation as in i.
Fig. 6
Fig. 6. Profiling 52,494 T-/NK-cells.
a t-SNEs colour-coded for annotated T-/NK-cell using unaligned and CCA aligned clustering. b t-SNEs with marker gene expression in CCA clusters. c Heatmap of functional gene sets in CCA clusters. d Fraction of cells for T-/NK-cell clusters per cancer type (left) and sample origin (right). e Normal/tumor ratio of relative percentage of T-/NK-cell clusters, < 1 indicates tumor enrichment. C1, C2, C5, C7, C8 were enriched in tumor (FDR < 5.1 × 10−25), C9 was enriched in normal (FDR = 1.5 × 10−219). f Fraction of T-/NK-cells in each cancer type per cluster. C4 and C8 were rare in CRC (FDR = 0.019) and OvC (FDR = 0.034), respectively. g Heatmap with TF activity of T-/NK-cell clusters by SCENIC. h Differentiation trajectory for CD8+ T cell lineages, colour-coded by cell type (left) and pseudotime (right). i Density plots for CRC, LC and OvC along the two CD8+ T-cell trajectories.
Fig. 7
Fig. 7. Profiling of monocytes, macrophages and neutrophils.
a t-SNE colour-coded for annotated myeloid cell using unaligned clustering. b t-SNEs with marker gene expression in myeloid clusters. c Heatmap of functional gene sets in myeloid clusters. d Fraction of myeloid clusters per cancer type (left) and sample origin (right). C9 was enriched in normal (FDR = 3.0 × 10−31) and C8 in normal lung (FDR 0) tissue. C5–C7 and C10 (FDR < 3.3 × 10−31) were enriched in tumor. e Fraction of cells in each cancer type per cluster. f Monocyte-to-macrophage differentiation trajectory, colour-coded by cluster (left) or pseudotime (right). g, h Gene expression dynamics during differentiation of C1 monocytes to C4 macrophages (g), or terminal differentiation of C5/C7 macrophages (h). i Heatmap showing TF activity by SCENIC. j TF activation (left) or inactivation (right) during monocyte-to-macrophage differentiation, before branching into terminal differentiation.
Fig. 8
Fig. 8. Validation of the stromal blueprint.
a t-SNE of BC cells colour-coded for cell types. b t-SNEs of T-/NK-cells by unaligned clustering or CCA-aligned clustering with 3′-scRNA-seq data. c t-SNEs of CCA-aligned clusters colour-coded for annotated DCs (upper) and cancer type (lower). d Heatmap of marker gene expression across DC clusters in different cancer types. e TF activity across DC subclusters in different cancer types. f Fraction of T-/NK-cell clusters in pre-treatment biopsies from melanoma patients treated with ICI. g Violin plot showing TCF7 expression in T-/NK-cell clusters from pre-treatment melanoma patients. h ROC analysis to evaluate the predictive effect of naïve CD4+ T-cells on response to checkpoint immunotherapy. The area under the ROC curve (AUC) was used to quantify response prediction.
Fig. 9
Fig. 9. Validation of the stromal blueprint by CITE-seq.
a t-SNEs of CITE-seq profiled BC cells clustered into cell types based on RNA (left) or protein (right) data. b Marker gene or protein expression for each cell type. c t-SNE plots showing BC T-/NK-cells co-clustered with 3′-scRNA-seq data from other cancer types (left), while highlighting only T-/NK-cells with BC origin (right). d Heatmap with marker gene expression of T-/NK-cell clusters. e Expression by CITE-seq markers per T-/NK-cell cluster.

References

    1. Tirosh I, et al. Dissecting the multicellular ecosystem of metastatic melanoma by single-cell RNA-seq. Science. 2016;352:189–96. - PMC - PubMed
    1. Lambrechts D, et al. Phenotype molding of stromal cells in the lung tumor microenvironment. Nat. Med. 2018;24:1277–1289. - PubMed
    1. Puram SV, et al. Single-cell transcriptomic analysis of primary and metastatic tumor ecosystems in head and neck cancer. Cell. 2017;171:1611–1624. - PMC - PubMed
    1. Aizarani N, et al. A human liver cell atlas reveals heterogeneity and epithelial progenitors. Nature. 2019;572:199–204. - PMC - PubMed
    1. Venteicher AS, et al. Decoupling genetics, lineages, and microenvironment in IDH-mutant gliomas by single-cell RNA-seq. Science. 2017;355:eaai8478. - PMC - PubMed

Publication types

MeSH terms