

Unraveling VEALYL Amyloid Formation Using Advanced Vibrational Spectroscopy and Microscopy
- PMID: 32562617
- PMCID: PMC7335935
- DOI: 10.1016/j.bpj.2020.05.026
Unraveling VEALYL Amyloid Formation Using Advanced Vibrational Spectroscopy and Microscopy
Abstract
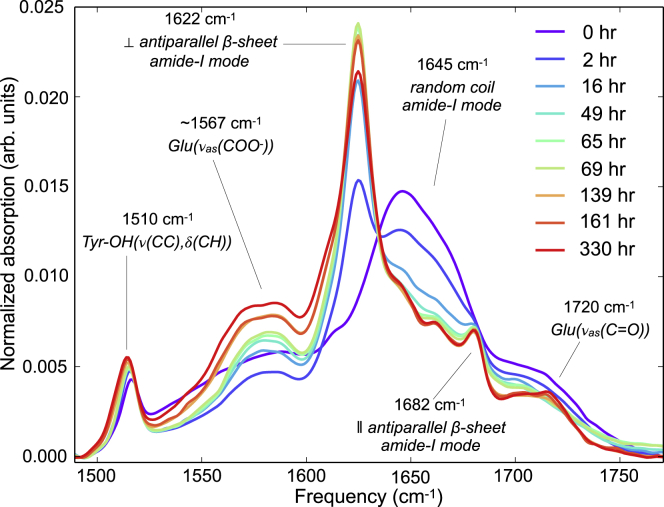
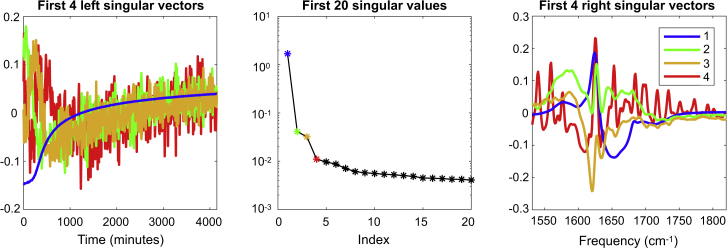
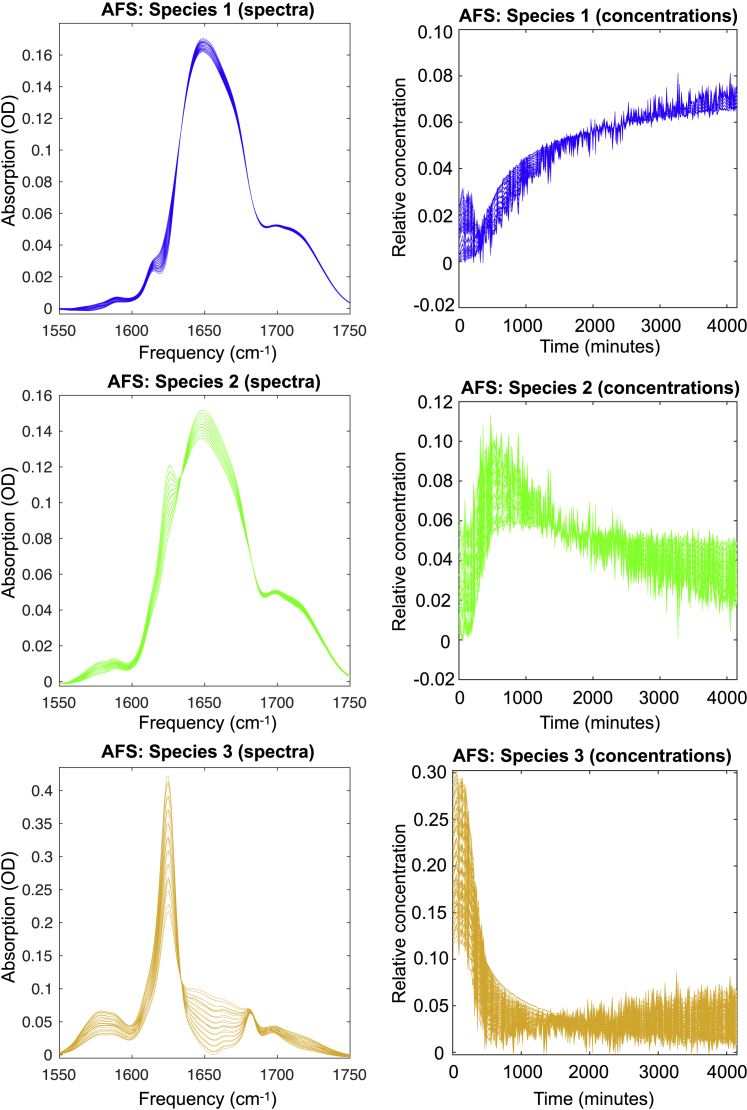
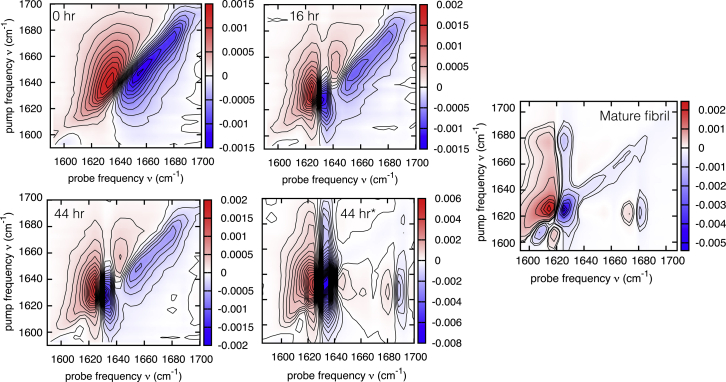
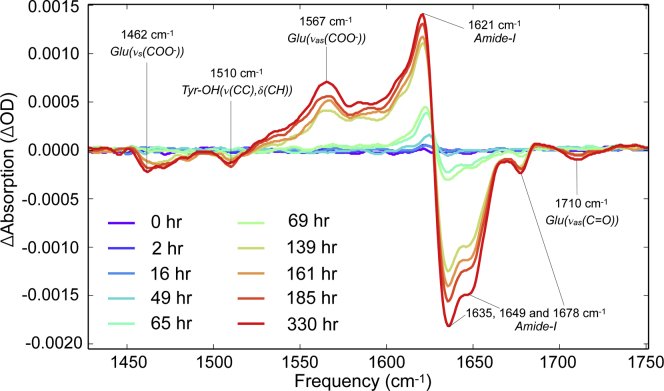
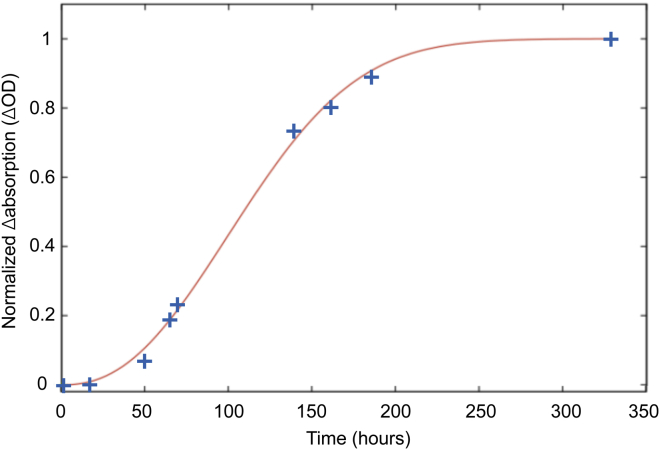
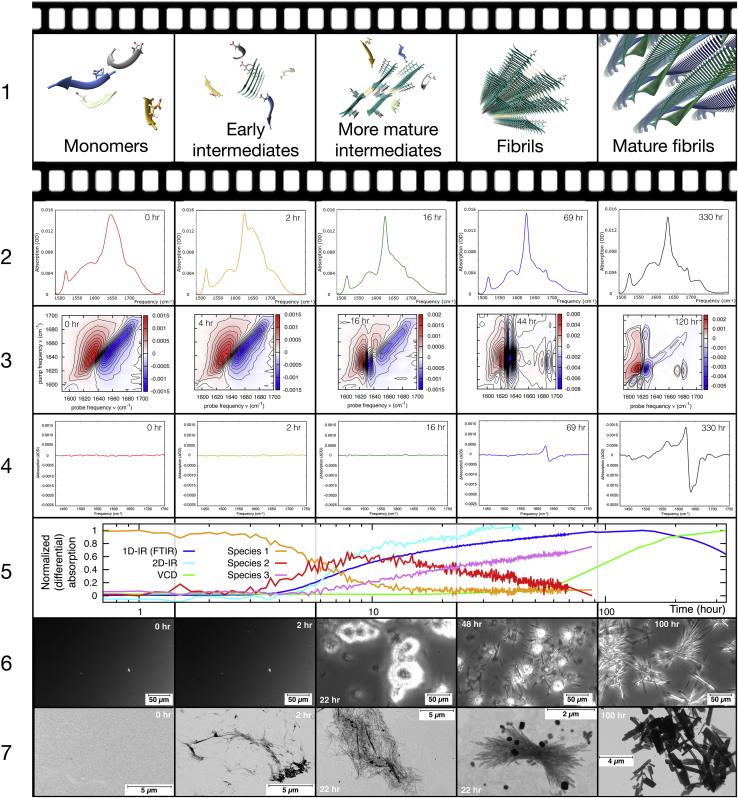
Intermediate species are hypothesized to play an important role in the toxicity of amyloid formation, a process associated with many diseases. This process can be monitored with conventional and two-dimensional infrared spectroscopy, vibrational circular dichroism, and optical and electron microscopy. Here, we present how combining these techniques provides insight into the aggregation of the hexapeptide VEALYL (Val-Glu-Ala-Leu-Tyr-Leu), the B-chain residue 12-17 segment of insulin that forms amyloid fibrils (intermolecularly hydrogen-bonded β-sheets) when the pH is lowered below 4. Under such circumstances, the aggregation commences after approximately an hour and continues to develop over a period of weeks. Singular value decompositions of one-dimensional and two-dimensional infrared spectroscopy spectra indicate that intermediate species are formed during the aggregation process. Multivariate curve resolution analyses of the one and two-dimensional infrared spectroscopy data show that the intermediates are more fibrillar and deprotonated than the monomers, whereas they are less ordered than the final fibrillar structure that is slowly formed from the intermediates. A comparison between the vibrational circular dichroism spectra and the scanning transmission electron microscopy and optical microscope images shows that the formation of mature fibrils of VEALYL correlates with the appearance of spherulites that are on the order of several micrometers, which give rise to a "giant" vibrational circular dichroism effect.
Copyright © 2020 Biophysical Society. Published by Elsevier Inc. All rights reserved.
Figures
Similar articles
-
C-Terminal Truncated α-Synuclein Fibrils Contain Strongly Twisted β-Sheets.J Am Chem Soc. 2017 Nov 1;139(43):15392-15400. doi: 10.1021/jacs.7b07403. Epub 2017 Oct 24. J Am Chem Soc. 2017. PMID: 28968082 Free PMC article.
-
Vibrational circular dichroism as a probe of fibrillogenesis: the origin of the anomalous intensity enhancement of amyloid-like fibrils.J Am Chem Soc. 2011 Feb 2;133(4):1066-76. doi: 10.1021/ja1089827. Epub 2010 Dec 27. J Am Chem Soc. 2011. PMID: 21186804
-
Partially folded intermediates as critical precursors of light chain amyloid fibrils and amorphous aggregates.Biochemistry. 2001 Mar 27;40(12):3525-35. doi: 10.1021/bi001782b. Biochemistry. 2001. PMID: 11297418
-
Vibrational Optical Activity of Amyloid Fibrils.Chempluschem. 2024 Aug;89(8):e202400091. doi: 10.1002/cplu.202400091. Epub 2024 Mar 18. Chempluschem. 2024. PMID: 38421108 Review.
-
How to Get Insight into Amyloid Structure and Formation from Infrared Spectroscopy.J Phys Chem Lett. 2014 Jun 5;5(11):1984-1993. doi: 10.1021/jz500794d. Epub 2014 May 16. J Phys Chem Lett. 2014. PMID: 24932380 Free PMC article. Review.
Cited by
-
Probing High-Order Transient Oligomers Using Ion Mobility Mass Spectrometry Coupled with Infrared Action Spectroscopy.Anal Chem. 2024 Aug 16;96(34):13962-70. doi: 10.1021/acs.analchem.4c02749. Online ahead of print. Anal Chem. 2024. PMID: 39150274 Free PMC article.
-
Ice-nucleating proteins are activated by low temperatures to control the structure of interfacial water.Nat Commun. 2021 Feb 19;12(1):1183. doi: 10.1038/s41467-021-21349-3. Nat Commun. 2021. PMID: 33608518 Free PMC article.
-
Protein Dynamics by Two-Dimensional Infrared Spectroscopy.Annu Rev Anal Chem (Palo Alto Calif). 2021 Jul 27;14(1):299-321. doi: 10.1146/annurev-anchem-091520-091009. Annu Rev Anal Chem (Palo Alto Calif). 2021. PMID: 34314221 Free PMC article.
-
Hydrogen Bonds under Stress: Strain-Induced Structural Changes in Polyurethane Revealed by Rheological Two-Dimensional Infrared Spectroscopy.J Phys Chem Lett. 2023 Feb 2;14(4):940-946. doi: 10.1021/acs.jpclett.2c03109. Epub 2023 Jan 23. J Phys Chem Lett. 2023. PMID: 36688732 Free PMC article.
References
-
- Benilova I., Karran E., De Strooper B. The toxic Aβ oligomer and Alzheimer’s disease: an emperor in need of clothes. Nat. Neurosci. 2012;15:349–357. - PubMed
-
- Baronio C.M., Baldassarre M., Barth A. Insight into the internal structure of amyloid-β oligomers by isotope-edited Fourier transform infrared spectroscopy. Phys. Chem. Chem. Phys. 2019;21:8587–8597. - PubMed
-
- Ono K. The oligomer hypothesis in α-synucleinopathy. Neurochem. Res. 2017;42:3362–3371. - PubMed
Publication types
MeSH terms
Substances
LinkOut - more resources
Full Text Sources
