

Systematic dose-response of environmental epidemiologic studies: Dose and response pre-analysis
- PMID: 32563010
- PMCID: PMC7534797
- DOI: 10.1016/j.envint.2020.105810
Systematic dose-response of environmental epidemiologic studies: Dose and response pre-analysis
Abstract
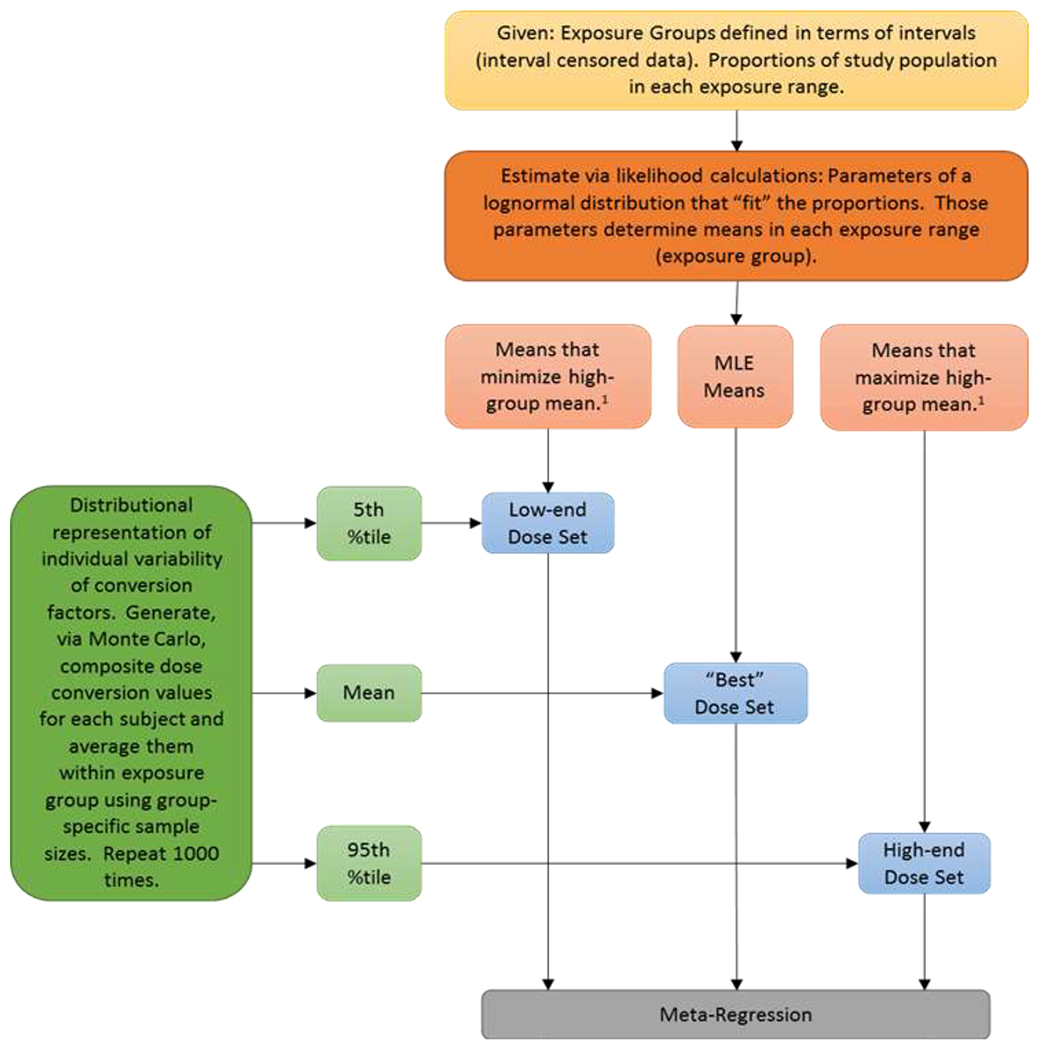
Meta-analysis approaches can be used to assess the human risks due to exposure to environmental chemicals when there are numerous high-quality epidemiologic studies of priority outcomes in a database. However, methodological issues related to how different studies report effect measures and incorporate exposure into their analyses arise that complicate the pooled analysis of multiple studies. As such, there are "pre-analysis" steps that are often necessary to prepare summary data reported in epidemiologic studies for dose-response analysis. This paper uses epidemiologic studies of arsenic-induced health effects as a case example and addresses the issues surrounding the estimation of mean doses from censored dose- or exposure-intervals reported in the literature (e.g., estimation of mean doses from high exposures that are only reported as an open-ended interval), calculation of a common dose metric for use in a dose-response meta-analysis (one that takes into consideration inter-individual variability), and calculation of response "effective counts" that inherently account for confounders. The methods herein may be generalizable to 1) the analysis of other environmental contaminants with a suitable database of epidemiologic studies, and 2) any meta-analytic approach used to pool information across studies. A second companion paper detailing the use of "pre-analyzed" data in a hierarchical Bayesian dose-response model and techniques for extrapolating risks to target populations follows.
Keywords: Dose conversion; Dose-response; Inter-individual variability; Meta-analysis; Uncertainty.
Published by Elsevier Ltd.
Conflict of interest statement
Declaration of Competing Interest The authors declare that they have no known competing financial interests or personal relationships that could have appeared to influence the work reported in this paper.
Figures


References
-
- ATSDR (Agency for Toxic Substances and Disease Registry). (2007). Toxicological profile for arsenic (update) [ATSDR Tox Profile]. Atlanta, GA: U.S. Department of Health and Human Services, Public Health Service; http://www.atsdr.cdc.gov/toxprofiles/tp.asp?id=22&tid=3
-
- ATSDR (Agency for Toxic Substances and Disease Registry). (2016). Addendum to the toxicological profile for arsenic [ATSDR Tox Profile]. Atlanta, GA: Agency for Toxic Substances and Disease Registry, Division of Toxicology and Human Health Sciences; https://www.atsdr.cdc.gov/toxprofiles/Arsenic_addendum.pdf
-
- Baris D; Waddell R; Beane Freeman LE; Schwenn M; Colt JS; Ayotte JD; Ward MH; Nuckols J; Schned A; Jackson B; Clerkin C; Rothman N; Moore LE; Taylor A; Robinson G; Hosain GM; Armenti KR; Mccoy R; Samanic C; Hoover RN; Fraumeni JF; Johnson A; Karagas MR; Silverman DT Elevated Bladder Cancer in Northern New England: The Role of Drinking Water and Arsenic. J Natl Cancer Inst 2016;108 - PMC - PubMed
-
- Chen CL; Chiou HY; Hsu LI; Hsueh YM; Wu MM; Wang YH; Chen CJ Arsenic in drinking water and risk of urinary tract cancer: A follow-up study from northeastern Taiwan. Cancer Epidemiol Biomarkers Prev 2010;19:101–110 - PubMed
-
- Chiou H,-Y; Chiou S,-T; Hsu Y,-H; Chou Y,-L; Tseng C,-H; Wei M,-L; Chen C,-J. Incidence of transitional cell carcinoma and arsenic in drinking water: A follow-up study of 8,102 residents in an arseniasis-endemic area in northeastern Taiwan. Am J Epidemiol 2001;153:411–418 - PubMed
Publication types
MeSH terms
Substances
Grants and funding
LinkOut - more resources
Full Text Sources
Medical
Research Materials
