. 2020 Sep 11;127(7):877-892.
doi: 10.1161/CIRCRESAHA.120.316653. Epub 2020 Jun 22.

Transient Intermittent Hyperglycemia Accelerates Atherosclerosis by Promoting Myelopoiesis

Affiliations

Transient Intermittent Hyperglycemia Accelerates Atherosclerosis by Promoting Myelopoiesis

Michelle C Flynn et al. Circ Res. .

Abstract

Rationale: Treatment efficacy for diabetes mellitus is largely determined by assessment of HbA1c (glycated hemoglobin A1c) levels, which poorly reflects direct glucose variation. People with prediabetes and diabetes mellitus spend >50% of their time outside the optimal glucose range. These glucose variations, termed transient intermittent hyperglycemia (TIH), appear to be an independent risk factor for cardiovascular disease, but the pathological basis for this association is unclear.

Objective: To determine whether TIH per se promotes myelopoiesis to produce more monocytes and consequently adversely affects atherosclerosis.

Methods and results: To create a mouse model of TIH, we administered 4 bolus doses of glucose at 2-hour intervals intraperitoneally once to WT (wild type) or once weekly to atherosclerotic prone mice. TIH accelerated atherogenesis without an increase in plasma cholesterol, seen in traditional models of diabetes mellitus. TIH promoted myelopoiesis in the bone marrow, resulting in increased circulating monocytes, particularly the inflammatory Ly6-Chi subset, and neutrophils. Hematopoietic-restricted deletion of S100a9, S100a8, or its cognate receptor Rage prevented monocytosis. Mechanistically, glucose uptake via GLUT (glucose transporter)-1 and enhanced glycolysis in neutrophils promoted the production of S100A8/A9. Myeloid-restricted deletion of Slc2a1 (GLUT-1) or pharmacological inhibition of S100A8/A9 reduced TIH-induced myelopoiesis and atherosclerosis.

Conclusions: Together, these data provide a mechanism as to how TIH, prevalent in people with impaired glucose metabolism, contributes to cardiovascular disease. These findings provide a rationale for continual glucose control in these patients and may also suggest that strategies aimed at targeting the S100A8/A9-RAGE (receptor for advanced glycation end products) axis could represent a viable approach to protect the vulnerable blood vessels in diabetes mellitus. Graphic Abstract: A graphic abstract is available for this article.

Keywords: atherosclerosis; diabetes mellitus; inflammation; metabolism; stem cells.


Conflict of interest statement

DISCLOSURES

No competing interests

Figures
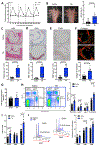
Figure 1:
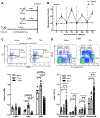
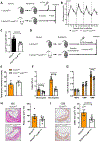
Figure 1:. TIH induces atherosclerosis in Apoe−/− mice.
Apoe−/− mice were subjected to the TIH procedure (4 injections of 2g/kg glucose, 2 hours apart) or saline (control) once a week for 10 weeks. A) Blood glucose levels measured prior to as well as 15min and 60min following each injection (indicated by dotted lines). B) Atherosclerosis in the aortic arch quantified by ORO. C) H&E, D) ORO (lipid), E) CD68 (macrophage) and F) Picrosirius red (collagen) in the aortic sinus (n=9–10/group). Scale bars: 50μM. G) Total plasma cholesterol (n=9/group). H) Blood monocytes and neutrophils (including flow plots with mean percentages ± SEM), and I) populations and J) proliferation of BM HSPCs, CMPs and GMPs quantified by flow cytometry (n=6/group). Data are presented mean ± SEM and analyzed using Student’s t-test (B, F-J) or for plaque areas as median with 95% CI and analyzed using a Mann-Whitney U test (C-E).
Figure 2:
Figure 2:. TIH induces myelopoiesis.
A) WT mice were subjected TIH or saline injections and assessed one or seven days later (n=6/group). B) Plasma glucose measurements were recorded prior to, 15min and 60min following each injection (dotted lines). C) BM HSPCs, CMPs and GMPs and D) blood monocytes and neutrophils were quantified by flow cytometry (flow plots with mean percentages ± SEM). Data are presented mean ± SEM and analyzed using a One-way ANOVA followed by Tukey’s multiple comparisons test, all pairwise comparisons among 3 groups (3 times).
Figure 3:
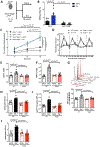
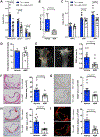
Figure 3:. Deletion of RAGE protects against TIH-induced myelopoiesis and atherosclerosis.
A) Apoe−/− (n=9) and Apoe−/−/Rage−/− (n=10) mice received weekly TIH or saline treatments for 10 weeks, B) Atherosclerosis in the aortic arch quantified by ORO. C) Leukocyte-endothelial adhesion was measured using whole blood perfused through aortas obtained from Apoe−/− and Apoe−/−/Rage−/− mice 7 days following TIH or saline (n=4 for Apoe−/−/Rage−/− + TIH and n=5/group for all other groups). D-J) WT and Rage−/− mice were subjected to D) TIH and 1 day later BM E) CMPs, F) GMPs, G) GMP proliferation and 7 days later blood H) monocytes, I) Ly6-Chi monocytes and J) neutrophils quantified by flow cytometry; n=8 for Rage−/− + TIH and n=6/group for all other groups. Data are presented mean ± SEM, analyzed using a Two-way ANOVA followed by Tukey’s multiple comparisons test, all pairwise comparisons among 4 groups (6 times) (B, E-J), or a repeated measures Two-way ANOVA (PTime=3.97×10⁻⁶, PTIH=3.25×10⁻⁴, PTimexTIH=1.65×10⁻⁴, no significant variation observed from KO, Time × KO, KO × TIH, or KO × Time × TIH) and Tukey’s multiple comparison’s test, all pairwise comparisons among 4 groups over 3 timepoints (66 times) (C).
Figure 4:
Figure 4:. Disrupting the RAGE-S100A8/A9 axis protects against TIH-induced myelopoiesis.
A) Experimental outline of Rage−/− BM transplant study: Following reconstitution recipient mice were subjected TIH and assessed 1 or 7 days later. Seven days post-TIH blood B) Monocytes, C) Ly6-Chi monocytes were quantified by flow cytometry (n=6/saline group, n=7 for WT + TIH and n=9 for Rage−/− + TIH). One day post-TIH BM D) progenitor abundance and E) proliferation quantified by flow cytometry (n=6/saline group, n=9–10/TIH group). F) S100a9 mRNA expression in the blood leukocytes in WT mice measured 1 and 7 days following TIH (n=4–6/group). G-J) WT mice transplanted with either G, H) S100a9−/− or WT BM or I, J) S100a8−/− or WT BM and subjected to the G, I) TIH procedure and H, J) circulating Ly6-Chi monocytes quantified after 7 days by flow cytometry (n=3–7/group). K) S100A8/A9 concentrations from plasma collected one day following TIH procedure from mice transplanted with S100a8−/− or WT BM; n.d.: not detected (n=3–6/group). Data are presented mean ± SEM and analyzed using a Two-way ANOVA, all pairwise comparisons among 4 groups (6 times) (B-E, H,J,K), or a One-way ANOVA followed by Tukey’s multiple comparisons test, all pairwise comparisons among 3 groups (3 times) (F).
Figure 5:
Figure 5:. Human neutrophils release S100A8/A9 under hyperglycemic conditions in vitro.
Isolated human blood neutrophils were exposed to 25mmol/L glucose after being pre-treated for 1hr with or without 2-deoxy-D-glucose (2-DG, 5mmol/L) or N-acetylcysteine (NAC, 1mmol/L). A) Extracellular acidification rate (ECAR; glycolysis) in response 25mmol/L glucose (dotted line) represented as change in from baseline. B) ECAR represented as area under curve (AUC). C) Neutrophil S100A9 mRNA expression after 4hrs in 25mmol/L glucose. D) S100A8/A9 content measured by flow cytometry at 30min of 25mmol/L glucose exposure with 2-DG pre-treatment. E) Superoxide levels (DHE) measured by flow cytometry at 30min of 25mmol/L glucose exposure (2-DG or NAC pre-treatment). Neutrophil S100A8/A9 content measured by flow cytometry at 30min of 25mmol/L glucose exposure with F) NAC and G) apocynin pre-treatments. Data are presented mean ± SEM with n=3–7/group and analyzed using a One-way ANOVA followed by Dunnett’s multiple comparisons test, pairwise comparisons to the glucose treatment group (B-D, F-G: 2 times, E: 3 times).
Figure 6:
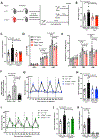
Figure 6:. Myeloid cell-specific deletion of GLUT-1 protects against TIH-induced myelopoiesis.
A-C) WT or D-I) Ldlr−/− mice transplanted with BM from Slc2a1fl/fl LysMcre/cre Cre mice or their Slc2a1fl/fl littermate controls were subjected to TIH. WT mice underwent one day of TIH while Ldlr−/− underwent the TIH procedure twice weekly for 9wks. B) Blood glucose levels during the TIH procedure (n=5/group). C) Blood Ly6-Chi monocytes 7 days following TIH by flow cytometry (n=5/group). D) Atherosclerosis experimental overview. E) Total plasma cholesterol (n=5 for Slc2a1fl/fl and n=6 for Slc2a1fl/fl LysMcre/cre). F) Blood monocytes and neutrophils (n=4 for Slc2a1fl/fl and n=6 for Slc2a1fl/fl LysMcre/cre), G) BM HSPCs, CMPs and GMPS measured by flow cytometry (n=5 for Slc2a1fl/fl and n=6 for Slc2a1fl/fl LysMcre/cre). H) Atherosclerotic plaque size (H&E) in the aortic sinus and I) plaque macrophages (CD68+) (n=5 for Slc2a1fl/fl and n=6 for Slc2a1fl/fl LysMcre/cre). Scale bars: 50μM. Data are presented mean ± SEM and analyzed using a Student’s t-test.
Figure 7:
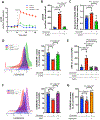
Figure 7:. Blocking S100A8/A9 with ABR-215757 decreases myelopoiesis and atherosclerosis in TIH mice.
Apoe−/− mice were treated with or without ABR-215757 (10mg/kg/day in drinking water) and subjected to weekly TIH for 10 weeks. A) Blood monocytes (n=8 for vehicle, n=10 for ABR-215757), B) neutrophils and C) BM HSPCs, CMPs and GMPs were measured by flow cytometry (n=9 for vehicle, n=10 for ABR-215757). D) Total plasma cholesterol. E) Atherosclerosis in the aortic arch quantified by Oil Red O staining. F-I) In the aortic sinus plaques were assessed by F) H&E (size), G) CD68+ (macrophages), H) Oil Red O (lipid) and I) Picrosirius red (collagen). Scale bars: 50μM. Data are presented mean ± SEM and analyzed using a Student’s t-test (A, C-I) or as median with 95% CI and analyzed using a Mann-Whitney U test (B).

Comment in

References

    1. Beckman JA, Creager MA and Libby P. Diabetes and atherosclerosis: epidemiology, pathophysiology, and management. Jama. 2002;287:2570–81. - PubMed
    1. Nagareddy PR, Murphy AJ, Stirzaker RA, Hu Y, Yu S, Miller RG, Ramkhelawon B, Distel E, Westerterp M, Huang LS, Schmidt AM, Orchard TJ, Fisher EA, Tall AR and Goldberg IJ. Hyperglycemia promotes myelopoiesis and impairs the resolution of atherosclerosis. Cell metabolism. 2013;17:695–708. - PMC - PubMed
    1. Boussageon R, Bejan-Angoulvant T, Saadatian-Elahi M, Lafont S, Bergeonneau C, Kassai B, Erpeldinger S, Wright JM, Gueyffier F and Cornu C. Effect of intensive glucose lowering treatment on all cause mortality, cardiovascular death, and microvascular events in type 2 diabetes: meta-analysis of randomised controlled trials. BMJ. 2011;343:d4169. - PMC - PubMed
    1. Monnier L, Colette C, Dejager S and Owens D. Residual dysglycemia when at target HbA(1c) of 7% (53mmol/mol) in persons with type 2 diabetes. Diabetes Res Clin Pract. 2014;104:370–5. - PubMed
    1. Monnier L and Colette C. Postprandial and basal hyperglycaemia in type 2 diabetes: Contributions to overall glucose exposure and diabetic complications. Diabetes Metab. 2015;41:6S9–6S15. - PubMed

Publication types

MeSH terms