

How subgroup analyses can miss the trees for the forest plots: A simulation study
- PMID: 32565216
- PMCID: PMC7529905
- DOI: 10.1016/j.jclinepi.2020.06.020
How subgroup analyses can miss the trees for the forest plots: A simulation study
Abstract
Objectives: Subgroup analyses of clinical trial data can be an important tool for understanding when treatment effects differ across populations. That said, even effect estimates from prespecified subgroups in well-conducted trials may not apply to corresponding subgroups in the source population. While this divergence may simply reflect statistical imprecision, there has been less discussion of systematic or structural sources of misleading subgroup estimates.
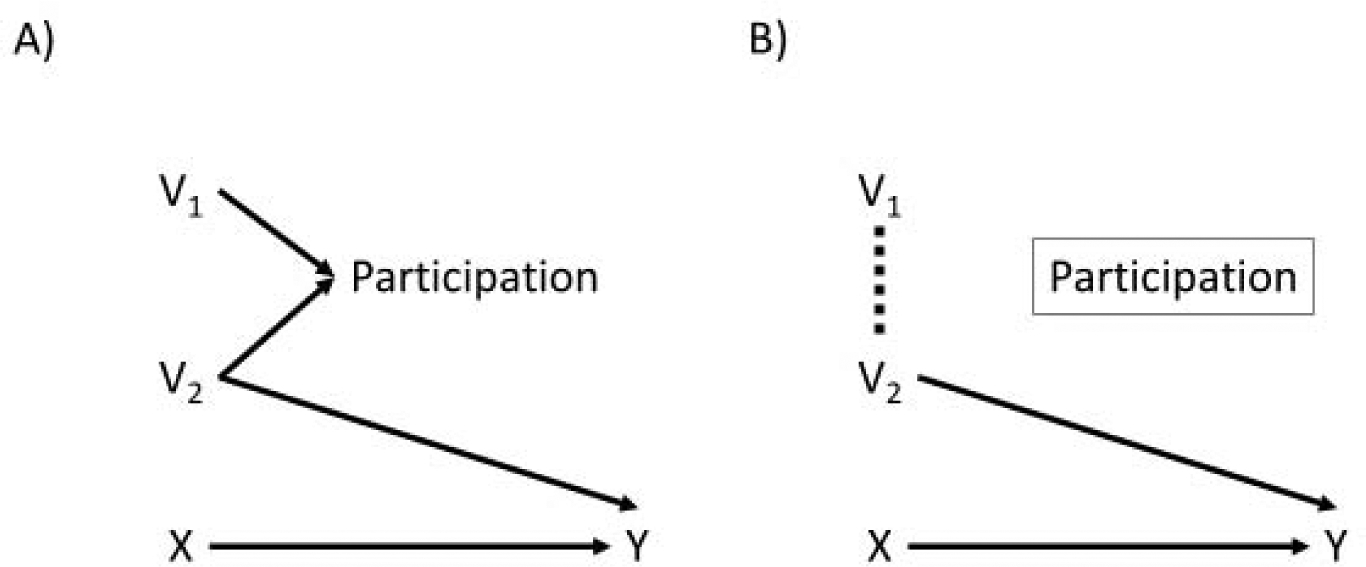
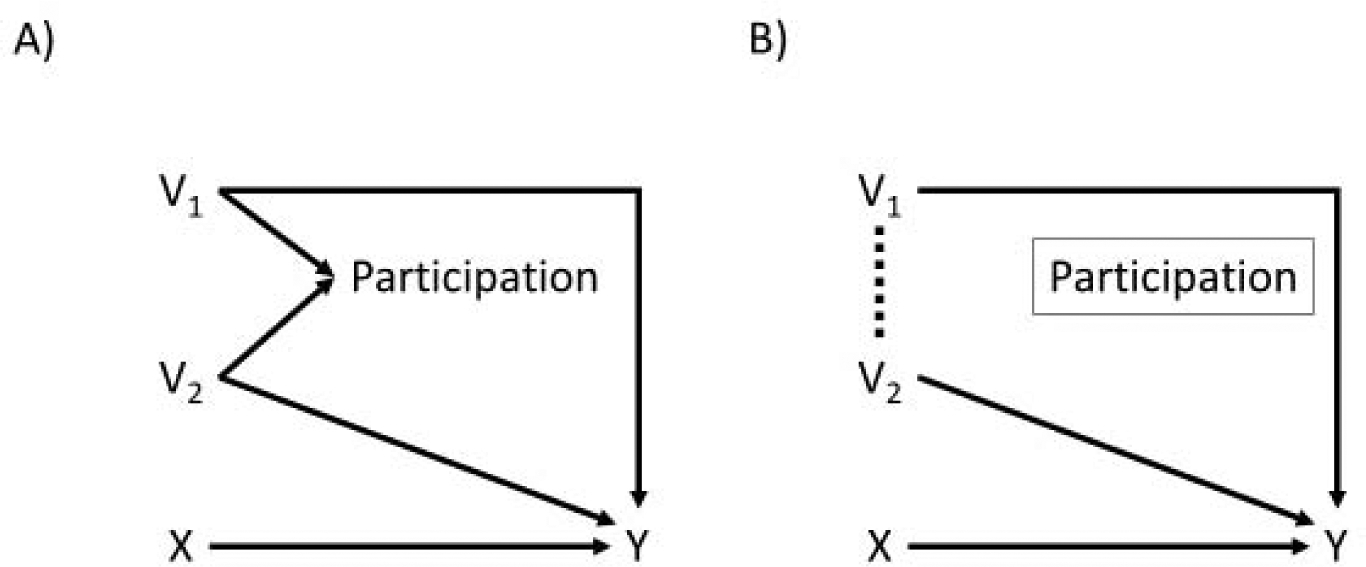
Study design and setting: We use directed acyclic graphs to show how selection bias caused by associations between effect measure modifiers and trial selection, whether explicit (e.g., eligibility criteria) or implicit (e.g., self-selection based on race), can result in subgroup estimates that do not correspond to subgroup effects in the source population. To demonstrate this point, we provide a hypothetical example illustrating the sorts of erroneous conclusions that can result, as well as their potential consequences. We also provide a tool for readers to explore additional cases.
Conclusion: Treating subgroups within a trial essentially as random samples of the corresponding subgroups in the wider population can be misleading, even when analyses are conducted rigorously and all findings are internally valid. Researchers should carefully examine associations between (and consider adjusting for) variables when attempting to identify heterogeneous treatment effects.
Keywords: Subgroups; causal graphs; external validity; selection bias.
Copyright © 2020 Elsevier Inc. All rights reserved.
Conflict of interest statement
Figures
Similar articles
-
Subgroup analyses in randomised controlled trials: quantifying the risks of false-positives and false-negatives.Health Technol Assess. 2001;5(33):1-56. doi: 10.3310/hta5330. Health Technol Assess. 2001. PMID: 11701102 Review.
-
Statistical approaches to identify subgroups in meta-analysis of individual participant data: a simulation study.BMC Med Res Methodol. 2019 Sep 2;19(1):183. doi: 10.1186/s12874-019-0817-6. BMC Med Res Methodol. 2019. PMID: 31477023 Free PMC article.
-
Standardization for subgroup analysis in randomized controlled trials.J Biopharm Stat. 2014;24(1):154-67. doi: 10.1080/10543406.2013.856023. J Biopharm Stat. 2014. PMID: 24392983 Free PMC article. Review.
-
Preventable sources of bias in subgroup analyses and secondary outcomes of randomized trials.Contemp Clin Trials. 2024 Oct;145:107641. doi: 10.1016/j.cct.2024.107641. Epub 2024 Jul 27. Contemp Clin Trials. 2024. PMID: 39074532
-
Model averaging for treatment effect estimation in subgroups.Pharm Stat. 2017 Mar;16(2):133-142. doi: 10.1002/pst.1796. Epub 2016 Dec 9. Pharm Stat. 2017. PMID: 27935199
Cited by
-
Variable selection when estimating effects in external target populations.Am J Epidemiol. 2024 Aug 5;193(8):1176-1181. doi: 10.1093/aje/kwae048. Am J Epidemiol. 2024. PMID: 38629587 Free PMC article.
-
Tutorial on directed acyclic graphs.J Clin Epidemiol. 2022 Feb;142:264-267. doi: 10.1016/j.jclinepi.2021.08.001. Epub 2021 Aug 8. J Clin Epidemiol. 2022. PMID: 34371103 Free PMC article.
References
-
- Downs JR, Clearfield M, Weis S, et al. Primary prevention of acute coronary events with lovastatin in men and women with average cholesterol levels: results of AFCAPS/TexCAPS. Air Force/Texas Coronary Atherosclerosis Prevention Study. JAMA. 1998; 279: 1615–22. - PubMed
-
- Westreich D Epidemiology by Design: A Causal Approach to the Health Sciences. Oxford University Press, 2019.
-
- Tanniou J, Tweel IV, Teerenstra S and Roes KC. Level of evidence for promising subgroup findings in an overall non-significant trial. Statistical Methods in Medical Research. 2016; 25: 2193–213. - PubMed
-
- Brookes ST, Whitley E, Peters TJ, Mulheran PA, Egger M and Davey Smith G. Subgroup analyses in randomised controlled trials: quantifying the risks of false-positives and false-negatives. Health Technology Assessment (Winchester, England). 2001; 5: 1–56. - PubMed
Publication types
MeSH terms
Grants and funding
LinkOut - more resources
Full Text Sources
Medical
